Abstract
The size and persistence of inflation post-COVID-19 was among the largest problems the U.S. economy has faced in decades. The rise in house prices was a major contributor to this inflationary episode. Understanding this housing boom is critical for policymakers to connect the consequences of their actions, particularly as it relates to the relationship between inflation and quantitative easing (QE). This paper examines the impact of quantitative easing undertaken by the Federal Reserve from 2020 to 2022, during which the Fed’s mortgage-backed securities (MBS) purchases ($1.33 trillion) were equal to nearly 90% of the growth in MBS ($1.50 trillion). Evidence suggests that housing’s unique role as an asset class is a factor explaining the rise in the cost of housing and hence overall inflation. Should this be the case, the Federal Reserve should reconsider the impact of future quantitative easing on housing values and, subsequently, shelter inflation.
I. Introduction
COVID-19 shocked the global economy, causing a severe recession. Monetary and fiscal policy activated to support the economy and later transitioned to fighting inflation after the recovery. In the initial period following the onset of the pandemic, the Federal Reserve’s (Fed) monetary policy response was to cut interest rates to the zero lower bound, activate a series of emergency lending facilities to support a wide array of financial assets, and engage in quantitative easing (QE). Post-recession the Fed began raising interest rates, ended its emergency lending facilities, and stopped QE.
The recovery from the COVID pandemic brought the highest inflation the U.S. has seen in decades; annual growth of the Consumer Price Index (CPI) reached 9% in 2022.1 Economists continue to debate the causes of this inflationary episode. COVID supply shocks, unprecedented fiscal stimulus, and rapidly shifting consumption preferences have all received substantial attention as underlying factors triggering inflation.2 At the Fed’s 2024 Jackson Hole Economic Symposium, Federal Reserve Chairman Jerome Powell gave a list of reasons for inflation in the U.S.: “supply chain shocks, speed of demand snap-back post-pandemic, Russia’s invasion of Ukraine, and tight labor markets.”3 Housing was absent altogether from his list.
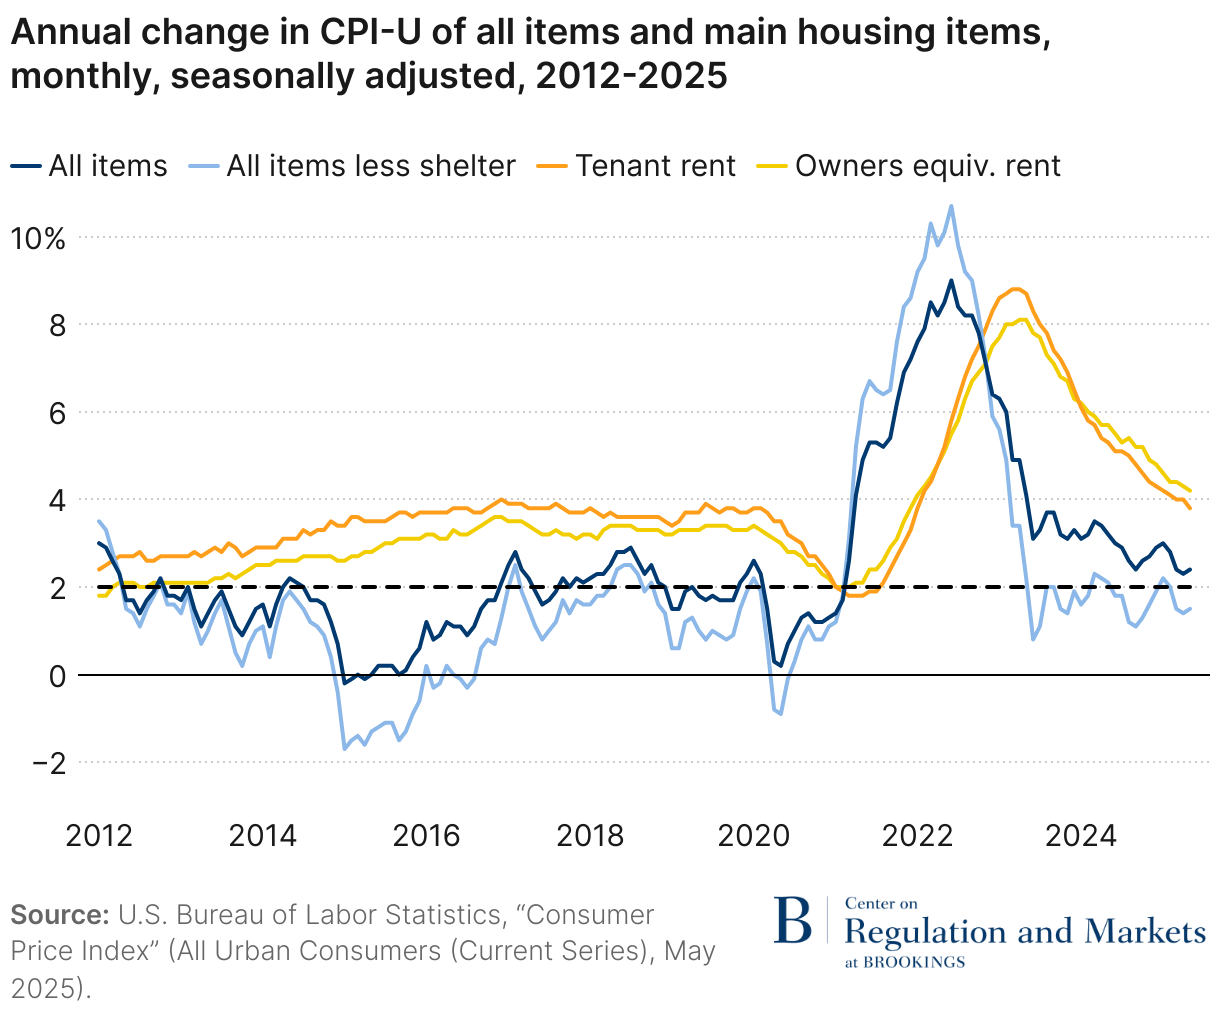
However, the path of housing inflation differed from overall inflation and remains elevated while other categories have cooled. As shown in Figure 1, before COVID, housing inflation had been stable and above overall CPI. During the inflation spike in 2021, housing inflation remained low initially, falling below overall inflation for the first time in almost a decade. After overall inflation took off, housing inflation followed. While overall inflation peaked in mid-2022, housing inflation kept rising, peaking almost a full year later in early 2023. Subsequently, while overall inflation has eased, housing inflation remains elevated at an annual change of 5% in mid-2024 and 4% in mid-2025, whereas overall CPI is down to 3% and non-housing inflation is down to 2%. The persistence of housing inflation is a leading factor in the persistence of overall inflation above the 2% target even long after other sectors have cooled.
The cost of housing is central to America’s inflationary episode. Housing is the largest expenditure for most households and accounts for 45% of CPI.4 Housing comprises many sub-elements of CPI, including items involved in the cost of maintaining a home (furniture, insurance, appliances, the cost of housing away from home, etc.). This paper is focused on the cost of the house itself, either as the value of the home for a homeowner or the cost of rent for a renter. These make up the largest component of housing, as one would expect. Shelter, the term used by CPI for this, is 36% of total CPI and equal to 80% of the overall element within housing.5 Shelter includes owner’s equivalent rent of residence, the metric that CPI uses to assess the value of a homeowner’s home (if they were to rent it) which alone is more than one-quarter of total CPI. It also includes tenant rent which comprises 7.7% of overall CPI.6 That tenant rent is a smaller portion of overall CPI reflects that just over one-third of Americans are renters, whereas two-thirds live in a home they or their family owns.7 The paper focuses mostly on the impact of house prices, central to owner’s equivalent rent. This value can also impact the cost to rent housing.
Further complicating the consideration of housing inflation in policy is the fact that Fed inflation forecasts have been wrong on housing inflation. In August 2023, the Federal Reserve Bank of San Francisco projected that shelter inflation was “likely to slow,” predicting a steady decline of shelter inflation reaching 0% growth in mid-2024.8 Instead, shelter inflation remained elevated, increasing by 5% annually in mid-2024 and 4% in mid-2025. If actual shelter inflation had followed the San Francisco Fed projections, overall CPI growth would have been below the Fed’s 2% target in 2024, instead of above it.9 Given the Fed’s decision to keep interest rates elevated until September 2024 due to persistent inflation, it is quite possible that had housing inflation decreased as the Fed projected or even at the same time and rate as the rest of the economy, the Federal Reserve may well have begun to cut interest rates months earlier.10
This paper examines the Federal Reserve’s role in housing inflation focusing on the impact of QE. The Fed’s QE program consisted of large-scale purchases of U.S. Treasuries and mortgage-backed securities (MBS) with the purpose of further lowering interest rates after the Federal Funds rate had reached the zero lower bound. The thesis is that the Fed’s large purchase of MBS, implemented as part of QE from 2020 to 2022, contributed to home price appreciation, causing some of the housing inflation that the Fed subsequently raised interest rates to combat. While higher interest rates weaken demand, increased rates had a limited cooling effect on housing inflation due to downward price rigidity in the housing market. If correct, the Fed needs to rethink its playbook of actions when monetary policy reaches the lower bound, specifically to consider the price impacts of the assets it purchases.
This paper is organized as follows: Section two discusses the theory of how and why QE would have an impact on house prices. Section three examines the impact of QE on the housing market from March 2020 to March 2022 and effects at play after QE from March 2022 onwards. The paper concludes with a section examining alternative explanations for the changes seen in the housing market (section four).
II. What is quantitative easing (QE) and how does it impact house prices?
QE is the purchase of assets on the open market by the Fed. QE began as a theoretical response to questions of what a central bank could do should it be caught by the so-called “zero lower bound” of interest rate policy (setting interest rates at zero). The Fed faced this dilemma after the 2008 global financial crisis (GFC). The GFC’s epicenter was America’s housing finance system, with a combination of poorly underwritten, highly leveraged mortgages leading to a boom and bust of American housing.11 As part of the response to the GFC, the Fed initiated QE in November 2008.12
The Fed is limited by law as to what assets it can purchase to implement QE. Section 14 of the Federal Reserve Act prescribes the assets the Fed can buy: direct obligations of the U.S. Treasury (Treasuries) and obligations guaranteed by select government-sponsored enterprises (GSEs).13 In practice, the only GSE securities that can be purchased by the Fed are mortgage-backed securities (MBS) created by Fannie Mae, Freddie Mac, or Ginnie Mae. These three enterprises purchase, guarantee, and securitize the majority of mortgages in America, and their MBS debt is often referred to as “agency MBS.”
The Federal Reserve’s legal restrictions to buying Treasury and housing-backed assets results in those two assets being the method through which QE is implemented. As then Fed Chairman Ben Bernanke stated, “In using the Federal Reserve’s balance sheet as a tool for achieving its mandated objectives of maximum employment and price stability, the FOMC [Federal Open Market Committee] has focused on the acquisition of longer-term securities—specifically, Treasury and agency securities, which are the principal types of securities that the Federal Reserve is permitted to buy under the Federal Reserve Act.”14
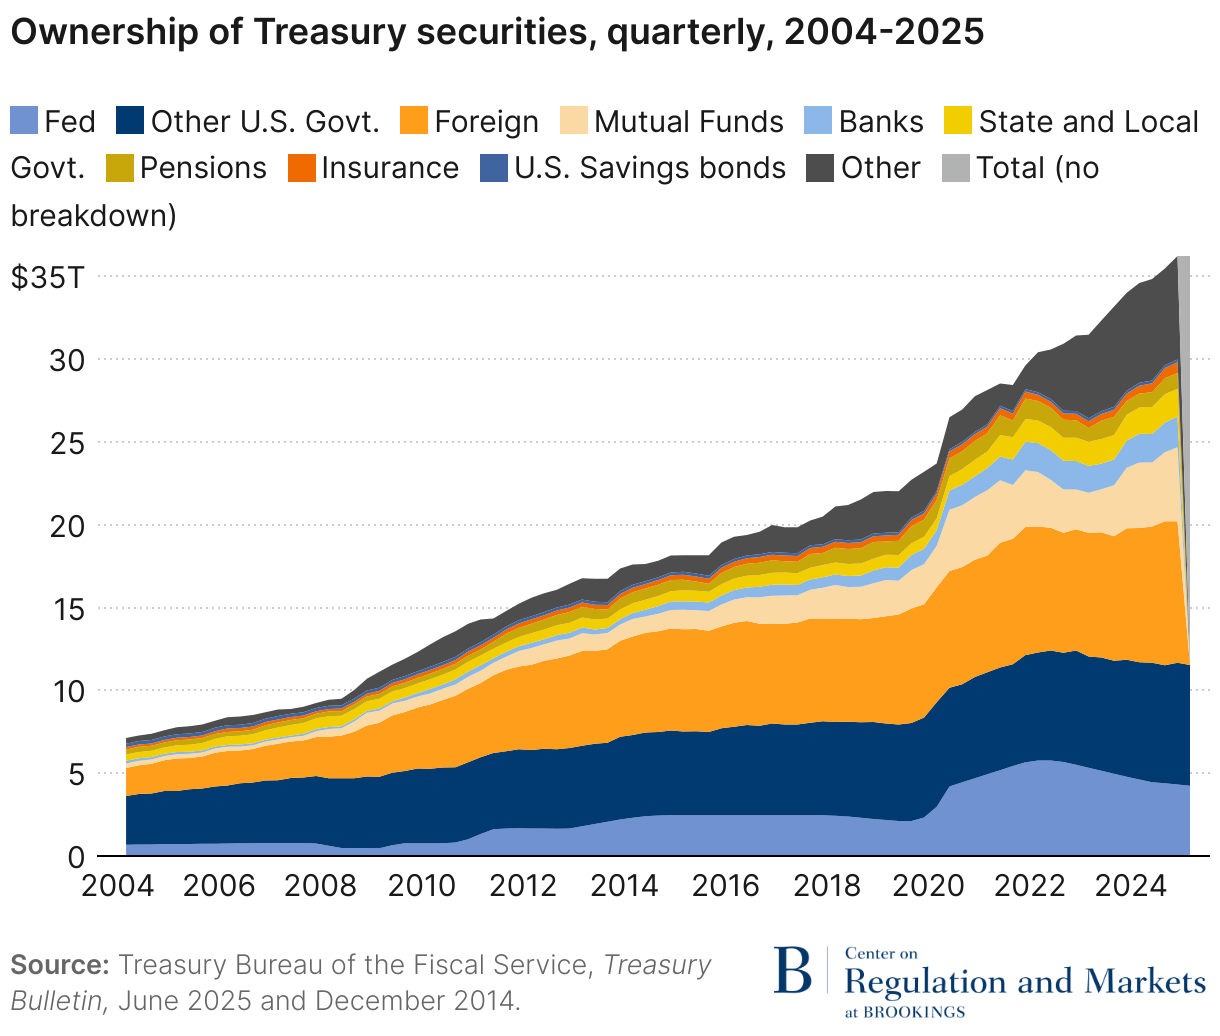
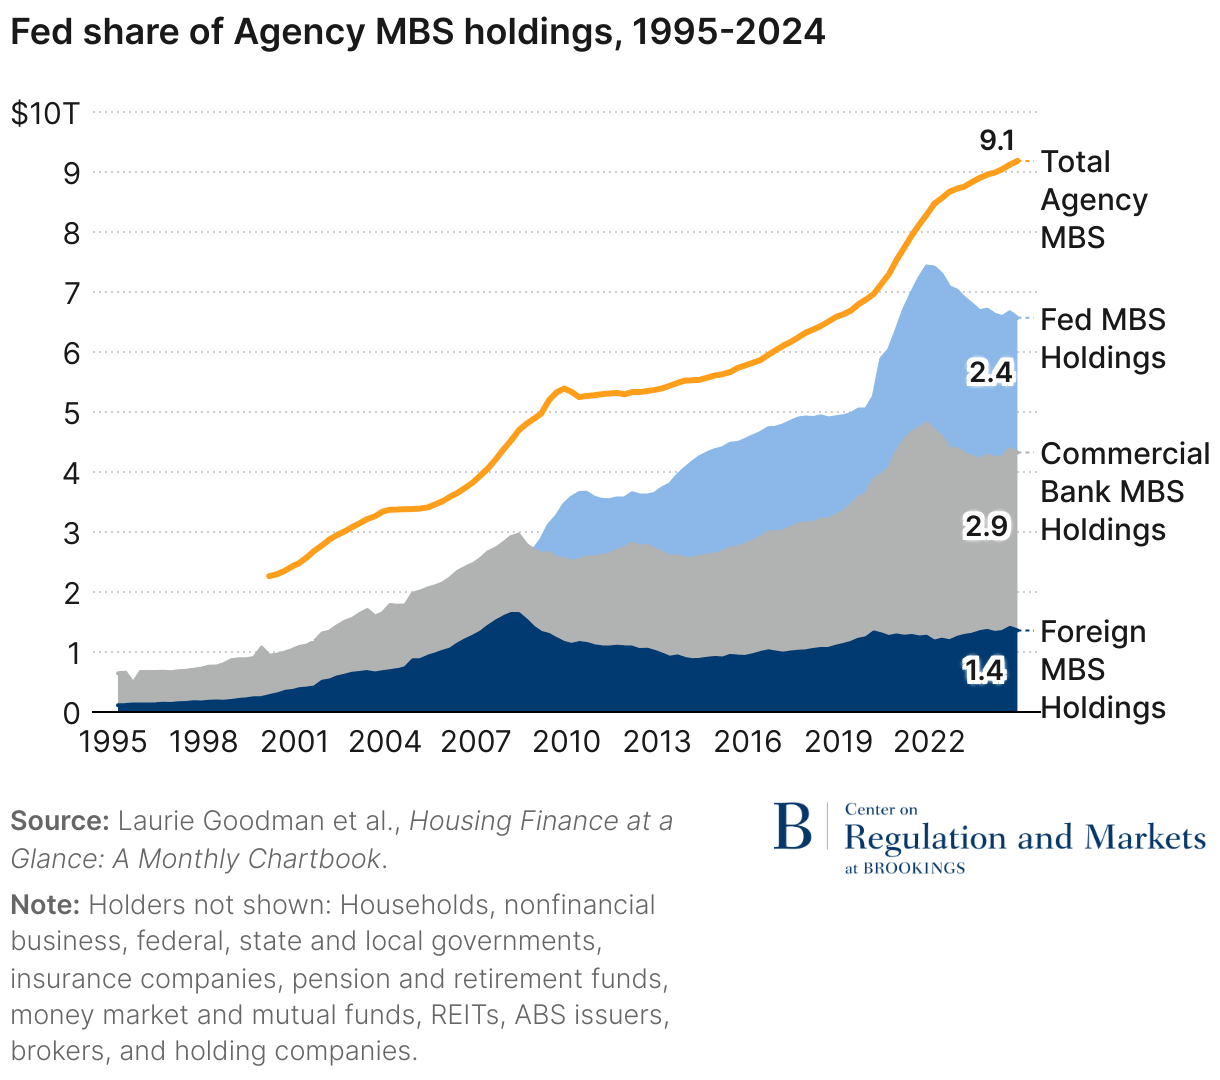
Treasury and mortgage debt markets are the largest debt markets in the United States. The Treasury market reached $36 trillion while the mortgage market is over $9 trillion. As a result of the two rounds of QE, the Fed is now a significant holder of both assets. At its peak in mid-2022, the Fed owned nearly one-fifth of all Treasuries and over a quarter of agency MBS. Figures 2 and 3 below show the Fed’s share of ownership of Treasuries and mortgages. While the Fed had always held Treasuries as part of its standard monetary policy, its role as a substantial owner of mortgage debt is relatively new.
QE lasted until March 2022 when the Fed stopped buying new securities. The Fed held its MBS holdings steady (purchasing new to compensate for existing roll-off) for three months. Starting in June 2022, the Fed has been allowing its portfolio to naturally run-off.15 Some call the slow roll down quantitative tightening (QT). However, there is a difference between allowing the MBS holdings to naturally shrink as people pay-off, refinance, or otherwise terminate their mortgages and the Fed selling MBS back to the market.
The Federal Reserve: Largest player in the housing market
How large was the Fed’s purchase in this market? The Fed’s ownership of $2.7 trillion of agency MBS in 2022 was 32% of the entire $8.5 trillion MBS market. During the 2020-2022 QE period, total agency MBS increased by $1.50 trillion, of which the Fed purchased $1.33 trillion.16 The Fed’s MBS purchases were equal to nearly 90 percent of the growth in MBS during the QE period.
The agency MBS market is not the complete housing market. It focuses mostly on single family homes (defined as one to four units) that require a mortgage. This excludes homes purchased with all cash, which has been about one-third of homes purchased since the pandemic.17 It does not include mortgages made that were not eligible for MBS (jumbo, large portions of commercial real-estate not sent through the GSEs, bank-held mortgages).
However, agency MBS-supported housing remains the lion’s share of home mortgages. Fannie Mae, Freddie Mac, and Ginnie Mae mortgages together account for more than 65% of total mortgages.18 Further, these mortgages make up almost the entirety for first-time homebuyers who are either transitioning from being renters to homebuyers or leaving a prior family housing unit to start a new one. First-time homebuyers comprised 32% of total home sales in 2022, showing their importance to driving the home buying market.19 Agency MBS is also a major component for rental housing. While many renters are in large apartment buildings, about half of rental units are one to four unit homes.20
How QE impacts house prices
The channel for QE impact on house prices is as follows. The Fed’s demand for MBS increases the value of mortgages. The incentive to create mortgages results in lower mortgage rates, inducing people to buy or refinance. Lower mortgage rates also increase housing demand as homeownership becomes more affordable. The basic laws of supply and demand lead to an assumption that a large increase in demand will impact price and quantity. Impacts on price are magnified when quantity is fixed in the short run. Housing has a limited ability to adjust supply in the short run; it takes time to build a house and some markets are constrained due to regulation or not having enough land. This suggests impact on house prices in the short run.
Former Fed Chair Ben Bernanke acknowledged the impact of MBS purchases on yields, stating:
Federal Reserve purchases of mortgage-backed securities (MBS), for example, should raise the prices and lower the yields of those securities; moreover, as investors rebalance their portfolios by replacing the MBS sold to the Federal Reserve with other assets, the prices of the assets they buy should rise and their yields decline as well. Declining yields and rising asset prices ease overall financial conditions and stimulate economic activity through channels similar to those for conventional monetary policy.
Ben Bernanke, “Monetary Policy since the Onset of the Crisis.”
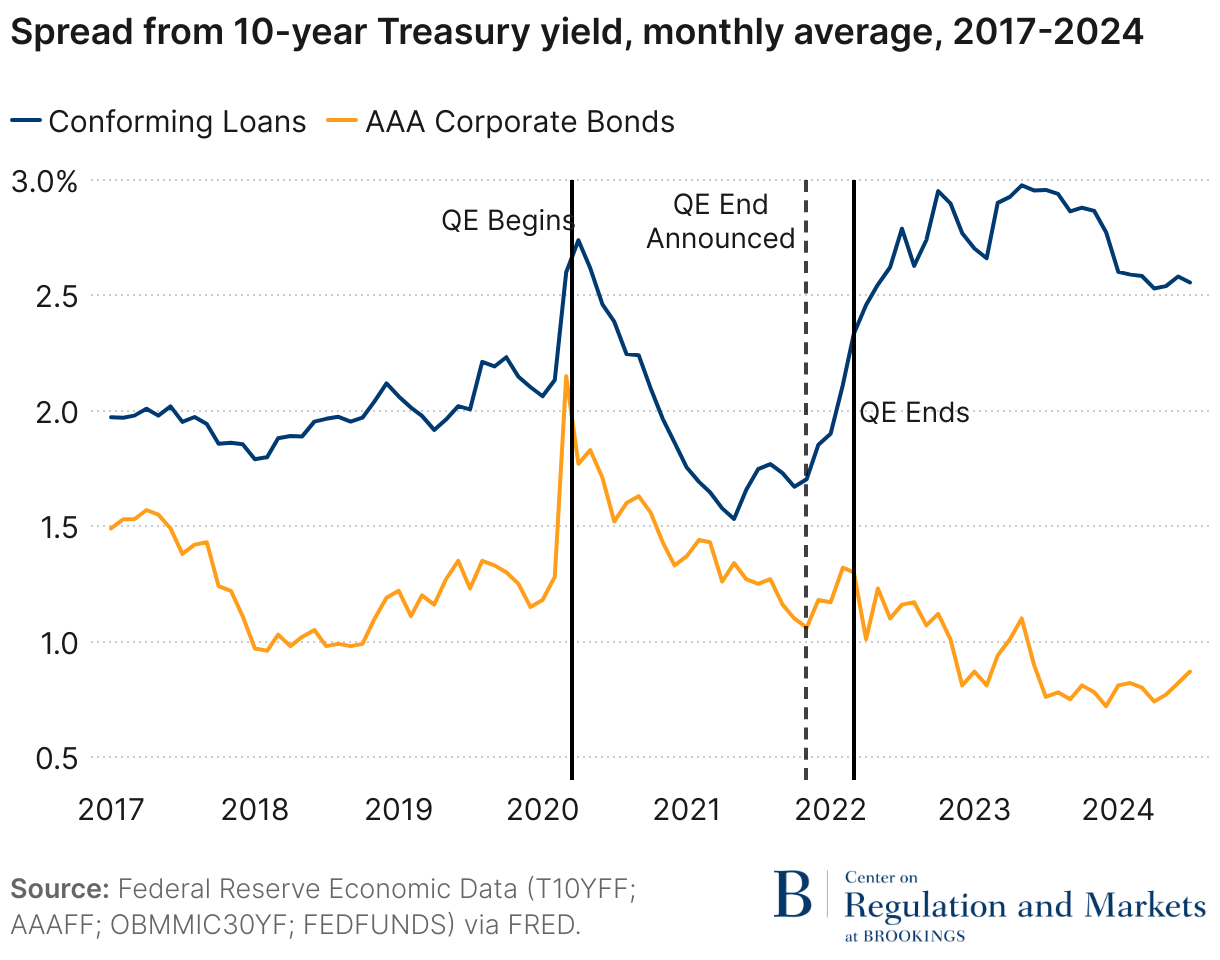
The rebalancing actions of investors should spread the yield decrease throughout other assets. However, we find that while mortgage rate spreads decreased during QE, they increased after QE, suggesting MBS purchases during QE compressed mortgage rates more than yields of other similarly rated assets, such as AAA corporate bonds (Figure 4). The rebalancing may not have been able to evenly spread the impact of QE across other assets due to the Fed purchasing almost 90% of the growth in MBS during this period. A study published by the Federal Reserve Bank of Kansas City corroborates these findings stating, “A 10 percentage point increase in Fed holdings as a share of total MBS leads to a 40-bps decline in the mortgage spread.”21 The impact of the Fed’s purchases on MBS spreads started to reverse when the Fed announced the end of its MBS purchases under QE in November 2021, with purchasing ending in March 2022, as shown in Figure 4.
A reduction in spreads on MBS also occurred during the Fed’s prior QE experience following the GFC of 2007-2009.22 Because the GFC’s epicenter was the housing market, traditional housing spreads were skewed, and many other factors were at play. We are hesitant to rely too heavily on that experience given the other factors at play then. Nonetheless, analysis from the Federal Reserve Bank of New York found, “The flow of Federal Reserve purchases may have helped to restore liquidity in these markets and reduced the liquidity risk of holding those securities, thereby narrowing the spreads of yields on agency debt and MBS to yields on Treasury securities and reducing the cost of financing agency-related securities.”23
Lower mortgage rates decrease the cost of accessing the capital required to buy a home and, given the fixed rate nature of mortgages, the overall user cost for the lifecycle of the home. Individuals can purchase a larger home for the same monthly payment, or they can get a mortgage that costs less per month than renting. The intuition is that lower rates would lead to an increase in demand and thus an increase in price. Higher interest rates would then lead to the opposite, resulting in a decrease in home prices.
Correlation between house price and mortgage rates
In contrast to the assertions above, studies have found that mortgage rates are positively correlated with home price.24 Periods of greater home price appreciation tend to coincide with periods with higher interest rates and vice versa. This relationship is due to the positive correlation of both high interest rates and home price appreciation with strong macroeconomic growth. As Goodman and Neal observe, the Fed raises interest rates during periods of “stronger economic growth, lower unemployment, and stronger wage growth.” Thus, those periods are “associated with high home price appreciation” as well as higher interest rates.25 Put simply, the correlation between interest rates and home prices are observed to behave differently than economic theory predicts because of the underlying change in overall economic conditions and the counter-cyclical reaction of the Fed.
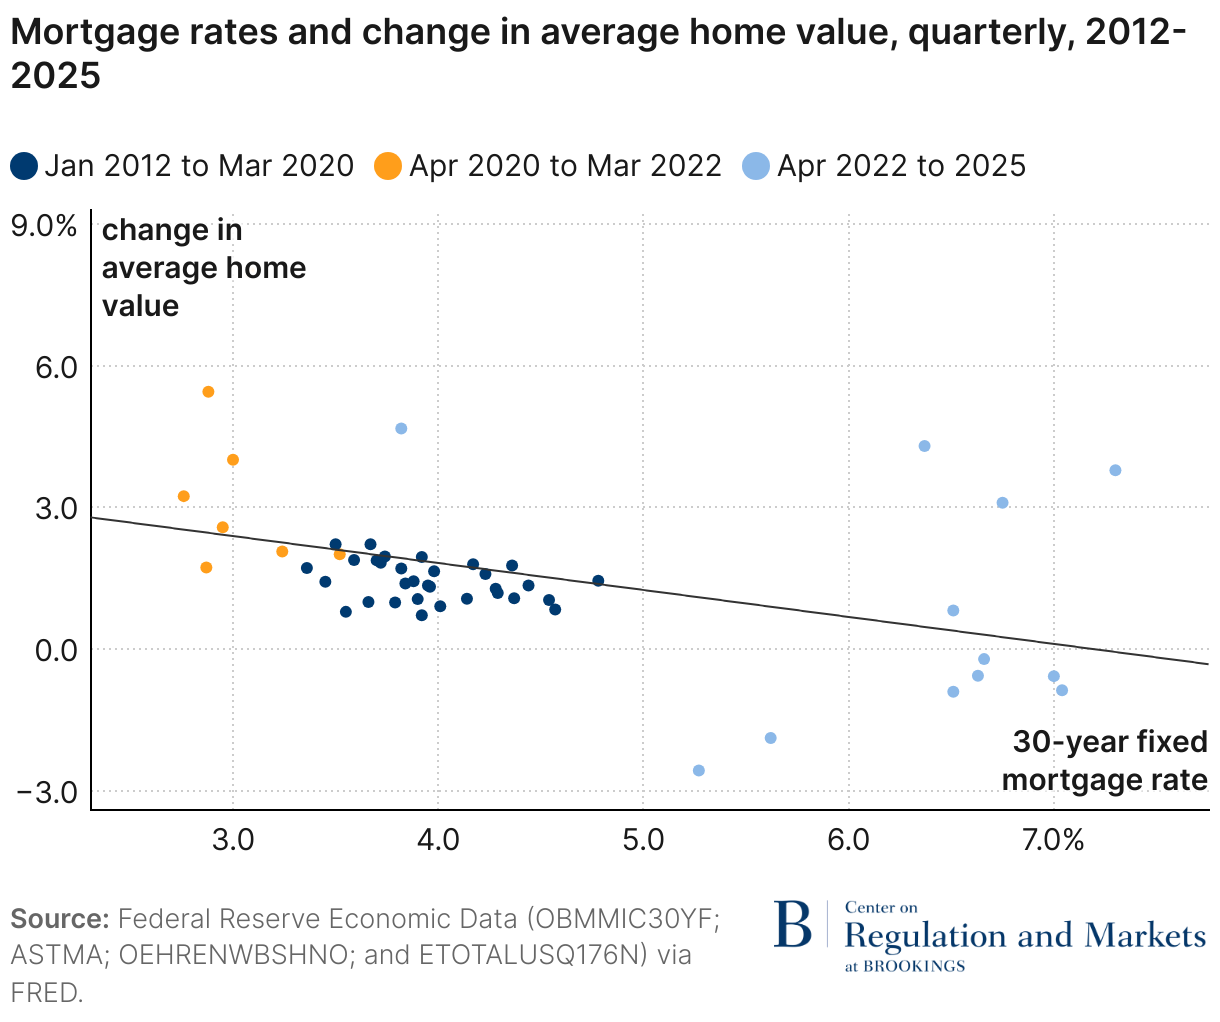
The most recent era after the GFC—between 2012 and the onset of COVID-19—had little variation in interest rates. The recent data points towards a negative correlation, as predicted by economic theory and shown in Figure 5. The negative correlation can be observed during stable economic conditions from 2012 to 2019 and volatile conditions from 2020 to 2024. A study published by the Kansas City Fed also supports the economic theory since they found lower mortgage rates increased mortgage originations, which implies an increase in housing demand.26 According to Drechsler et al., QE was responsible for about half of the $3 trillion of gross mortgage originations during this recent cycle.27
III. Housing market analysis
Starting in 2020, the housing market deviated from its pre-pandemic path. We identify three key trends which shifted in 2020 after QE began and in 2022 after QE ended:
- Housing values soared during QE and plateaued after.
- Home sales increased sharply during QE and dropped after.
- There was a wave of refinancing during QE.
These three trends are correlated with the Fed’s MBS purchases, and we believe have a causal relationship as we will explore. This section then discusses the impact of MBS purchases on the housing market and the broader economy through housing wealth effects. Additionally, we consider effects at play in the housing market after the end of QE in 2022 (interest rate lock-in, home equity and loss aversion effects) and their role in maintaining plateaued house prices and sparse home sales.
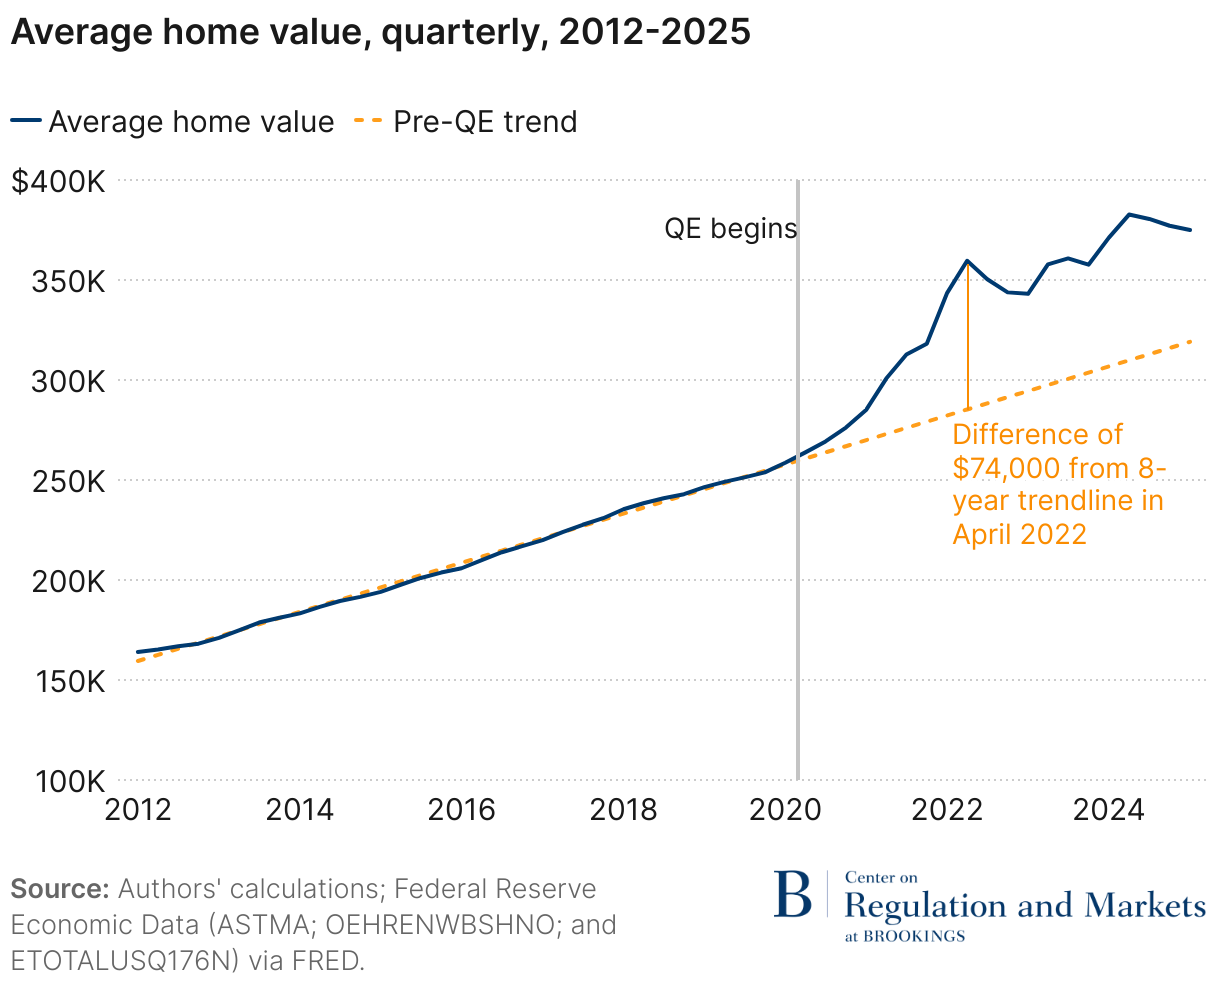
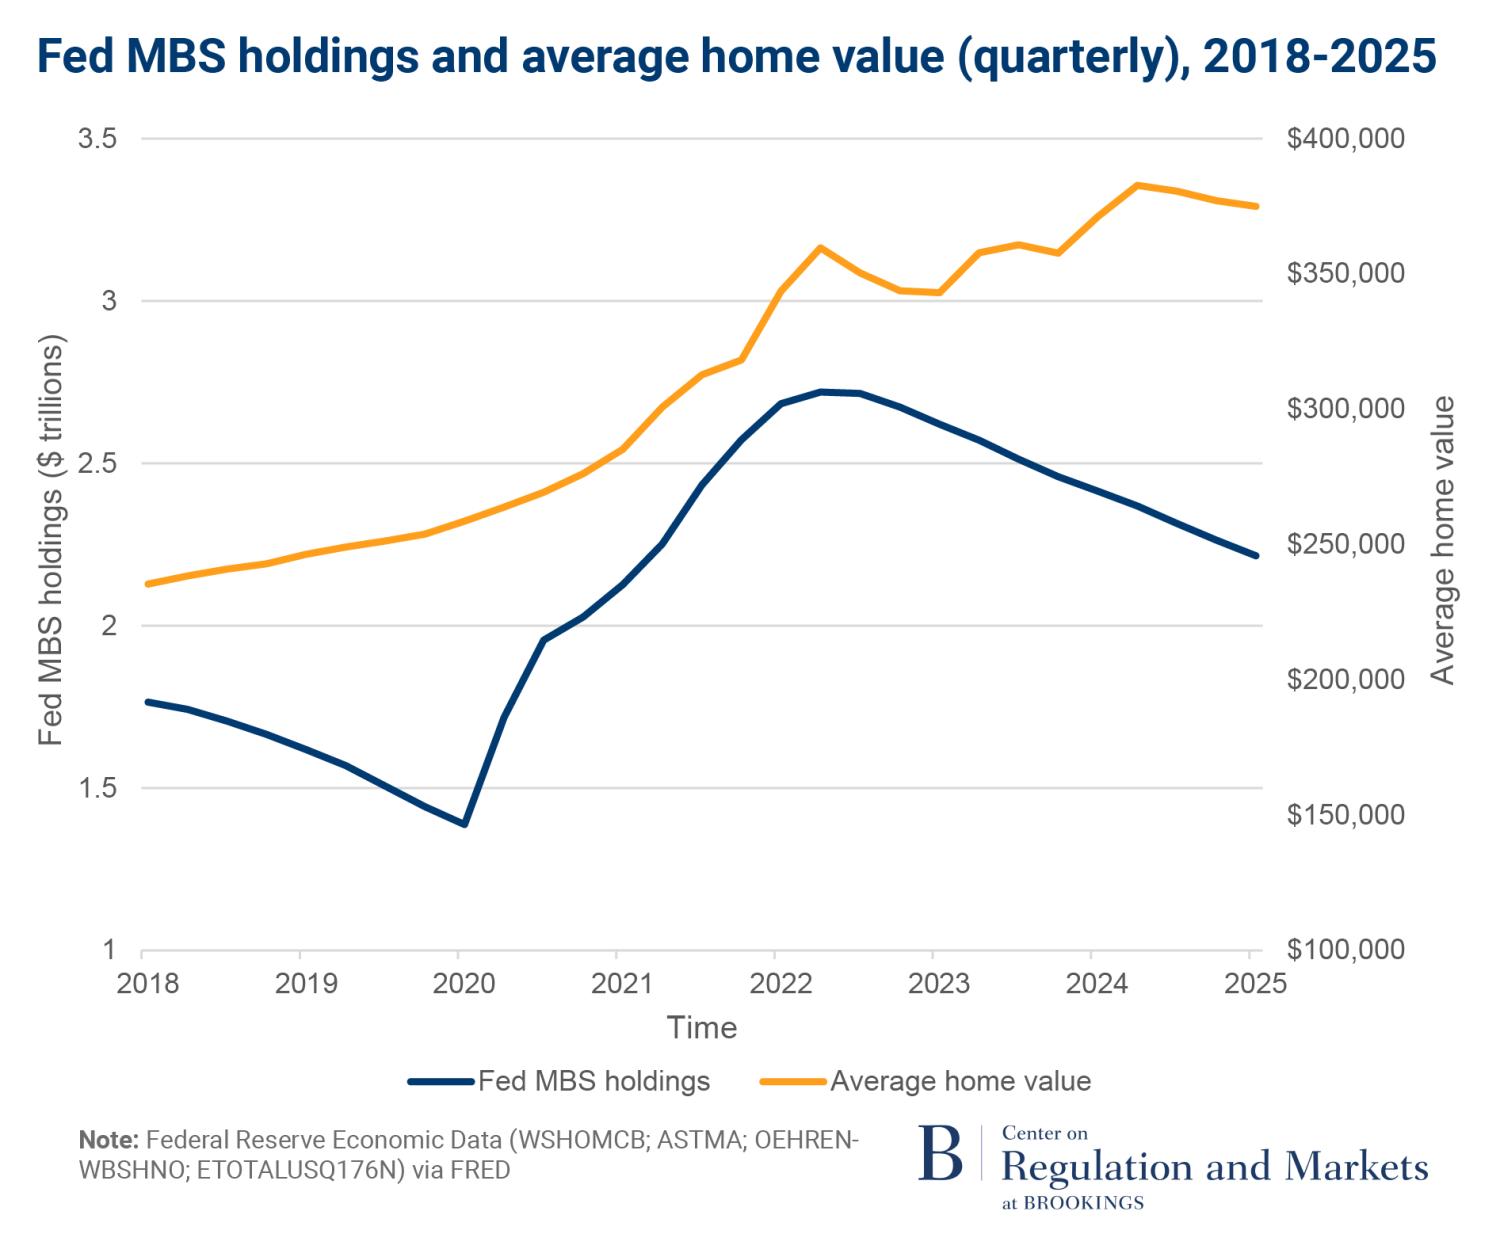
Housing values soared from 2020 to 2022: The average value of a house rose by nearly $100,000. This asset value explosion marks a sudden shift from pre-pandemic trends of slow and steady appreciation between 2012 and 2020. As Figure 6 shows, the average/median home in America rose by around $12,300 per year (nominally) during the period between the GFC and COVID-19—equal to 6% growth per year on average. From Q2 2020 to Q2 2022, the average/median home value grew by around $100,000 ($95,800 is the exact estimate), which translates to an asset value increase of nearly 17% per year on average. Less than one-quarter of that growth ($21,500) would be expected had housing followed its pre-pandemic growth pattern. About three-quarters of that growth ($74,300) is greater than the trendline of home price appreciation would have predicted. The increase in home values can be seen both in statistical imputations of home values and observed sales prices.
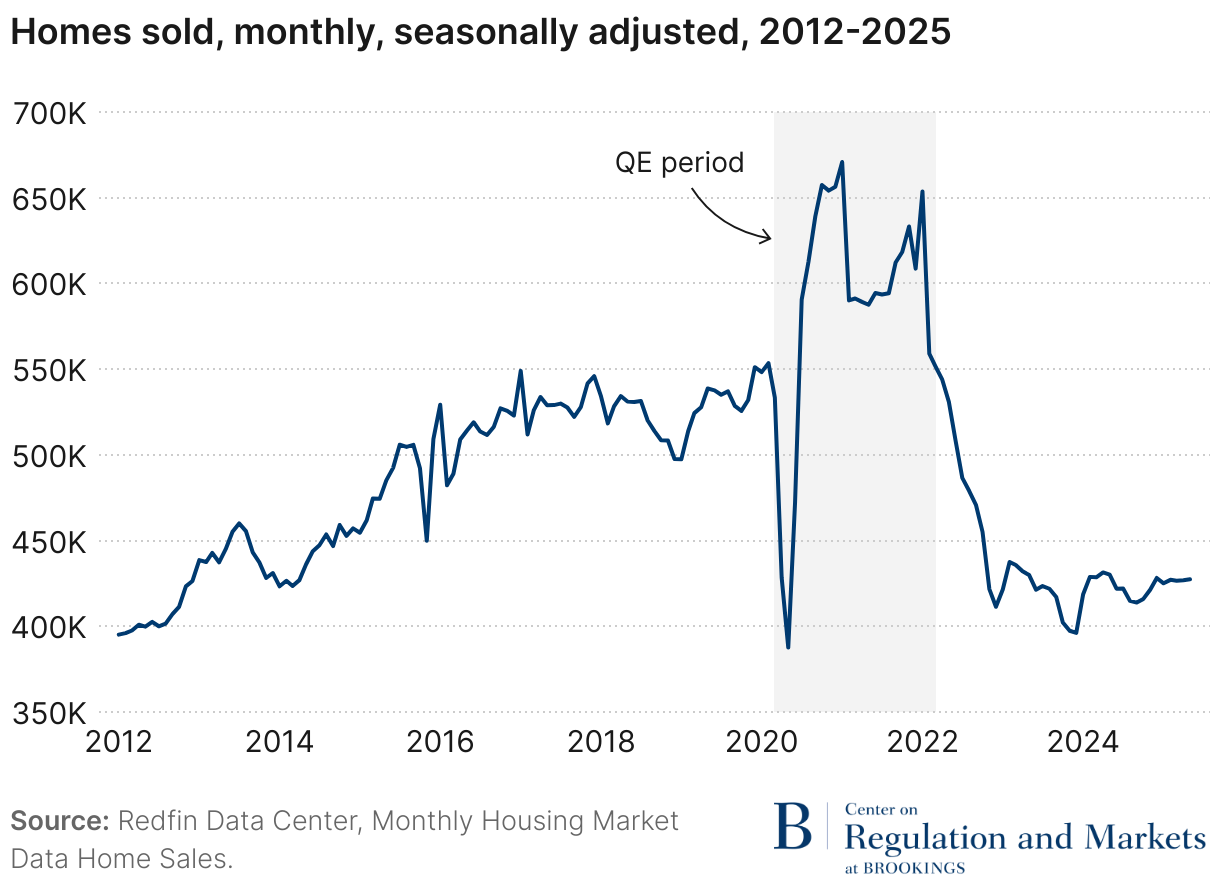
Home sales plunged during the pandemic, increased sharply during QE, then dropped to pandemic lows after QE, as shown by Figure 7. COVID-19 caused the housing market to freeze. Shutdowns and restrictions resulted in the inability for many house sales and purchases to occur. As Goodman and Klein observed just weeks after the initial wave of COVID shutdowns, “Coronavirus poses new, unforeseen threats” to mortgage origination.28 “For any mortgage to happen, including a refinance, multiple steps behind the scenes must take place, including: title searches, appraisals, … and county recordation offices.” If a single step is disrupted, “a mortgage cannot become official.” Workarounds were found and restrictions lifted, and the housing market returned. Home sale volumes then rebounded to historic highs as restrictions were lifted further and the Fed loosened monetary policy. After QE ended in March 2022, home sales declined to 100,000 sales per month lower than the pre-pandemic average.
A massive wave of refinancing occurred during the QE period. More than three-quarters of all GSE mortgages originated in 2021 were refinances.29 According to the New York Fed, “Approximately one-third of outstanding mortgage balances was refinanced during the seven quarters of the refi boom, and an additional 17% of mortgages outstanding were refreshed through home sales during a time of high demand for housing.”30 Many homeowners extracted their home equity as cash through cash-out refinances. The New York Fed estimated that a total of $430 billion was cashed out.31
QE and the housing market
The sharp appreciation in home values occurred during the period of the Fed’s QE. Overlaying the Fed’s balance sheet and home values, the correlation is clear, as shown in Figure 8. Going into COVID, the Fed had been slowly shrinking the MBS it acquired during the previous round of QE after the GFC. The Fed lowered its holdings to around $1.4 trillion of MBS when the COVID recession hit. The Fed announced QE on March 15, 2020, committing to “increase its holdings of Treasury securities by at least $500 billion and its holdings of agency mortgage-backed securities by at least $200 billion.”32 The final amount of purchases far exceeded the initial numbers. As discussed in section two, the Fed purchased $1.3 trillion of agency MBS from March 2020 to March 2022. Their total ownership at peak was $2.7 trillion, 32% of the entire $8.5 trillion MBS market. During this period, total agency MBS increased by $1.50 trillion, of which the Fed’s MBS purchases were equal to nearly 90% of the increase in MBS during the QE period.
Correlation is not causation. Causation is difficult to prove with multiple factors at play—some of which will be discussed in section four. However, none of these other factors make it possible to rule out the Fed’s purchase of MBS contributing to higher house prices. Indeed, economic logic and recent housing experience strongly suggest that there should be a causal relation between Fed MBS purchases and house prices. When the demand for mortgages increases, pressure to supply more mortgages increases. This was evident during the lead-up to the GFC when demand for MBS played a role in the creation of more mortgages, in part through lower underwriting standards.33 This time, a reduction in underwriting standards did not occur limiting the increase in mortgage supply. Yet, agency MBS market still expanded by $1.5 trillion, a 21% increase in two years. The expansion was driven by the wave of refinancing and appreciation in home prices.34 Exceptionally lower mortgage rates was the goal of the Fed’s QE, and that was achieved. However, as shown by the tightened spreads between conforming loans and other assets in section two, the impact of lower interest rates was felt more strongly in the housing market, a logical ramification of the constriction of the Fed’s QE to buying MBS. This induced higher demand for MBS, boosting home values to historic levels.
The correlation between the Fed’s QE MBS purchases and overheating housing market was observed by some economists in real time. In her speech at the Fed’s Jackson Hole conference in August 2021, former Council of Economic Advisors (CEA) member Kristin Forbes noted the unusual strength in the housing market, stating: “The housing sector does not appear to need any additional stimulus from monetary policy,” going on to argue for “withdraw[ing] monetary stimulus using tools that have larger relative effects on the medium- and longer-term yields to which mortgages are linked (i.e., unwinding asset purchases), or unwinding those assets that have a relatively larger effect on mortgage costs (i.e., unwinding holdings of MBS).”35 Forbes’s speech directly linked QE with price appreciation in housing, stating: “Sectors that are stimulated relatively more by asset purchases (such as the housing market) have experienced a strong recovery.”36 Chairman Powell even acknowledged that low rates (caused in part by QE) had an impact on house prices at a congressional hearing in July 2021, though he also pointed to other contributing factors to be discussed further in section four.37
House price appreciation and aggregate demand
This level of home price appreciation also raises aggregate demand and inflation through the wealth channel. By raising home prices, QE bolstered homeowners’ equity which increases aggregate demand and thus can cause inflation, particularly during a period in which aggregate supply constraints were present. Given the surge in home values, this impact is worth noting. The gain in household equity during QE was around $12 trillion.38 The marginal propensity to consume (MPC) from housing wealth is estimated to be from 4 to 7 cents per dollar of home value appreciation.39 Therefore, the U.S. economy received between $480 and $840 billion of additional stimulus through the housing wealth channel. Further evidence for the impact of housing wealth comes from the wave of cash-out refinances processed by Fannie and Freddie during this period; cashing-out is “an important channel” for increasing consumption.40 The lower estimate of the housing wealth effect of $480 billion aligns with the estimated $430 billion of home equity extracted.41
Had home price appreciation been consistent with historical trend, approximately 75% of this stimulus would have disappeared, about $360 billion using the low estimate and $630 billion with the high estimate. The additional stimulus from housing is comparable to the total amount sent to families under the 2021 post-election round of stimulus checks ($410 billion),42 which has received considerable attention for its potential inflationary impact.43
Housing downward price rigidity
As the economy recovered from the COVID-19 induced recession, the Fed began decreasing their holdings of MBS and raising interest rates. The Fed started tapering their MBS purchases in March 2022 and held their MBS holdings steady until June 2022. Due to the natural roll-off of MBS (from maturity, sale, or other reasons), the Fed continued to purchase a decreased amount of MBS during the tapering period to replace the natural roll-off of their portfolio. The Fed had $2.7 trillion of MBS in early 2022 and their holdings have decreased by $0.3 trillion to $2.4 trillion in Q1 2024. The Fed raised interest rates by 25 basis points on March 17, 2022, and subsequently engaged in a series of rapid rate hikes, raising rates a total of 500 basis points over 17 months.44 This was among the fastest and largest rate hikes over the prior 40 years.
After the Fed stopped MBS purchases and raised interest rates sharply, the housing market shifted. Home sales plummeted and house prices plateaued. This begs the question: If QE purchases of mortgages drove home price appreciation, would its end result in home prices falling? There are several reasons to believe that house prices act like a ratchet in the short run, including the interest rate lock-in effect, home equity constraints, and nominal loss aversion. These effects constrain homeowners’ mobility, creating downward price rigidity in the housing market.
Interest rate lock-in effect
Existing homeowners who refinanced during the pandemic were able to capture generationally low interest rates. The Fed’s subsequent sharp rise in interest rates means that an existing homeowner needing a new mortgage will likely receive a substantially higher interest rate. This creates an interest rate lock-in effect where existing homeowners are less likely to move as they would lose their lower interest rate mortgage in the process. It is possible that sharp house price appreciation during QE intensified the interest rate lock-in effect after QE since mortgage payments increase more for higher priced homes. For example, an increase in mortgage rates from 3 to 6% increases the mortgage payment on a $200,000 house by $356 per month and increases the payment on a $300,000 house by $534 per month.45
The constraint on mobility created by the interest rate lock-in effect impacts house price in both directions. On one hand, higher mortgage rates freeze the housing market and decrease the supply of homes for sale, applying upward pressure. On the other hand, higher mortgage rates reduce housing demand as households’ budgets are constrained to afford smaller mortgages and “locked” households do not enter the market, applying downward pressure. The net effect on price depends on whether lock-in blocks more downsizing than upsizing. The Federal Housing Finance Agency studied this exact issue and concluded that from 2022 Q2 to 2024 Q2, interest rate lock-in led to a 1.7 million decrease in home sales which increased prices by 7.0%, outweighing what the paper estimated as the 5.6% decrease in home prices from high interest rates. The net effect of interest rate lock-in was a 1.4% price increase.46
There are important distributional impacts from lock-in, as it impacts existing homeowners differently than new/prospective homebuyers. As a result, individuals with higher home values and incomes are more responsive to interest rate lock-in. Changes between the existing rate and new rate cause the largest change in the probability of sale among the wealthiest homeowners. Those with less wealth “are less able to strategically time their sales” and lock-in worsens inequality.47
Home equity and nominal loss aversion
Next, we turn to how low or negative home equity constrains homeowner mobility.48 This has been modeled by assuming existing homeowners rely on their home equity to fund their downpayment for another house, assuming they do not have an extra source of wealth and prefer to continue owning. Thus, prospective sellers need to sell at a price where their profits from the sale (equity in the home) covers the downpayment on their next house.49 The seller cannot move if their existing house is sold below a certain price. They respond by leaving their house on the market and “fishing” for a higher price.50 An alternative is also to simply not list the house if they do not think they can realize the gains necessary to fund their next house.
Nominal loss aversion refers to how sellers “treat gains and losses differently, and are reluctant to realize nominal losses.”51 The hypothesis was explored by Genesove and Mayer in Boston and New York, and then generalized to metro areas across the country by Engelhardt, who found “a 5% nominal loss is associated with a 30–44% reduction in the probability of a move.”52
These constraints are a function of current home equity, not net gain on the asset, as homeowners who extracted equity through a cash-out refinance are impacted. They cannot sell at a lower price and so leave their homes on the market or avoid selling altogether, aligning with the current state of the plateaued housing market.
More analysis on the home equity valuations would help better understand the consequences of these effects over the COVID time period. Home equity can be a double-edged sword as it is possible that the value of one’s home appreciates slower than the price of the new home one desires. This impact would be larger if there were sharper price appreciation differences between starter homes and trade-up homes among younger families.
Summary
From 2020 to 2022, the Fed bought nearly 90% of the new mortgages created and sold through GSE MBS. During that time period, house values soared, home sales increased sharply, and there was a large wave of refinancing. The correlation between the Fed’s MBS purchases and house price appreciation is clear. A causal link is difficult to prove with many factors involved, though the tightening of spreads between mortgages and other assets, insights from the GFC, and expansion of the agency MBS market support the connection between the Fed’s purchases of MBS and house price appreciation. Economic logic also suggests that a QE strategy confined to mortgages, which results in the central bank being the dominant buyer of mortgage MBS, will have a disproportionate impact on home prices. Increased home values have an impact on aggregate demand and inflation through the wealth channel. Estimates suggest this provided at least $400 billion of additional stimulus to the economy. However, it also increased inflation as observed in housing inflation, documented in section one. Following the end of QE in 2022, the Fed raised interest rates sharply, house values plateaued, and home sales dropped to pandemic lows. In this period, interest rate lock-in, home equity, and loss aversion effects constrained homeowners’ mobility leading to downward price rigidity and the frozen state of the housing market.
IV. Alternative explanations for house price appreciation
At a hearing in July 2021, Chairman Powell was asked by members of Congress about increased house prices. While Powell acknowledged low rates are part of the reason for house price appreciation, he emphasized the impact of changes in geographic valuation and material shortages for housing construction.53 These factors are known to have an impact on house price. However, evidence suggests changes in geographic valuation and reduced housing construction cannot explain the observed overall house price appreciation.
Changes in geographic valuation
For the geographic valuation alternative explanation to be sound, three conditions must hold: geography needs to have an impact on house price, geographic valuation must have changed during the pandemic, and it must explain an overall increase in house price matching the observed appreciation from 2020 to 2022. While the first two conditions are supported by evidence, the third is not.
Location almost always impacts home valuation: The real estate adage “location, location, location” exists for a reason. The value of a house’s location is based on numerous factors. Data indicate that a house’s proximity to a central business district—often used as a proxy for the time it takes to reach work—played a large role in determining its value. Other geographic benefits include access to public transit to speed commutes and other travel, as well as proximity to retail and entertainment destinations.54 A 2019 Freddie Mac study in Washington, D.C. found “that the closer the house is to the [Metro] station, the higher the price.”55
COVID changed how we work and live with particular impacts on what aspects of a physical location households value. In 2022, the American Opportunity Survey found many job holders have the option to work from home full-time and a majority can work remotely at least part-time.56 The growth of remote work is concentrated in upper income/white collar work, which, given the correlation in wealth and income to homeownership, means that its impact should be exacerbated among homeowners as compared to renters. COVID also enhanced the use of online shopping and recreation.57 This impacts the value of proximity to retail and entertainment districts, another amenity considered in the desirability of location of housing.
The long-term magnitude of these changes were uncertain during the pandemic and afterwards. The ability to work remotely should, in theory, change the value of location among the existing housing stock. It would decrease the value of previously desirable housing located near convenient access points. It may increase the value of more remote locations, including what were once second homes. Over a longer time horizon, the supply of housing should adjust accordingly, absent zoning constraints which are significant in many places. Still, we are not in the long-term yet, given the time lag to build. Thus, the short-term effects should dominate, resulting in a net negative pressure on the existing housing stock whose valuation included time to travel to work and a positive pressure on housing whose valuation would be higher under remote work.
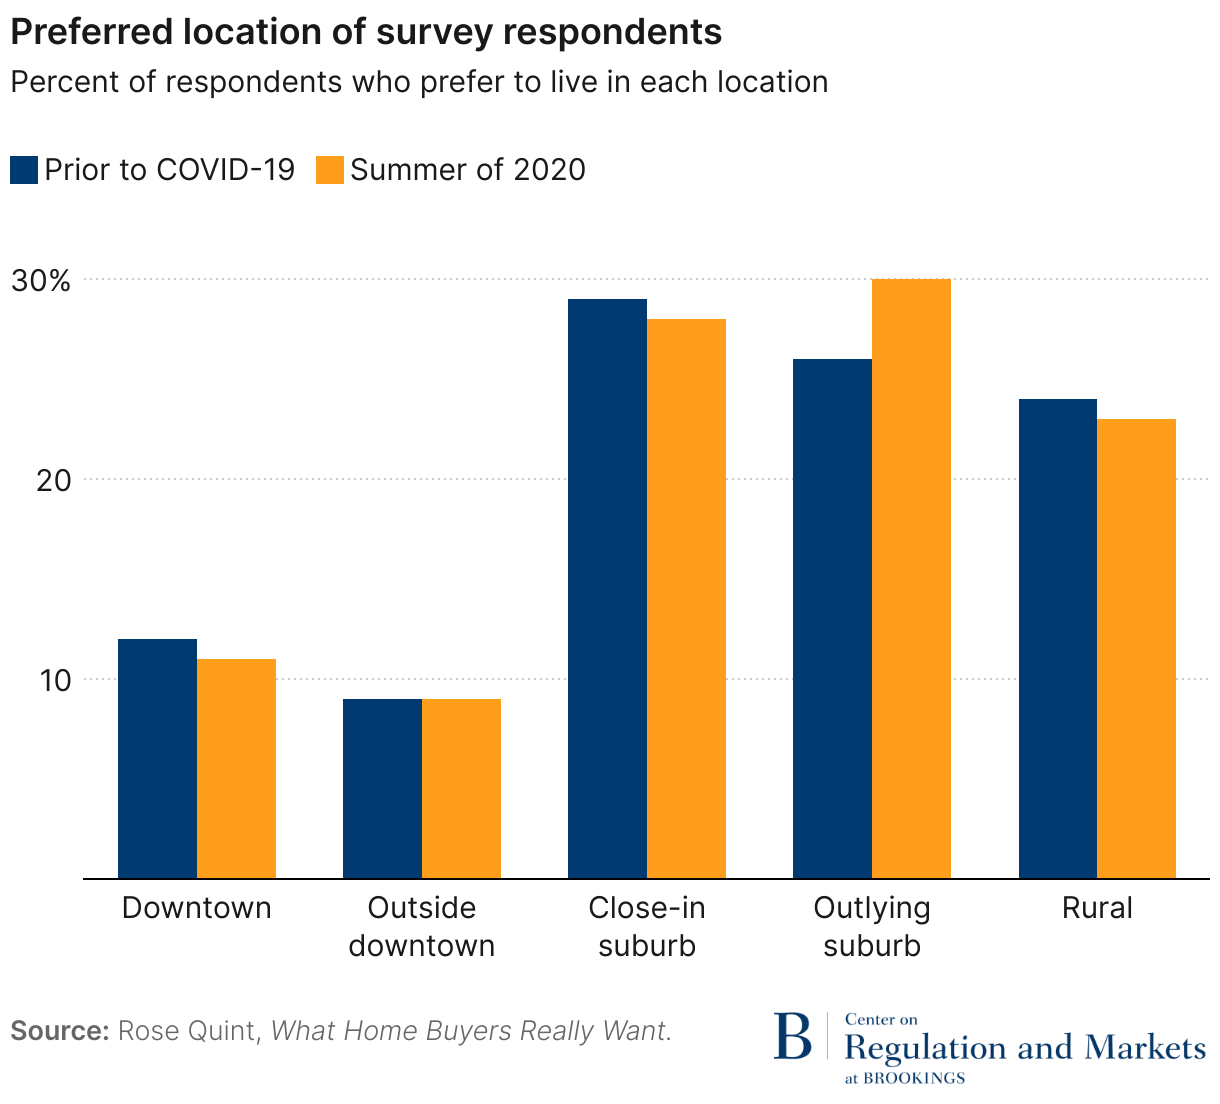
America has generally had much larger houses than other nations. The United States has the second highest rooms per person in the OECD at 2.4 rooms.58 The increase in remote work and the share of time spent at home, coupled with a non-zero potential for future shutdowns, may increase the demand for home size. The National Association of Home Builders found COVID-19 had changed housing preferences. Twenty-one percent of respondents prefer a larger home while 12% prefer a smaller home.59 Preference for outlying suburbs increased by 4 percentage points, while other locations declined in popularity. Overall, the data shows a slight change in geographic valuation during COVID (Figure 9).
Changes in geographic valuation would be reflected in the market price when individuals move. If homes in one area became more expensive because individuals moved there, homes in the area individuals moved away from would decrease in price. For example, the individuals moving away from downtowns to outlying suburbs would increase prices in the suburbs and depress prices downtown. The net effect of changes in geographic valuation would be a shift between areas, not an overall increase in price as the data shows. A model which considers the distribution of households among a “superstar” city and a smaller city shows that migration away from superstar cities is likely to improve housing affordability.60 Altogether, while changes to geographic valuation occurred after the pandemic, its connection to broad house price appreciation is not supported by the data.
Reduced housing construction
In order for reduced housing construction to be a sound explanation for the home price appreciation during the pandemic, construction must impact the housing market in the short run. Housing construction also needs to have been lower in 2020-2022 than prior levels for a prolonged period of time, but this is not supported by the data.
Housing construction impacts the supply of housing, and there is clear evidence showing its impact on price in the long run. The impact of home construction on house prices is delayed, given the average time to build a single-family house from start to sale is 8.6 months and for 20+ unit buildings it is 18.9 months as of 2023.61 As a result, one would expect a more muted reaction to this impact on home prices in the short run unless one assumes a very forward-looking market.
At the onset of the pandemic, the recession impacted housing construction through multiple channels. Physical shutdowns reduced the ability to build. The timing of COVID in March 2020 increased this impact given the weather-related seasonality of construction. New housing starts dropped to the same level as 2014 as shown by Figure 10. However, the trough of housing construction was brief and rebounded after QE began. Housing starts reached historic highs in 2021 and 2022. Only after QE ended in mid-2022 did housing starts begin to decrease, remaining at a lower level from 2023 to 2025.
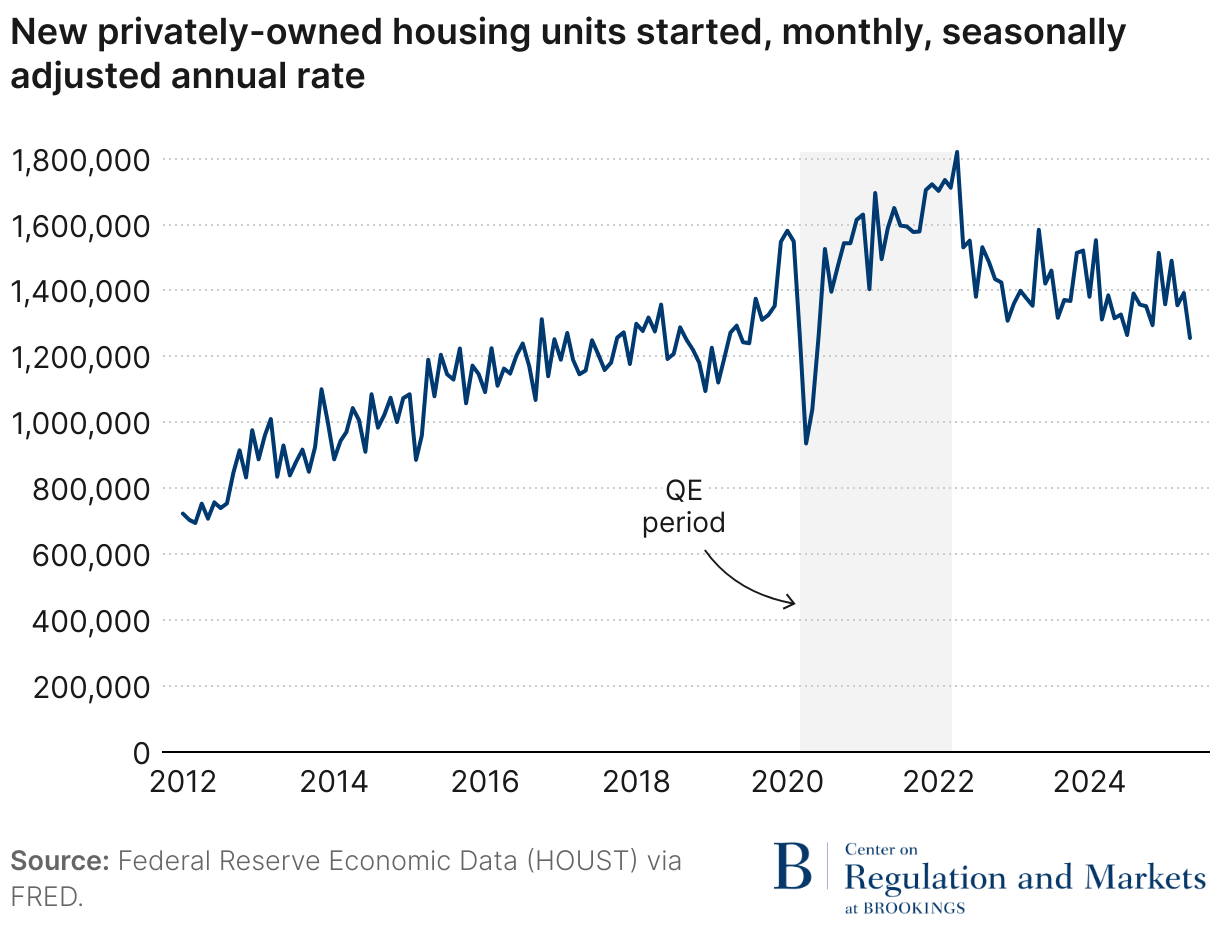
The data does not support reduced housing construction as an explanation for house price appreciation. The impact of housing construction on prices appears mostly in the long run. Housing construction was strongest during the QE period when house prices rose drastically and only decreased after 2022 when house prices plateaued. Thus, it is not a strong explanation for the house price appreciation.
A reason for the observed pattern in housing construction could be that home construction is interest-rate sensitive, with time lags between capital needs to build new housing and the time at which housing can be sold. As most new homes are purchased using financing, this is a market where both builder and buyer are dependent on financing, adding to interest rate sensitivity. Rate cuts will speed up construction and rate tightening without a clear time horizon for rate cuts will slow home construction.
After analyzing two alternative explanations for house price appreciation mentioned by Chairman Powell, QE’s impact on home price remains the strongest channel of causation to explain the sudden appreciation from 2020 to 2022.
V. Conclusion
The cause of America’s sharp increase in the cost of housing is central to understanding this episode of inflation. The Federal Reserve’s monetary policy response to COVID has received significant scrutiny for its role in causing inflation. Other factors include fiscal stimulus and supply shocks resulting from the pandemic and subsequent global events. Decomposing the contributory effects of various factors will take years and be the subject of many debates. This paper argues that one factor that has been underappreciated in causing housing inflation is the Fed’s large-scale purchases of MBS. The Fed purchased nearly 90% of the growth of GSE MBS during the two-year period of QE. The purchases depressed mortgage rates, leading to increased housing demand and house price appreciation. During this period, American home values rose sharply, with the average home value rising nearly $100,000, of which nearly 75% was above the pre-pandemic trend. MBS purchases through QE highly correlate with this period of above trend house price appreciation. Following the end of QE and subsequent interest rate hikes, house prices plateaued.
The theory behind QE largely ignored the asset-specific price effects from asset purchases, possibly because economists assumed investors would rebalance and spread out yield impacts evenly to other assets. However, actual implementation of QE by the Federal Reserve during the COVID pandemic resulted in a near total purchase of the available market of MBS by the Fed. It is difficult to set aside the basic laws of supply and demand and not suppose that an over $1 trillion purchase of a financial product, nearly 90% of the growth in the available supply, did not cause the sharply higher asset valuations observed, especially when the underlying housing stock is constrained in the short-term.
If correct, the Federal Reserve needs to reconsider how it operates QE, taking into account the impact of purchasing MBS on the housing market and the feedback loop between housing and inflation. Housing is the largest component of inflation, itself meriting special attention. In less than the first quarter of this century, QE had gone from a theoretical debate to a “break the glass” implementation response to the last two recessions. Given the frequency of QE and the unique nature of the first recession’s epicenter on housing and the second’s inflation episode, it is critical that more work be done to understand the ramifications of large-scale mortgage asset purchases by the Federal Reserve.
Related Content

Authors


-
Footnotes
- This paper uses the specific measure of CPI-U as the benchmark for CPI
- Ben Bernanke and Olivier Blanchard, “What Caused the U.S. Pandemic-Era Inflation?” (working paper, Hutchins Center Working Paper, The Brookings Institution, Washington D.C., 2023), 25, https://www.brookings.edu/wp-content/uploads/2023/06/WP86-Bernanke-Blanchard_6.13.pdf; Christoffer Koch and Diaa Noureldin, “How We Missed the Inflation Surge: An Anatomy of Post-2020 Inflation Forecast Errors” (Working Paper No. 2023/102. International Monetary Fund, 2023), https://www.imf.org/en/Publications/WP/Issues/2023/05/12/How-We-Missed-the-Inflation-Surge-An-Anatomy-of-Post-2020-Inflation-Forecast-Errors-533321; Dario Caldara et al., The Effect of the War in Ukraine on Global Activity and Inflation, FEDS Notes (Washington, D.C.: Board of Governors of the Federal Reserve System, 2022), https://www.federalreserve.gov/econres/notes/feds-notes/the-effect-of-the-war-in-ukraine-on-global-activity-and-inflation-20220527.html.
- Aaron Klein, “How Mechanisms of Quantitative Easing Impact Capital Flow, Inflation, and Perception of the Economy,” October 2024; Jerome H. Powell, “Review and Outlook” (speech, “Reassessing the Effectiveness and Transmission of Monetary Policy,” an economic symposium sponsored by the Federal Reserve Bank of Kansas City, Jackson Hole, August 23, 2024), https://www.federalreserve.gov/newsevents/speech/files/powell20240823a.pdf.
- U.S. Bureau of Labor Statistics, “Table 1 (2022 Weights). Relative Importance of Components in the Consumer Price Indexes: U.S. City Average, December 2023,” February 9, 2024, https://www.bls.gov/cpi/tables/relative-importance/2023.htm; Among the multiple versions of CPI, this paper uses CPI-U.
- Housing is a smaller element of PCE, the Fed’s preferred measure of inflation, coming in at 15.6% in Q4 2024. This is a function of how the two inflation indexes are weighted, although under both metrics, housing is still a significant contributor. Perhaps this difference helps explain why the Fed was less focused on housing as a driver of inflation. Regardless of which index is more accurate in the overall economy, housing is a required consumption item for people where substitution is far more difficult and sticky than other goods whose consumption is easier to adjust; U.S. Bureau of Economic Analysis, “Table 2.4.5U. Personal Consumption Expenditures by Type of Product,” accessed August 12, 2025, https://apps.bea.gov/iTable/?reqid=19&step=3&isuri=1&nipa_table_list=2017&categories=underlying.
- Rent is a larger component for CPI-W, the measure of inflation for urban wage earners reflecting the greater proportion of renters among urban workers. Within CPI-W rent is over 10% of total CPI.
- Drew DeSilver, “As National Eviction Ban Expires, a Look at Who Rents and Who Owns in the U.S.,” Pew Research Center (blog), August 2, 2021, https://www.pewresearch.org/short-reads/2021/08/02/as-national-eviction-ban-expires-a-look-at-who-rents-and-who-owns-in-the-u-s/.
- Augustus Kmetz, Schuyler Louie, and John Mondragon, “Where Is Shelter Inflation Headed?,” FRBSF Economic Letter, August 7, 2023, https://www.frbsf.org/research-and-insights/publications/economic-letter/2023/08/where-is-shelter-inflation-headed.
- Augustus Kmetz, Schuyler Louie, and John Mondragon, “Where Is Shelter Inflation Headed?,” August 7, 2023.
- Taylor Tepper, “Federal Funds Rate History 1990 to 2025,” Forbes Advisor, May 8, 2025, https://www.forbes.com/advisor/investing/fed-funds-rate-history/.
- The Financial Crisis Inquiry Report: Final Report of the National Commission on the Causes of the Financial and Economic Crisis in the United States (Washington, D.C.: Featured Commission Publications, 2011), https://www.govinfo.gov/app/details/GPO-FCIC.
- “The Origins of Unconventional Monetary Policy in the U.S.,” in Annual Report 2015 (Federal Reserve Bank of St. Louis, 2015), https://www.stlouisfed.org/annual-report/2015/the-origins-of-unconventional-monetary-policy-in-the-us.
- The Federal Reserve can also purchase other assets under exigent circumstances as allowed under Section 13(3) of the Federal Reserve Act. The Fed engaged in this during both the GFC and the Covid response. The assets purchased under 13(3) facilities were generally not mortgages or housing and are not subject to this analysis.
- Ben Bernanke, “Monetary Policy since the Onset of the Crisis” (speech, Federal Reserve Bank of Kansas City Economic Symposium, Jackson Hole, August 31, 2012), https://www.federalreserve.gov/newsevents/speech/bernanke20120831a.htm.
- Tim Sablik, “The Fed Is Shrinking Its Balance Sheet. What Does That Mean?,” in Econ Focus Third Quarter 2022 (Federal Reserve Bank of Richmond, 2022), https://www.richmondfed.org/publications/research/econ_focus/2022/q3_federal_reserve.
- Laurie Goodman et al., Housing Finance at a Glance: A Monthly Chartbook (Washington D.C.: Housing Finance Policy Center, Urban Institute, April 2020), https://www.urban.org/sites/default/files/publication/102088/april-chartbook-2020_0.pdf; Laurie Goodman et al., Housing Finance at a Glance: A Monthly Chartbook (Washington D.C.: Housing Finance Policy Center, Urban Institute, April 2022), https://www.urban.org/sites/default/files/2022-04/Housing%20Finance%20At%20A%20Glance%20Monthly%20Chartbook,%20April%202022.pdf.
- Lily Katz, “The Typical Homebuyer’s Down Payment Is $56,000, Up 24% From a Year Ago,” Redfin Real Estate News, March 29, 2024, https://www.redfin.com/news/?p=77708.
- Laurie Goodman et al., Housing Finance at a Glance: A Monthly Chartbook (June 2024).
- “Highlights From the Profile of Home Buyers and Sellers,” National Association of Realtors, 2023, https://www.nar.realtor/research-and-statistics/research-reports/highlights-from-the-profile-of-home-buyers-and-sellers.
- American Community Survey (S2504 | Physical Housing Characteristics for Occupied Housing Units, ACS 1-Year Estimates Subject Tables, 2022), https://data.census.gov/table/ACSST1Y2022.S2504?q=Owner/Renter%20(Householder)%20Characteristics.
- Itamar Drechsler et al., “Monetary Policy and the Mortgage Market” (working paper, Federal Reserve Bank of Kansas City, July 2024): 4, https://www.kansascityfed.org/Jackson%20Hole/documents/10336/schnabl_jh.pdf.
- Nina Boyarchenko, Andreas Fuster, and David O. Lucca, “Understanding Mortgage Spreads,” (staff report, Federal Reserve Bank of New York, 2014), https://www.newyorkfed.org/medialibrary/media/research/staff_reports/sr674.pdf.
- Joseph Gagnon et al., “Large-Scale Asset Purchases by the Federal Reserve: Did They Work?,” FRBNY Economic Policy Review (May 2011): 43, https://www.newyorkfed.org/medialibrary/media/research/epr/11v17n1/1105gagn.pdf.
- Laurie Goodman and Michael Neal, “How Higher Mortgage Rates Have Historically Affected Home Prices,” Urban Institute, Urban Wire (blog), May 2, 2022, https://www.urban.org/urban-wire/how-higher-mortgage-rates-have-historically-affected-home-prices.
- Laurie Goodman and Michael Neal, “How Higher Mortgage Rates Have Historically Affected Home Prices.”
- Itamar Drechsler et al., “Monetary Policy and the Mortgage Market.”
- Itamar Drechsler et al., “Monetary Policy and the Mortgage Market.”
- Laurie Goodman and Aaron Klein, “The impact of the coronavirus on mortgage refinancings” (report, The Brookings Institution, April 13, 2020), https://www.brookings.edu/articles/the-impact-of-the-coronavirus-on-mortgage-refinancings/.
- Laurie Goodman et al., Housing Finance at a Glance: A Monthly Chartbook (June 2024).
- Andrew Haughwout et al., “The Great Pandemic Mortgage Refinance Boom,” Liberty Street Economics (blog), May 15, 2023, https://libertystreeteconomics.newyorkfed.org/2023/05/the-great-pandemic-mortgage-refinance-boom/.
- Andrew Haughwout et al., “The Great Pandemic Mortgage Refinance Boom,” May 15, 2023.
- Board of Governors of the Federal Reserve System, “Federal Reserve issues FOMC statement,” news release, Board of Governors of the Federal Reserve System, March 15, 2020, https://www.federalreserve.gov/newsevents/pressreleases/monetary20200315a.htm.
- The Financial Crisis Inquiry Report: Final Report of the National Commission on the Causes of the Financial and Economic Crisis in the United States, xxii.
- Large Bank Credit Card and Mortgage Data (Federal Reserve Bank of Philadelphia, July 24, 2024), https://www.philadelphiafed.org/surveys-and-data/large-bank-credit-card-and-mortgage-data#data-explorer; Laurie Goodman et al., Housing Finance at a Glance: A Monthly Chartbook (April 2020); Laurie Goodman et al., Housing Finance at a Glance: A Monthly Chartbook (April 2022).
- Kristin J Forbes, “Panel on Monetary Policy in an Uneven Economy: Unwinding Monetary Stimulus in an Uneven Economy: Time for a New Playbook?” (Federal Reserve Bank of Kansas City, 2021), https://www.kansascityfed.org/Jackson%20Hole/documents/8760/Forbes_JH21.pdf.
- Kristin J Forbes, “Panel on Monetary Policy in an Uneven Economy: Unwinding Monetary Stimulus in an Uneven Economy: Time for a New Playbook?.”
- Monetary Policy and the State of the Economy, Before the Committee on Financial Services, 117th Congress (Washington, D.C., July 14, 2021) (Jerome H. Powell, Chairman of the Federal Reserve), https://www.govinfo.gov/content/pkg/CHRG-117hhrg45384/html/CHRG-117hhrg45384.htm.
- Federal Reserve Economic Data (Households; Owners’ Equity in Real Estate, Level (OEHRENWBSHNO)).
- Carlos Caceres, “Analyzing the Effects of Financial and Housing Wealth on Consumption using Micro Data” (working paper, International Monetary Fund, May 2019), https://www.imf.org/en/Publications/WP/Issues/2019/05/24/Analyzing-the-Effects-of-Financial-and-Housing-Wealth-on-Consumption-using-Micro-Data-46920; Raphael Bostic, Stuart Gabriel, and Gary Painter, “Housing Wealth, Financial Wealth, and Consumption: New Evidence from Micro Data,” Regional Science and Urban Economics 39, no. 1 (January 2009): 79–89, https://doi.org/10.1016/j.regsciurbeco.2008.06.002; Daniel Cooper, “House Price Fluctuations: The Role of Housing Wealth as Borrowing Collateral,” The Review of Economics and Statistics 95, no. 4 (October 1, 2013): 1183–97, https://doi.org/10.1162/REST_a_00323; Atif Mian, Kamalesh Rao, and Amir Sufi, “Household Balance Sheets, Consumption, and the Economic Slump*,” The Quarterly Journal of Economics 128, no. 4 (November 1, 2013): 1687–1726, https://doi.org/10.1093/qje/qjt020; Aditya Aladangady, “Housing Wealth and Consumption: Evidence from Geographically Linked Microdata,” American Economic Review 107, no. 11 (November 1, 2017): 3415–46, https://doi.org/10.1257/aer.20150491.
- Carlos Caceres, “Analyzing the Effects of Financial and Housing Wealth on Consumption using Micro Data” (2019), 12; Housing Finance at a Glance: A Monthly Chartbook (June 2024), 11.
- Andrew Haughwout et al., “The Great Pandemic Mortgage Refinance Boom,” May 15, 2023.
- Stimulus Checks: Direct Payments to Individuals during the COVID-19 Pandemic (GAO-22-106044, Government Accountability Office, 2022), https://www.gao.gov/products/gao-22-106044.
- Eric Boehm, “COVID Stimulus Spending Played ‘sizable Role’ in Inflation,” Reason.Com (blog), February 2, 2023, https://reason.com/2023/02/02/covid-stimulus-spending-played-sizable-role-in-inflation/.
- Taylor Tepper, “Federal Funds Rate History 1990 to 2025,” May 8, 2025.
- “Mortgage Calculator,” Bankrate, accessed September 4, 2024, https://www.bankrate.com/mortgages/mortgage-calculator/.
- Ross M. Batzer et al., “The Lock-In Effect of Rising Mortgage Rates” (working paper, FHFA Staff Working Paper Series, March 2024), 2, https://www.fhfa.gov/research/papers/wp2403.
- Ross M. Batzer et al., “The Lock-In Effect of Rising Mortgage Rates,” 29.
- J. C. Stein, “Prices and Trading Volume in the Housing Market: A Model with Down-Payment Effects,” The Quarterly Journal of Economics 110, no. 2 (May 1, 1995): 379–406, https://doi.org/10.2307/2118444.
- J. C. Stein, “Prices and Trading Volume in the Housing Market: A Model with Down-Payment Effects.”
- J. C. Stein, “Prices and Trading Volume in the Housing Market: A Model with Down-Payment Effects.”
- Gary V. Engelhardt, “Nominal Loss Aversion, Housing Equity Constraints, and Household Mobility: Evidence from the United States,” Journal of Urban Economics 53, no. 1 (January 2003): 174, https://doi.org/10.1016/S0094-1190(02)00511-9.
- Gary V. Engelhardt, “Nominal Loss Aversion, Housing Equity Constraints, and Household Mobility: Evidence from the United States,” January 2003, 188.
- Monetary Policy and the State of the Economy, Before the Committee on Financial Services, 117th Congress (Washington, D.C., July 14, 2021) (Jerome H. Powell, Chairman of the Federal Reserve), https://www.govinfo.gov/content/pkg/CHRG-117hhrg45384/html/CHRG-117hhrg45384.htm.
- John Matthews, “The Effect of Proximity to Commercial Uses on Residential Prices” (PhD diss., Georgia State University, 2006), https://doi.org/10.57709/1059068.
- Economic & Housing Research Group, Proximity to a Metro Rail Station and Its Impact on Washington, DC Metropolitan House Prices: Amenity or Not? (Freddie Mac, 2019), https://www.freddiemac.com/research/insight/20191002-metro-station-impact.
- André Dua et al., “Americans are embracing flexible work—and they want more of it,” McKinsey & Company, June 23, 2022, https://www.mckinsey.com/industries/real-estate/our-insights/americans-are-embracing-flexible-work-and-they-want-more-of-it.
- “Online vs In-Store Shopping Statistics (2024): Latest Sales Data,” Capital One Shopping, August 20, 2024, https://capitaloneshopping.com/research/online-vs-in-store-shopping-statistics/.
- OECD Data Explorer (Housing > Rooms per person; accessed August 6, 2024), https://data-explorer.oecd.org/vis?tenant=archive&df%5Bds%5D=DisseminateArchiveDMZ&df%5Bid%5D=DF_BLI&df%5Bag%5D=OECD&dq=.HO_NUMR..&to%5BTIME%5D=false&ly%5Brw%5D=LOCATION&vw=br.
- Rose Quint, What Home Buyers Really Want (Special Study for Housing Economics, National Association of Home Builders, March 2021), https://www.nahb.org/-/media/NAHB/news-and-economics/docs/housing-economics-plus/special-studies/2021/special-study-what-home-buyers-really-want-march-2021.pdf.
- Jeremy Kronick and Paul Beaudry, “Making Housing More Affordable in Canada: The Need for More Large Cities,” C.D. Howe Institute, January 21, 2025, https://cdhowe.org/publication/making-housing-more-affordable-in-canada-the-need-for-more-large-cities/.
- U.S. Census Bureau and U.S. Department of Housing and Urban Development. 2025. “Survey of Construction, Average Length of Time from Start to Completion – United States.” https://www.census.gov/construction/nrc/data/time.html.
The Brookings Institution is committed to quality, independence, and impact.
We are supported by a diverse array of funders. In line with our values and policies, each Brookings publication represents the sole views of its author(s).