Introduction
Extensive research has investigated the “exposure” of occupations to artificial intelligence (AI). While definitions vary, studies using exposure measures seek to estimate the extent to which AI systems can help complete the work tasks of different jobs. But these measures are not predictions of job displacement. Rather, they provide signals about where AI’s complex labor market effects are most likely to emerge first.
However, most exposure-focused analyses overlook a critical dimension: workers’ ability to adapt if job loss does occur.
Capacity to adapt after job loss is not evenly distributed across the workforce. Financial security, age, skills, union membership, and the state of local labor markets are just some of the many factors that can influence the real-life consequences of job loss. For that reason, forecasts of AI exposure, disruption, and potential work dislocation would benefit from incorporating such factors.
This is the purpose of new research explained here and in a new paper for the National Bureau of Economic Research (NBER) by research colleagues Sam Manning and Tomás Aguirre.
To address the heterogeneity of how AI-induced job loss may impact workers, the new analysis combines estimates of AI exposure with a novel measure of “adaptive capacity” that takes into account workers’ varied individual characteristics. Along these lines, the new work supplements occupation-level exposure analysis with relevant measures of workers’ savings, age, labor market density, and skill transferability in order to assess their varied capacity to weather job displacement and transition to new work. As such, the new approach provides a useful way of distinguishing between highly AI-exposed workers with relatively strong means to adjust to potential AI-driven job loss and those with more limited adaptive capacity.
As such, our analysis finds that overall, there is both broad resilience and concentrated pockets of potential vulnerability in the U.S. labor market when it comes to AI job displacement.
Of the 37.1 million U.S. workers in the top quartile of occupational AI exposure, 26.5 million also have above-median adaptive capacity, meaning they are among those best positioned to make a job transition if displacement occurs. However, the analysis also documents that some 6.1 million workers (4.2% of the workforce in the sample) will likely contend with both high AI exposure and low adaptive capacity. These workers tend to be concentrated in clerical and administrative roles, and about 86% are women (gender shares are calculated using Lightcast data). Geographically, these workers are concentrated in smaller metropolitan areas, particularly university towns and midsized markets in the Mountain West and Midwest.
In short, the new analysis asks: If AI does cause job displacement, who is best positioned to adapt, and who will struggle most? In asking those questions, this analysis intends to help policymakers focused on AI’s labor market impacts better target their attention and resources.
Background: Why AI exposure alone does not account for workers’ varied ability to adjust to a changing labor market
To identify which workers have the most and least capacity to weather AI-driven job displacement, the inquiry discussed here links analysis that forecasts AI’s labor market impacts with research examining how workers adjust to job displacement. As Manning and Aguirre write in their NBER report, “By bridging the two literatures, we move beyond identifying which jobs face potential AI exposure to understanding which workers might face the greatest or least adjustment costs if disruption leads to displacement.”
Research examining workers’ exposure to AI has frequently mapped descriptions of worker tasks to AI capabilities in order to estimate the potential for AI-driven disruption in different occupations. Studies by Brynjolfsson and others (2018); Webb (2020); Muro and others (2019); Felten and others (2023); Eloundou and others (2024); Kinder and others (2024); and Hampole and others (2025) all find that higher-income, white collar occupations requiring postsecondary education show the highest exposure to AI capabilities.
High exposure estimates for highly educated, high-income workers have led many to assume that these workers will bear the greatest burden of AI disruption. Yet such exposure measures fail to capture core non-technological factors that influence which workers would experience the most severe welfare costs if AI were to eventually be a cause of job displacement.
Along these lines, several factors are known to shape worker vulnerability to harms from job displacement (for more detail see the underlying NBER paper).
- Liquid financial resources: Workers with greater savings weather economic storms more effectively. Chetty (2008) shows individuals with greater liquid savings are less financially distressed after job loss and take longer to find better-matching jobs, while low-wealth individuals are forced into lower-quality employment.
- Age: Age significantly influences job displacement costs. Farber (2017) shows that workers aged 55 to 64 who experienced job loss during the Great Recession were about 16 percentage points less likely than those aged 35 to 44 to find employment afterward. Older workers are less likely to retrain, relocate, or switch occupations compared to their younger counterparts, and a range of studies has found that job loss for older workers leads to greater earnings losses and lower reemployment rates.
- Geographic density: Where a worker lives can affect their displacement experience and recovery prospects. Bleakley and Lin (2012) show that workers in more densely populated areas face lower costs to make work transitions compared to those in low-density areas.
- Skill transferability: Transferable skills—those that can be applied across many different jobs—offer more occupational mobility than highly specialized skills. Nawakitphaitoon and Ormiston (2016) show that skill transferability is associated with smaller earnings losses following displacement.
- Other factors such as income, the routine-task intensity of one’s job, and union representation may also influence outcomes, but are excluded from the core capacity analysis due to data limitations or ambiguity about their unique contributions to adaptive capacity.
In sum, linking exposure measures with these indicators of adaptive capacity provides a more complete picture of who is likely to experience the greatest costs if AI exposure translates into job loss. More specifically, such an approach can suggest, on one hand, how the AI disruptions that may befall higher-income, white collar workers may be partly mitigated by those workers’ savings, skills, and networks; while on the other hand, downside risks for less adaptive workers may be harder to manage.
Approach: Measuring adaptive capacity alongside AI exposure
Expanding prior research on AI exposure by complementing Eloundou and others’ occupational exposure estimates with various measures of workers’ adaptive capacity allows for a sharper picture of risk and resilience in the labor market. The aim is to identify which occupations are likely to be impacted by large language models (LLMs) as well as which workers are the most and least able to weather a job transition if one becomes necessary.
To develop this picture, the NBER report combine six primary datasets to create a composite measure of adaptive capacity by occupation. The Survey of Income and Program Participation (SIPP) provides data on workers’ net liquid wealth; the American Community Survey (ACS) offers age distributions; the Occupational Employment and Wage Statistics (OEWS) program contributes wage and employment figures; Lightcast provides employment shares by county and metro area; Bureau of Labor Statistics employment projections provide estimated employment growth rates by occupation; and O*NET details the range of skills required in each occupation. Together, these sources cover the vast majority of the U.S. workforce. (See the following Appendix and the underlying paper here.)
From this combined data, the NBER report calculates an occupation-level adaptive capacity index based on four standardized components (net liquid wealth, growth-weighted skill transferability, geographic density, and age), which capture financial, skill-based, geographic, and age-related adjustment capacity. This index is then presented alongside AI exposure measures from Eloundou and others to identify how adaptive capacity varies across highly exposed occupations.
Importantly, the adaptive capacity index focuses on factors influencing workers’ ability to find new jobs and their earnings after reemployment—not the full range of welfare costs that job displacement can impose, such as job insecurity or the loss of meaning and identity that work provides.
Findings: On average, highly AI-exposed workers appear well-equipped to handle job transitions relative to the rest of the workforce, yet 6.1 million workers still face both high exposure and low adaptive capacity
Combining AI exposure measures with the new adaptive capacity index paints a new picture of AI’s potential impacts on the workforce.
To begin, the analysis here shows that the workers with the highest AI exposure rates possess characteristics that give them higher capacity to navigate job transitions successfully—finding new employment quickly and minimizing earnings losses after job displacement. That is, the most exposed workers may have the most resilience if AI automation or another cause leads to job loss.
Figure 1 shows a large group of 26.5 million workers concentrated to the upper right of the bubble chart. Across this cluster of occupations, many high-exposure occupations such as software developers, financial managers, lawyers, and other professionals benefit from strong pay, financial buffers, diverse skills, and deep professional networks. Given that, these well-positioned workers—who observers often cite as being highly threatened by AI automation—likely possess relatively strong means to adjust to AI-driven dislocation if it were to occur (though of course few such transitions are easy, or come without costs to a worker’s well-being).
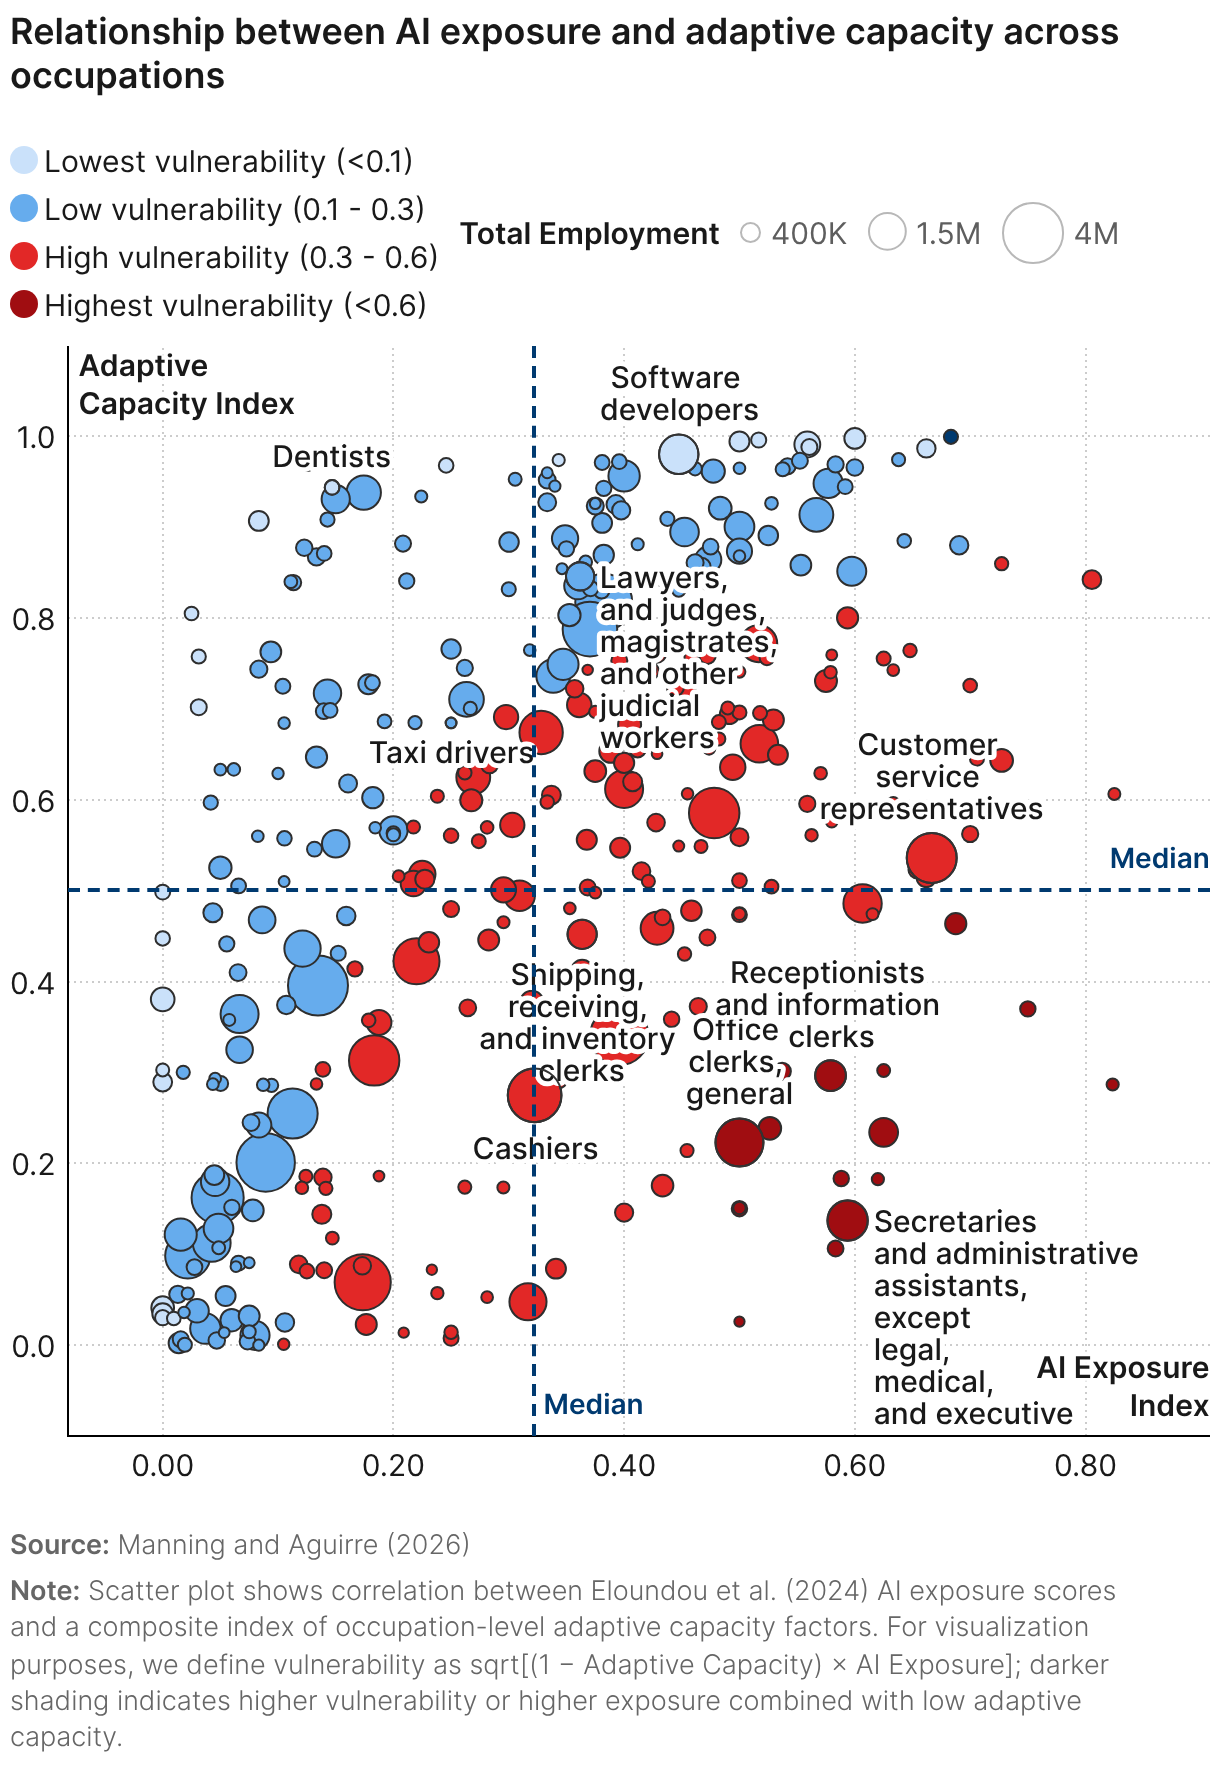
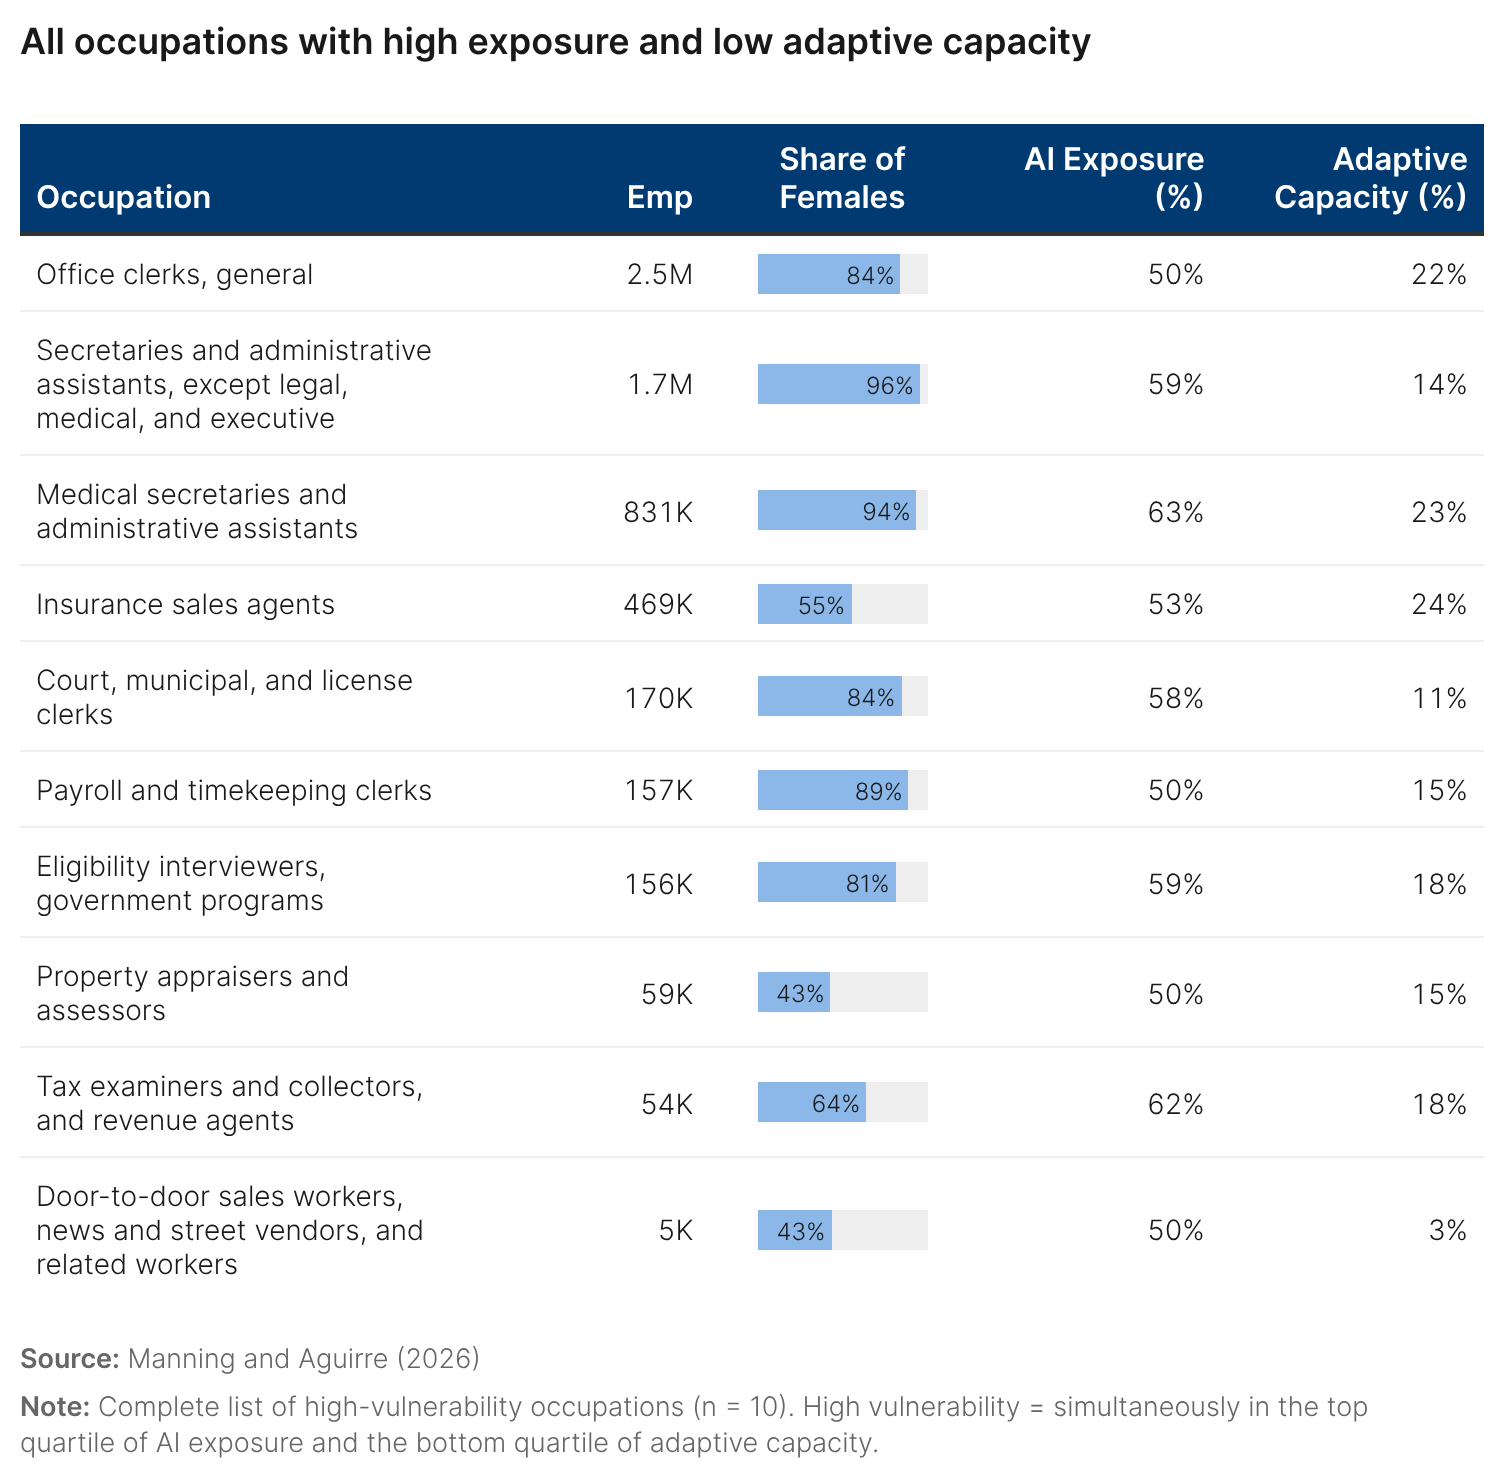
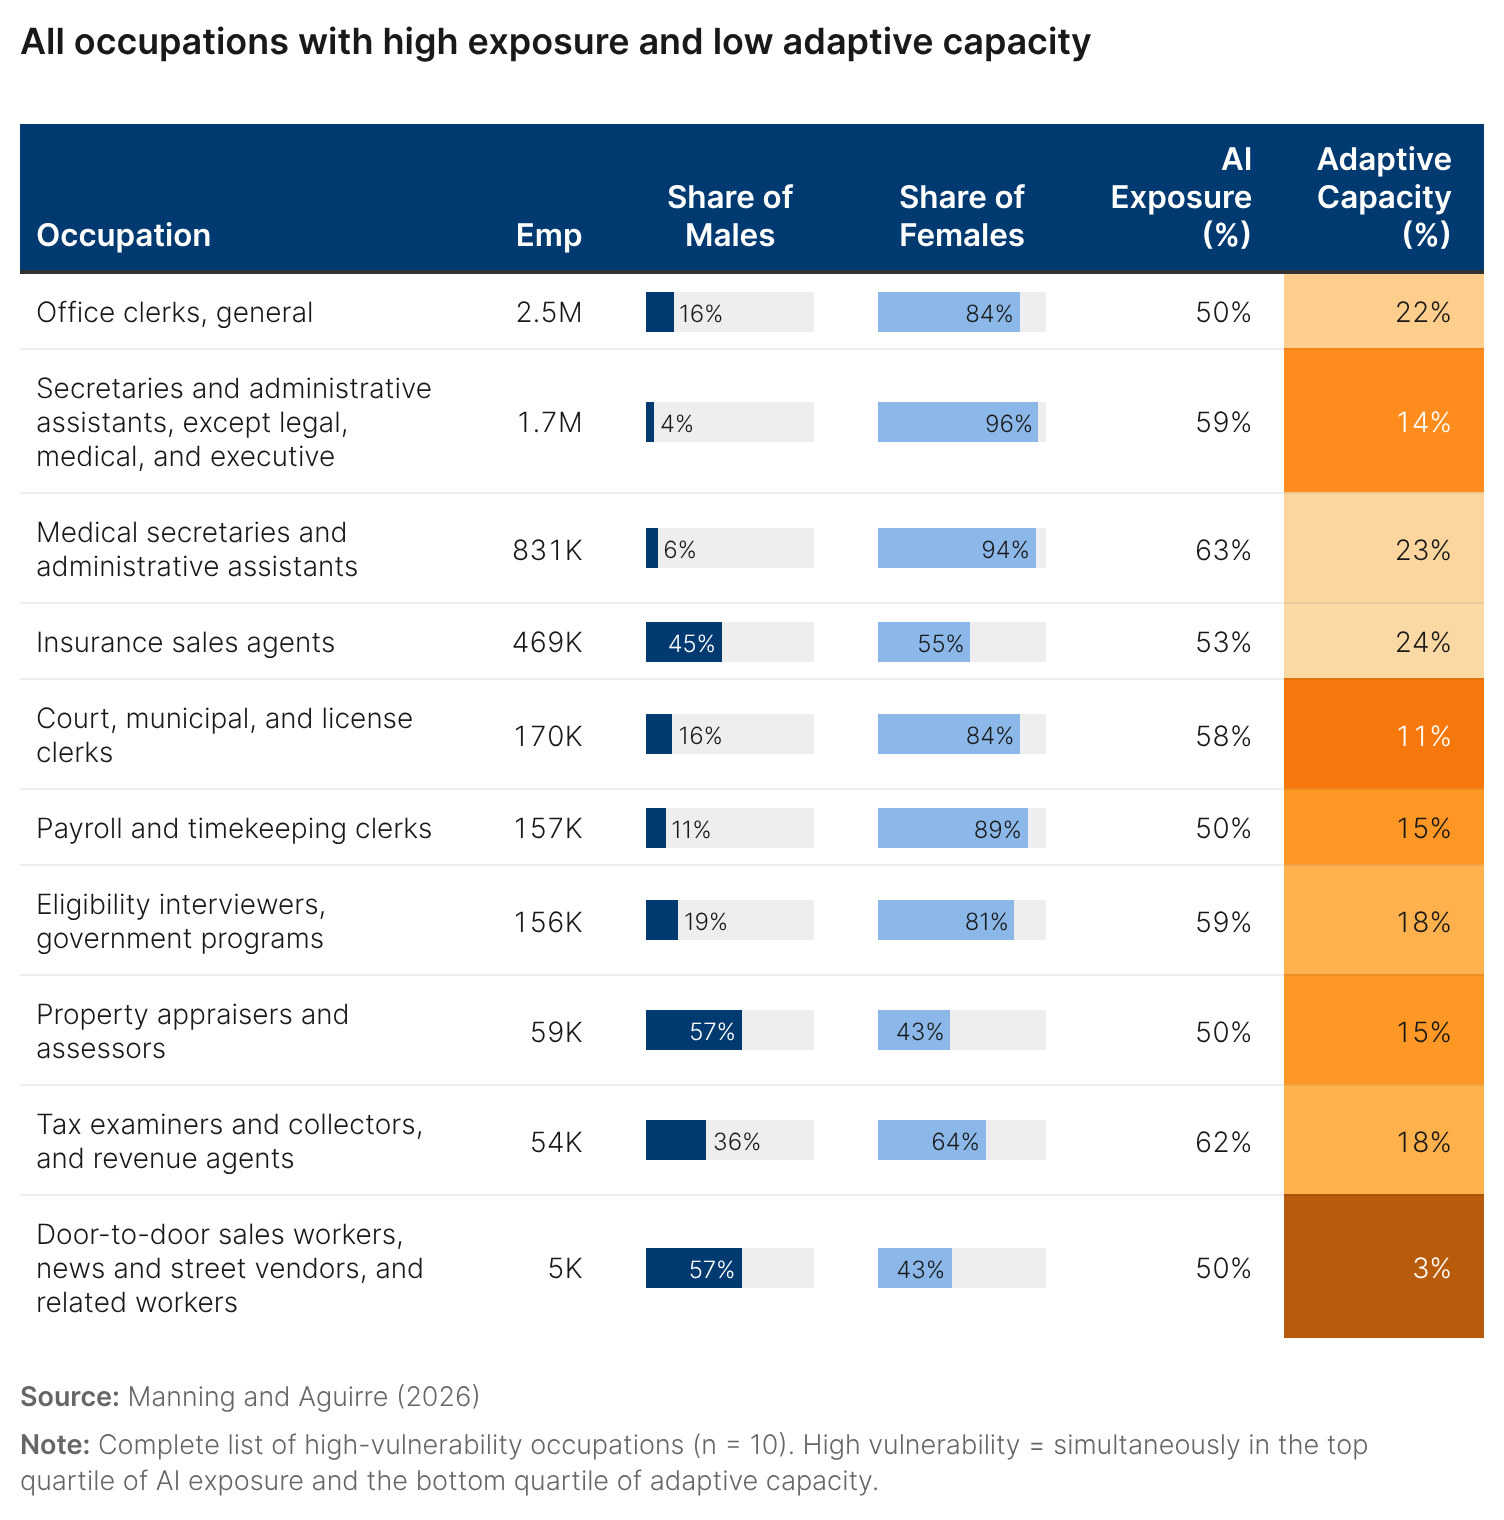
By contrast, roughly 6.1 million workers (see Appendix) face both high exposure to LLMs and low adaptive capacity to manage a job transition. Concentrated in jobs located in the lower-right quadrant of Figure 1, these potentially more vulnerable workers are employed in occupations with both top-quartile AI exposure and bottom-quartile adaptive capacity. Many of these workers occupy administrative and clerical jobs where savings are modest, workers’ skill transferability is limited, and reemployment prospects are narrower. As such, if faced with an AI-related job loss, workers in these roles are likely among the most at risk of lower reemployment rates, longer job searches, and more significant relative earnings losses compared to other workers.
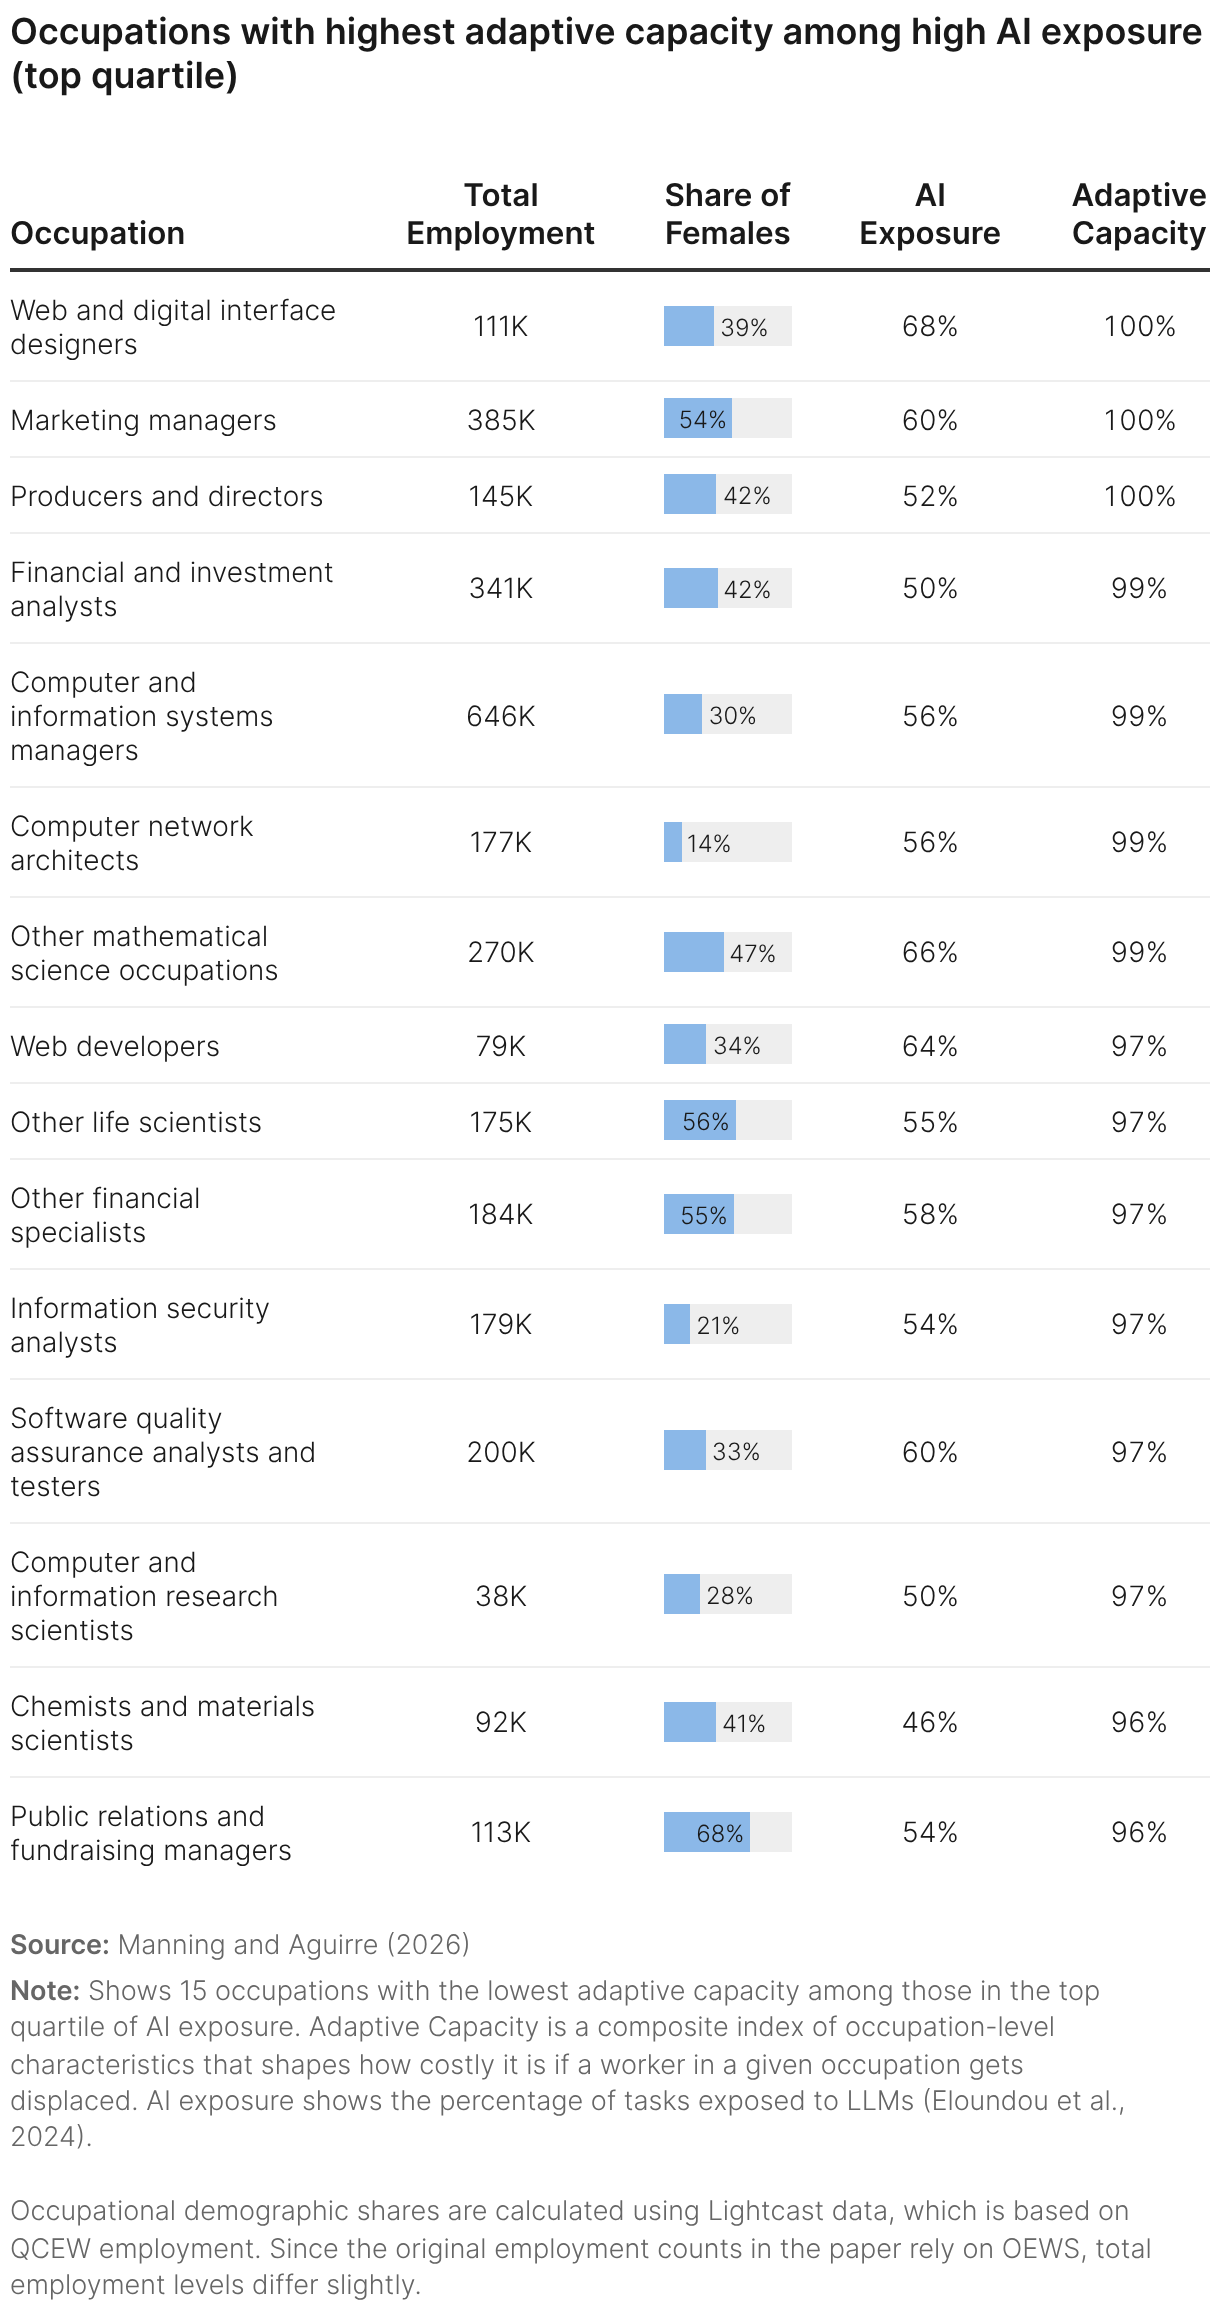
Looking more closely, the interplay of adaptive capacity scores with AI exposure scores reveals a positive correlation: As exposure increases, adaptive capacity generally increases as well. This reflects the fact that many highly exposed roles are held by financially secure, skilled, and well-networked workers—often in larger cities—who may have more opportunities to find continued employment. In that fashion, numerous workers in managerial and technical occupations are highly exposed to AI yet are nevertheless relatively well positioned to adapt (see Table 1).
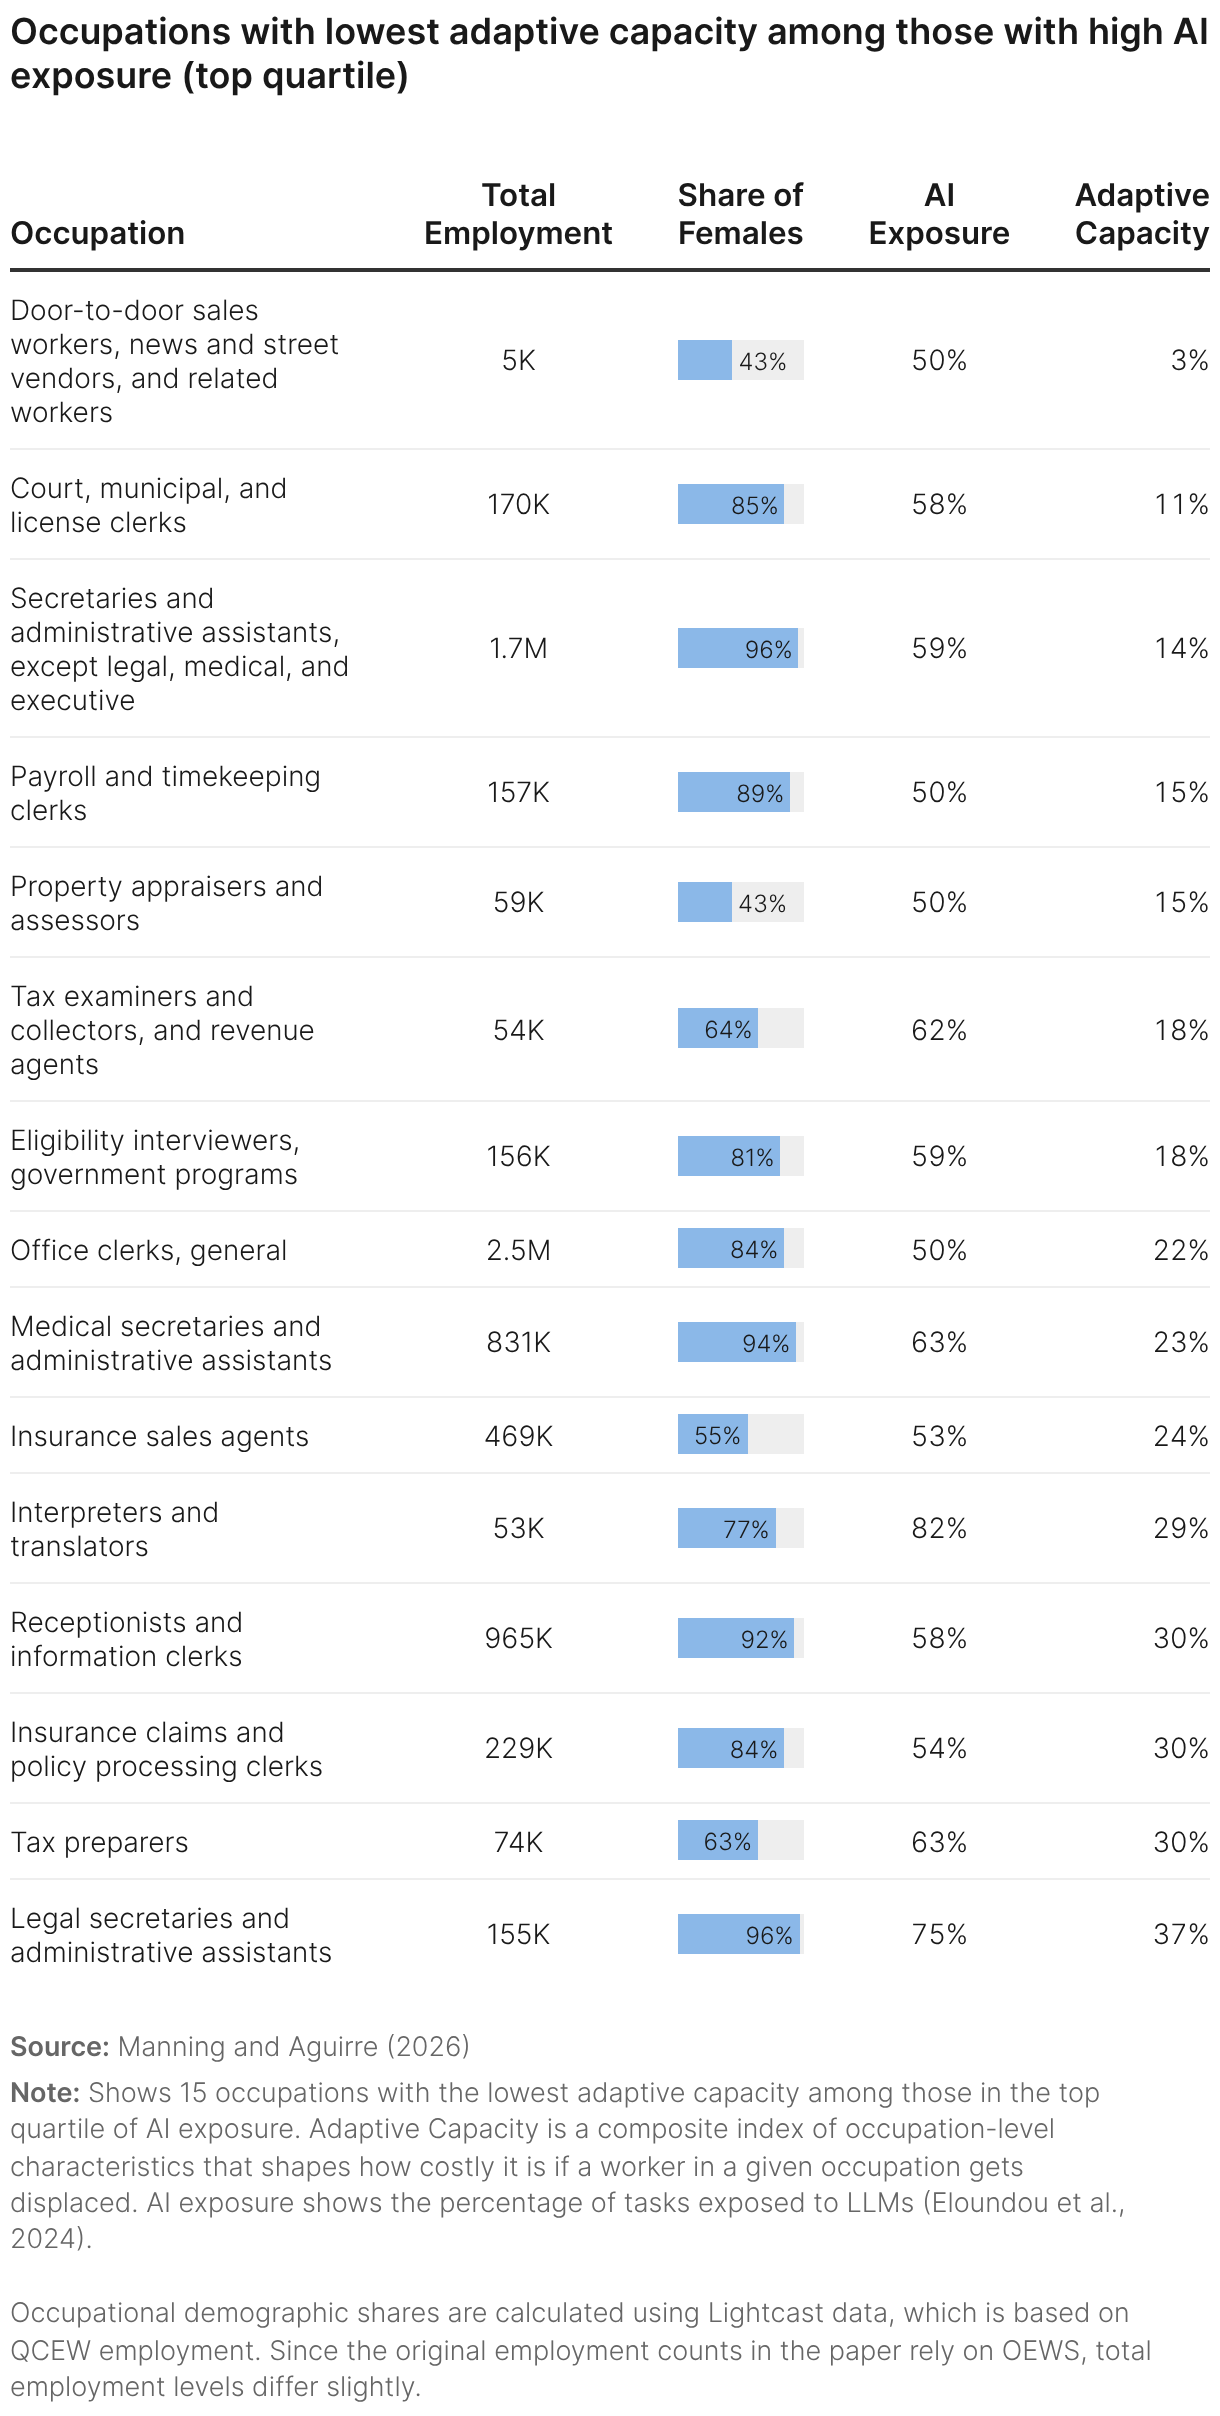
At the same time, it’s clear that the collection of occupations characterized by high AI-exposure levels and low adaptive capacity encompasses numerous routine office jobs, which are often held by workers who may struggle to adapt to disruption (see Table 2). Door-to-door sales workers and news and street vendors show the least adaptive capacity among the occupations in the top quartile of AI exposure, followed by a number of clerking and administrative occupations, such as court, municipal, and license clerks; secretaries and administrative assistants; and payroll and timekeeping clerks. In terms of these occupations’ size, office clerks (2.5 million workers); secretaries and administrative assistants (1.7 million); receptionists and information clerks (965,000); and medical secretaries and administrative assistants (831,000) stand out as some of the largest occupations in the list. The combination of employment size, potentially elevated automation impacts, and precarious worker traits highlights occupations where policymakers may benefit from greater visibility into AI’s workforce effects.
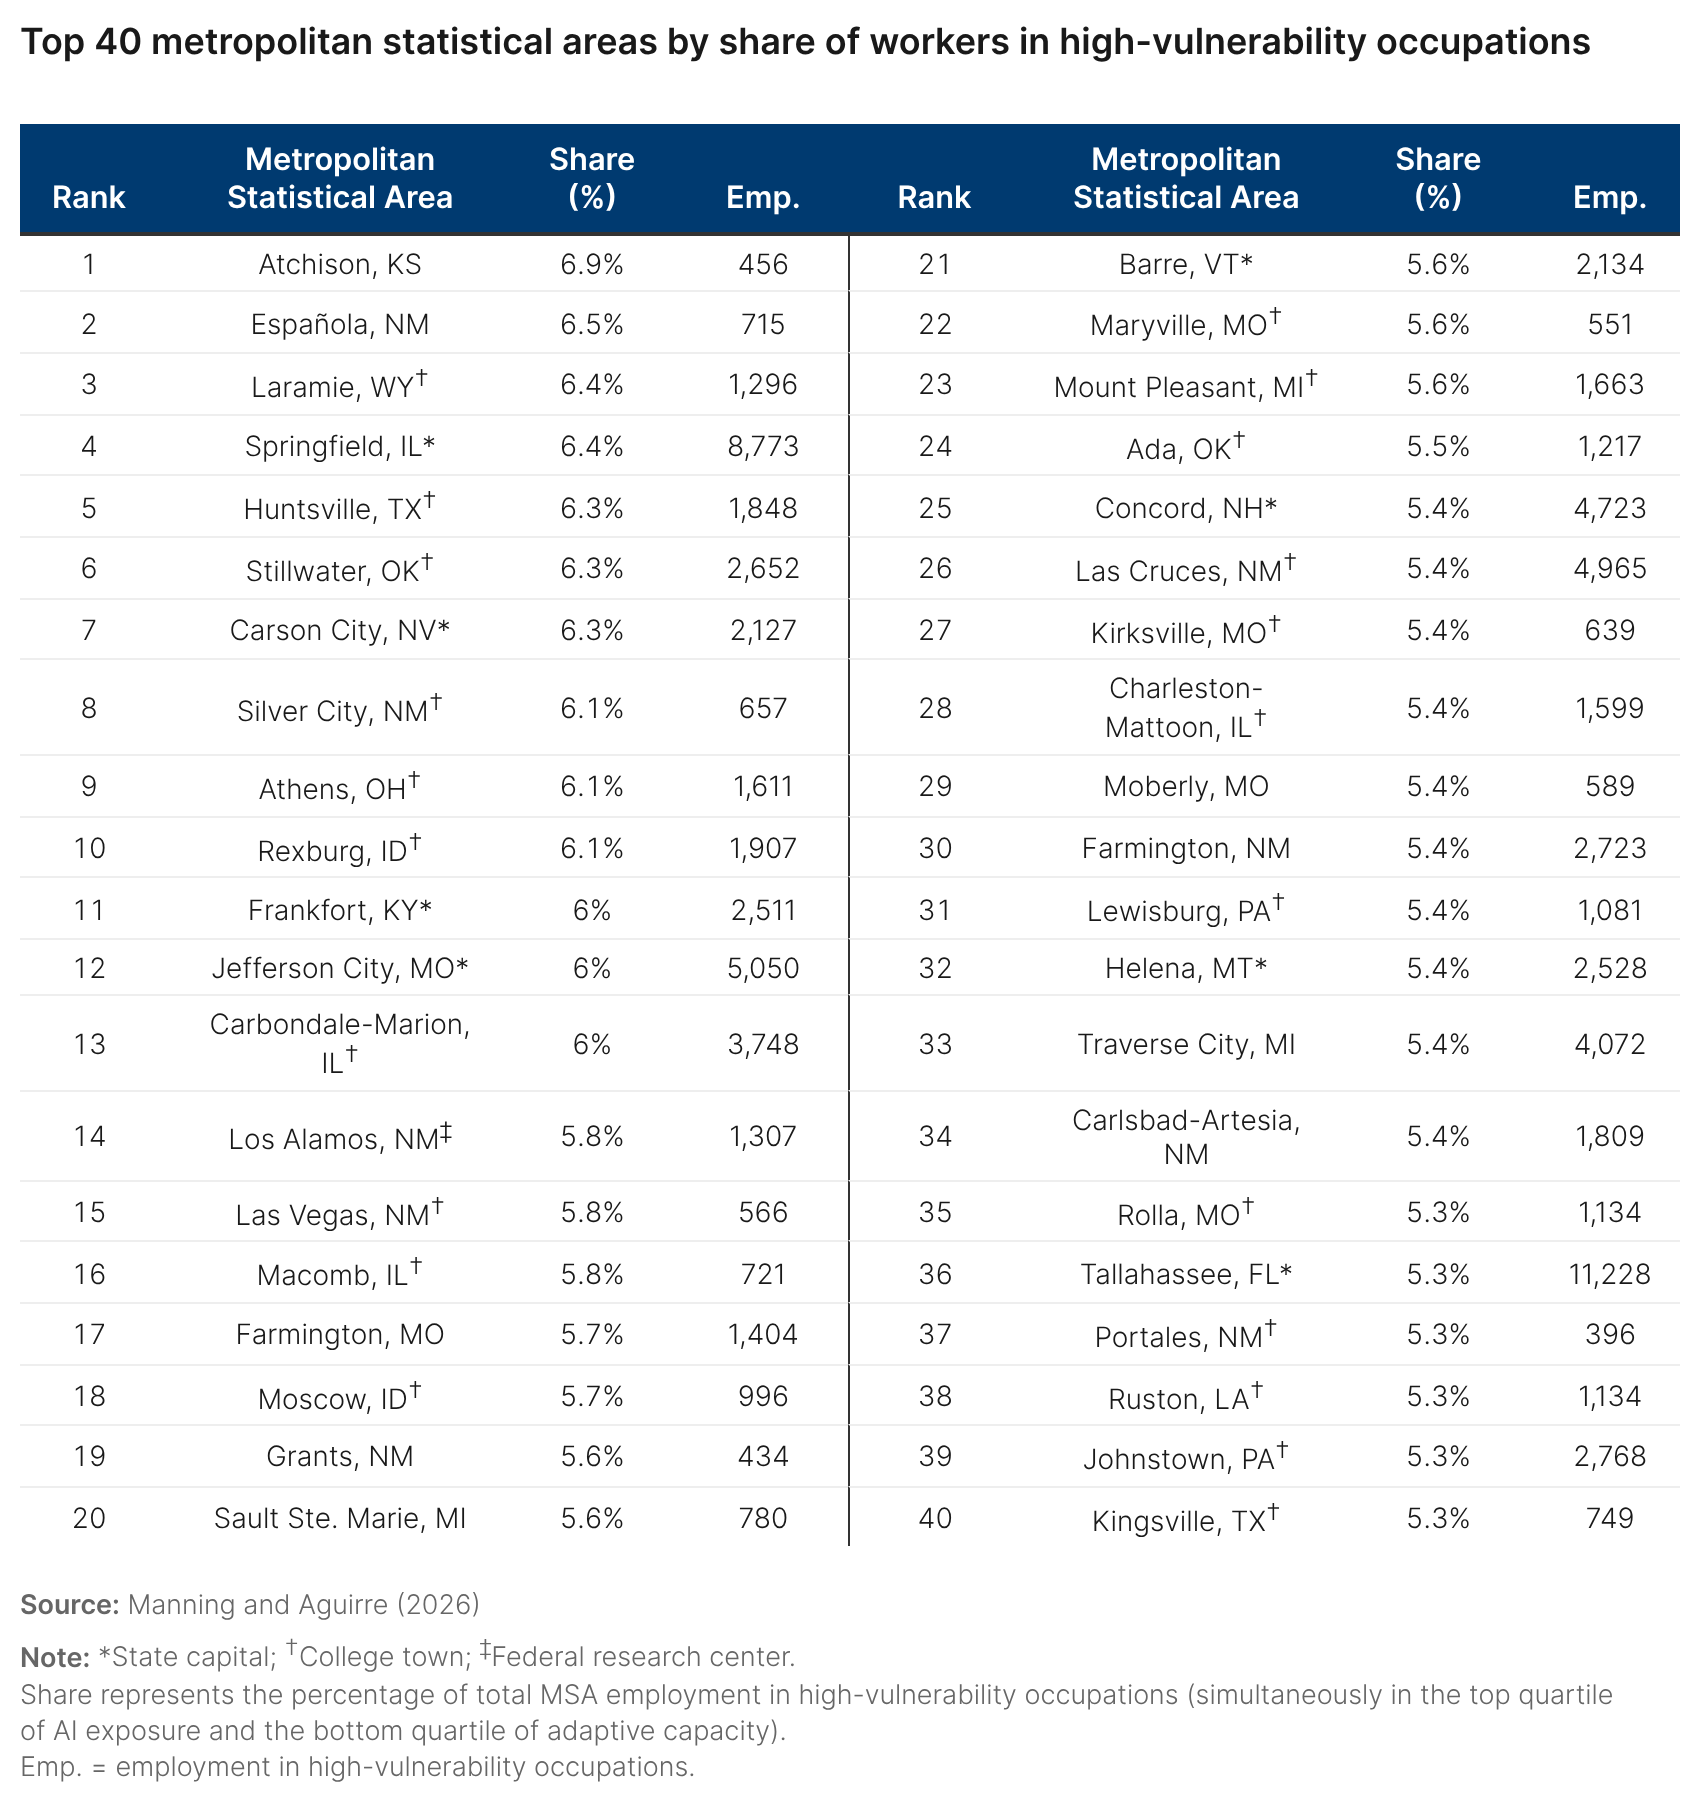
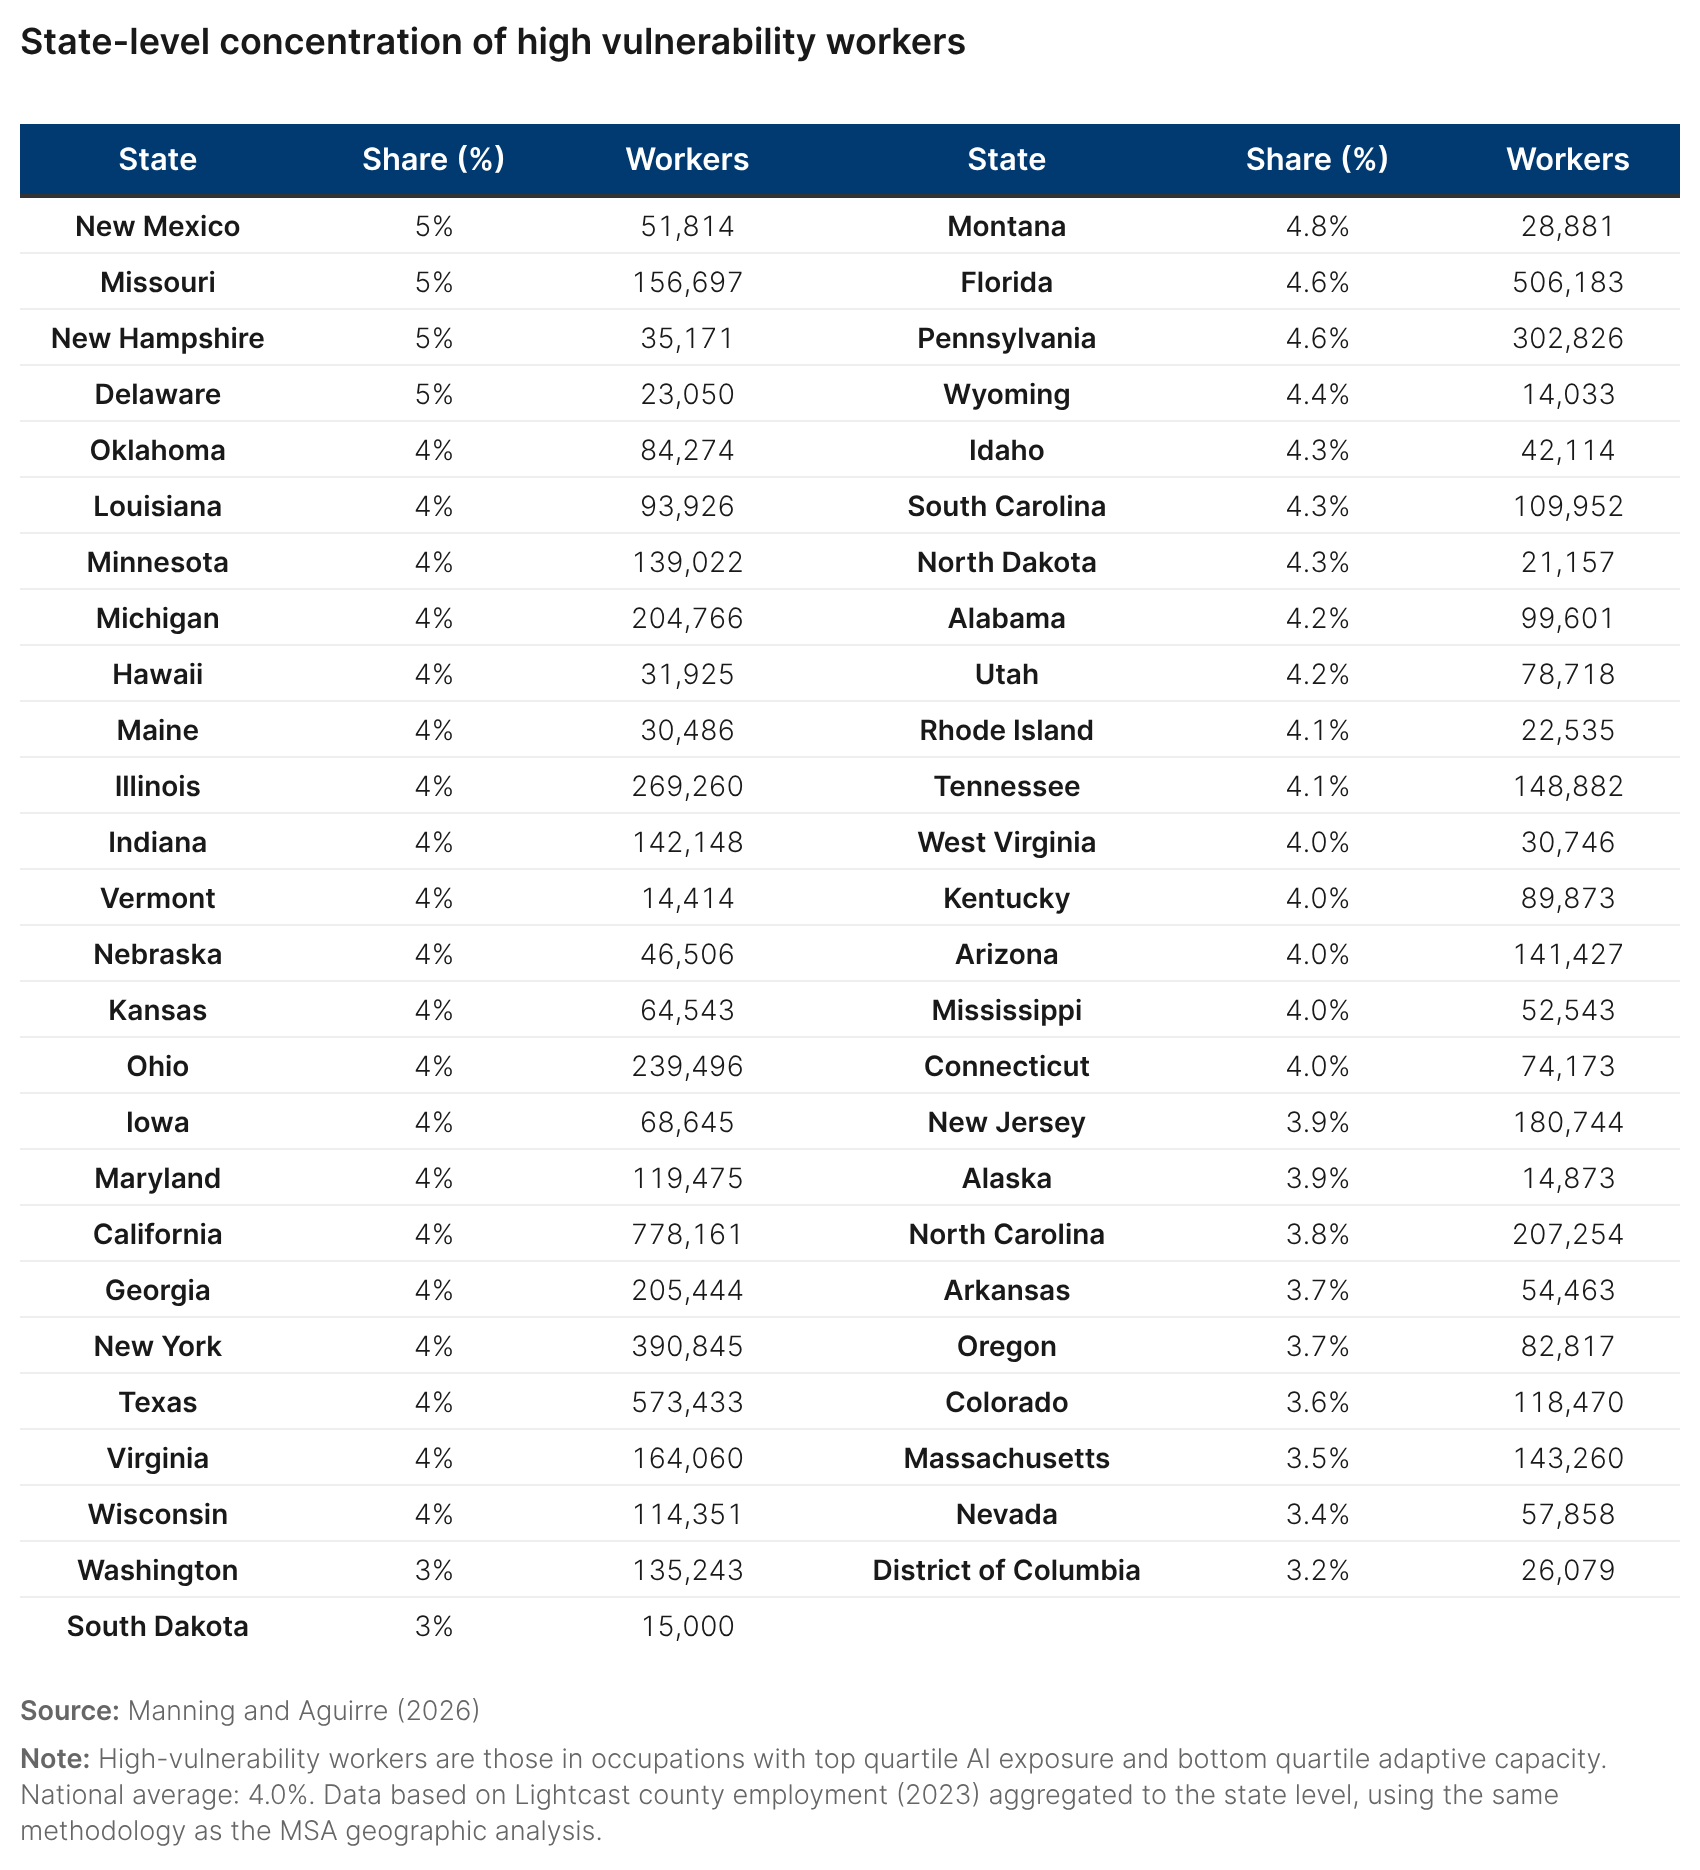
Shifting focus to the geographical incidence of AI exposure and adaptive capacity, the analysis here shows concentrations of highly exposed and highly adaptive workers are greatest in tech hubs such as San Jose, Calif., and Seattle. Conversely, the share of workers in highly exposed but low-adaptive-capacity occupations ranges from 2.4% to 6.9% in the nation’s metro areas, with a national average of 3.9%. The concentration of exposed and vulnerable workers is greatest in smaller metro areas and college towns, particularly in the Mountain West and Midwest—reflecting such areas’ elevated presence of administrative and clerical workers. Key metro areas with elevated shares of potentially vulnerable workers (those with high exposure but low adaptive capacity) include college towns such as Laramie Wyo., Huntsville, Texas, and Stillwater, Okla.; state capitals such as Springfield, Ill., Carson City, Nev., and Frankfort, Ky.; and small towns in New Mexico and Oklahoma.

Overall, the figures, charts, and map here suggest that supplementing AI exposure with measures of worker characteristics yields a different (and potentially more useful) level of insight into potential worker resilience and vulnerability.
Limitations: Significant uncertainty surrounds the question of how AI will impact labor markets, and occupation-level measures cannot tell the whole story
This analysis is not without limitations, and despite the new evidence generated here, there remains significant uncertainty about both the extent to which AI will impact labor markets as well as the differential burdens and opportunities that AI can bring for affected workers. The full NBER paper includes a more complete description of potential limitations. We briefly discuss several here.
First, the adaptive capacity index is computed at the occupation level, but the adaptive capacity of different workers within the same occupation can vary substantially. For example, even though computer network architects score highly on the index, a 30-year-old computer network architect with a diverse range of past industry experience living in San Francisco may be better positioned to manage a job transition than a 56-year-old worker who shares the same job title but has worked at one small IT company in a smaller market for their entire career. Similarly, two software developers may have very different levels of liquid savings to help weather an income shock, and two office clerks may work in labor markets that offer very different sets of alternative work opportunities if displaced.
Additionally, there are numerous ways one could compose a measure of adaptive capacity to displacement. The approach taken here represents an initial attempt to introduce this concept. However, there are dozens of confounding individual, firm, occupation, and local labor market factors that will ultimately shape a worker’s ability to navigate technological displacement, and that evade measurement in this index. The result that AI exposure is positively correlated with measures of adaptive capacity appears robust across many alternative ways of computing the index, but individual occupation-level results will be more sensitive to different approaches. More data from the U.S. context on other factors and their relative importance for shaping post-displacement outcomes would help expand the utility of any adaptive capacity measure.
Finally, the evidence underlying the adaptive capacity estimates here is derived primarily from observed effects in localized displacement events, rather than from large-scale employment shifts across occupations. As a result, the index may be most informative when displacement is relatively isolated—for example, when a worker loses their job but related occupations remain stable. In scenarios in which AI affects clusters of related occupations simultaneously, structural job availability may matter more than individual-level characteristics. Moreover, if AI fundamentally transforms the economy on a scale comparable to the industrial revolution (as some experts have suggested could be possible), it could make entire skill sets redundant across several occupations simultaneously.
How the economy will react to structural changes AI may bring is difficult to predict, and any occupation-level adaptive capacity measure could drastically change as AI impacts skill demands and helps create new jobs and industries. The measure discussed here represents one snapshot in time based on available data on the drivers of adaptive capacity.
Conclusion: Adaptability analysis can help reveal who may be most in need of support to weather AI-driven job transitions
Overall, this analysis offers a more nuanced picture of AI’s possible impacts on workers than AI exposure measures can on their own.
Specifically, the analysis focuses on understanding the degree to which workers in different highly exposed occupations could manage a job transition after involuntary displacement. In doing so, it makes clear the existence of both large zones of strong resilience to job loss across the workforce as well as concentrated pockets of heightened vulnerability if displacement were to occur.
Given this, the report likely has practical use for workforce and employment development practitioners because understanding where workers are most and least resilient to AI-driven labor market change may help inform the optimal use of public funding for workforce adjustment programs.
Such information can also be used to inform efforts to track labor market impacts. For example, policymakers concerned about potential negative impacts from AI-induced displacement may be able to use adaptive capacity measures to target investment in new data collection on groups of workers with lower estimated adaptive capacity. Additionally, such measures could be considered to target and streamline eligibility for particular workforce transition assistance programs.
In sum, as AI continues to spread across the economy, adaptability analysis can provide a starting point for policymakers to better understand who may be most in need of better support to weather job transitions.
-
Appendix
Complete list of high-vulnerability occupations
Geographic distribution of high-vulnerability occupations
State-level geographic patterns
Data sources
The authors combine data from seven sources:
- Survey of Income and Program Participation (SIPP) 2022-2024 Panels: Detailed information on workers’ income, savings, and demographic characteristics used for constructing occupation-level measures of median net liquid wealth.
- American Community Survey (ACS) 2024: Microdata on workers’ age distributions across occupations used for calculating the share of workers aged 55 and older.
- Occupational Employment and Wage Statistics (OEWS) 2024: Occupation-level wage and employment data used for cross-dataset harmonization of weights and income measures.
- Bureau of Labor Statistics Employment Projections: Data on projected employment growth rates by occupation (2024 to 2034) used to calculate growth-weighted skill transferability.
- Lightcast 2023: Occupation-level employment data by county and metropolitan statistical area.
- O*NET Database 30.1 (2025): Skill importance ratings to measure skill transferability across occupations.
- AI exposure data: Measures of occupational exposure to LLMs from Eloundou et al. (2024), specifically their E1+0.5E2 measure.
For smooth data integration, the authors first harmonize occupation codes across datasets to create a common occupational taxonomy. This includes modifications (such as weighted averages, etc.) to group certain occupations differently classified between data sources. More details are available in the full paper.
- O*NET > SOC > OEWS > Modified SIPP
- Census > SIPP > Modified SIPP
Only occupations meeting strict data quality thresholds (e.g., ≥15 SIPP respondents) are included. The final dataset covers 95.9% of the U.S. workforce (356 occupations) based on OEWS data.
See Online Appendix available here for more detail.
Authors


The Brookings Institution is committed to quality, independence, and impact.
We are supported by a diverse array of funders. In line with our values and policies, each Brookings publication represents the sole views of its author(s).