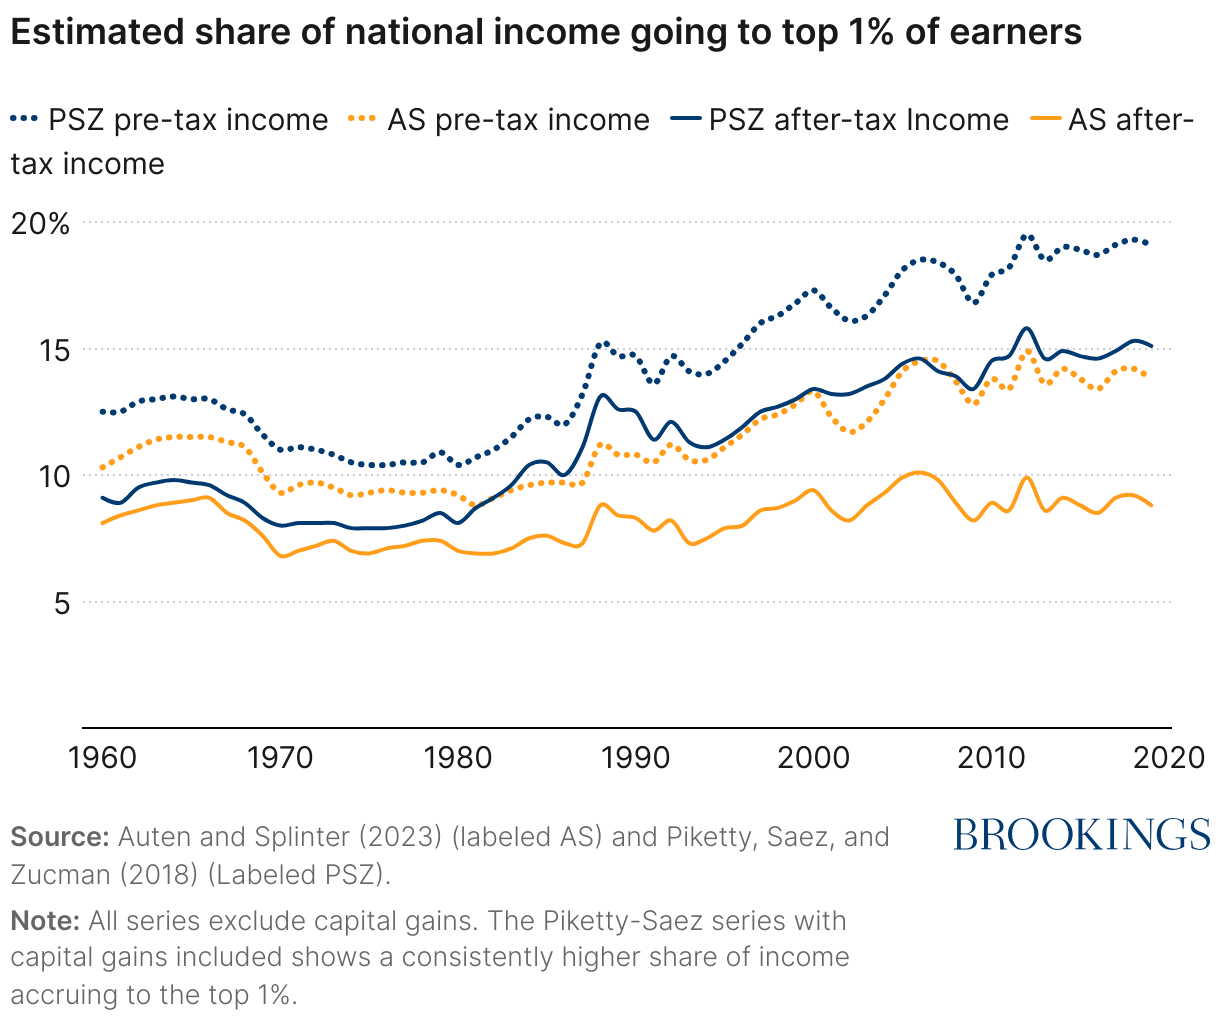
There is substantial evidence that income inequality in America rose throughout the late 20th and early 21st centuries. Influential research by Thomas Piketty, Emmanuel Saez, and Gabriel Zucman (PSZ) finds that inequality has risen markedly, with the top 1% of taxpayers’ share of after-tax-and-transfer income rising from 9% in 1960 to 15% in 2019.
Recently published work by Gerald Auten and David Splinter (AS) paints a different picture. The authors find that inequality has barely budged, with the top 1% receiving 9% of after-tax income in 2019, up only slightly from 8% in 1960.
Remarkably, the two author teams use the same income concept (national income) and the same data (based on tax returns) to generate these contrasting results. How can such different conclusions arise given the similarity in approach? And what is the right way to characterize income inequality?
What are the trends?
The figure below reports the basic results. From 1960 to 2019, the after-tax-and-transfer share of national income going to the top 1% rose by 6 percentage points according to PSZ but only 1 percentage point according to AS.
Part of the difference between the two is related to their measurement of pre-tax income shares. PSZ find the top 1% share of pre-tax income rose by 6 percentage points (from 13% to 19%) and AS estimate the increase to be 4 percentage points (from 10% to 14%). But different estimates of pre-tax income shares only explain 2 of the 5 percentage point discrepancy.
The remaining 3-point gap results from different estimates of the effects of tax and transfer policies. For both the pre- and post-tax measures, the PSZ and AS estimates were very similar in the 1960s but diverged after the Tax Reform Act of 1986 with the growth in passthrough businesses.
What drives the differences?
Although the two author teams start with the same tax return data and aim to measure inequalities in the same concept—national income—their results differ substantially because a substantial share of national income is not reported on tax returns. This may occur for two reasons: Either the income is not subject to tax (e.g., employer-provided health insurance) or because taxpayers take steps to avoid taxes when they report their income to the IRS.
How this missing income is imputed and allocated across individuals drives much of the difference between PSZ and AS, and there is no consensus on the right set of choices. Angus Deaton (2020) sums up the issue in this way:
Allocating from tax returns is hard enough, because tax units are neither individuals nor households, but allocating the other half of national income is an immensely more difficult task, requiring assumptions that are rarely well supported by evidence and often seem arbitrary. Because distribution is such a controversial topic, these assumptions leave plenty of scope for politically-biased challenges, in which each commentator can choose their own alternatives and get almost any result they choose.
Many of the choices made in earlier research by Piketty and Saez (2003), and later by PSZ, tended to push measured inequality higher. In contrast, almost all the choices AS have made tend to push top income share estimates down, relative to PSZ. Still, these decisions are not “just” political. There are key substantive issues at stake.
Tax evasion and avoidance
Some income is not reported on tax forms because individuals (illegally) evade taxes and (legally) take steps to avoid taxes by recharacterizing income. This is a consequential issue: For example, more than 50% of all pass-through business income goes untaxed according to national accounts data.
PSZ assume that unreported income should be assigned proportional to reported income. AS, on the other hand, impute the income based on the results of IRS tax audit studies, which suggest more of the missing income accrues to middle-income households. AS show this choice accounts for 2 percentage points of the 6-point 2014 gap in top 1% income, when evaluated independently of other methodological differences.
In principle, audit studies are a useful source of information on nonpayment. In practice, however, they miss any tax evasion sufficiently sophisticated to escape the notice of auditors. Because such sophisticated evasion tends to be concentrated among the wealthiest taxpayers, assigning misreported income based on audit studies—as AS do—will tend to understate the share of pre-tax income going to the top 1% of earners.
In a recently released response to Auten and Splinter (2023), PSZ point out that the AS imputations implicitly assume that more than 70% of business income earned by the bottom 99% goes untaxed, compared to just 20% of top 1% business income. Our own work with the Survey of Consumer Finances finds results closer to the assumptions used in PSZ: A proportional adjustment brings our estimated taxable incomes into better alignment with incomes published by the IRS.
Retirement accounts
Pension contributions and the interest and dividends earned on retirement balances count as part of national income. Pension withdrawals do not. Both PSZ and AS diverge from this treatment. They exclude pension contributions and include retirement benefits and withdrawals, bringing the income concept more in line with popular views about what the income distribution should be capturing.
But they differ from one another in assumptions about non-taxable retirement income, which can reflect distributions from Roth IRAs (which are considered income) or rollovers from one retirement account to another (which are not). In earlier versions of their work, PSZ mistakenly assumed too large a share of non-taxable rollovers were income. This meant that PSZ were overstating top income shares, especially among the very wealthy. In recent updates, PSZ have taken steps to be more in line with AS on this issue.
However, AS claim that the revised PSZ series still slightly overstates what proportion of non-taxable distributions should be characterized as income. Unlike some of the other issues being debated, this is fundamentally an empirical question; better evidence is needed to identify the correct answer. The different assumptions about distributing retirement flows contribute about 1 percentage point to the 6-point gap between AS and PSZ in 2014.
Consumption by governments
The treatment of consumption spending on goods and services by governments also contributes significantly to the after-tax discrepancy between AS and PSZ top income shares. Government consumption includes expenditures (valued at cost) for defense, infrastructure, education, and other similar programs; it does not include transfer payments. While PSZ allocate this consumption proportionally to after-tax income, AS allocate half of it proportionally to after-tax income and half on a per capita basis, contributing 1.3 percentage points to the gap between AS and PSZ in 2014.
Allocating expenditures entirely by income, as done by PSZ, is likely too extreme. Education expenditures in particular are distributed closer to a per capita basis. But it is genuinely unclear how to measure the value of defense and infrastructure spending to households across the income distribution. This issue is one where, a la Deaton, there is no single “correct” answer. The reasonable range of estimates may fall somewhere in between the two positions.
Non-Social Security government deficits
Both PSZ and AS assign Social Security benefits to the recipients and payroll taxes (both employer and employee portions) to the worker. The allocation of the rest of the federal deficit, however, will depend on future decisions by policymakers. AS assign non-Social Security deficits in proportion to federal income taxes, while PSZ assign deficits equally between government transfers received and federal income taxes. In essence, AS assume that deficits will be entirely funded by tax increases proportional to existing federal income tax payments, while PSZ assume they will be funded half by tax increases and half by benefit cuts. This differing treatment explains 0.4 percentage points of the gap in 2014.
Other Issues
Several other issues make smaller contributions to the measurement of inequality. Some of these (e.g., how to group tax returns to deal with differential changes in marriage rates between the top 1% and others) are relatively uncontroversial, while others (e.g., how to treat the distribution of government transfers) are subject to fierce debates but ultimately are not quantitatively important for differences between the authors. The treatment of corporate retained earnings was a key point of contention in earlier versions of the papers, but the differences appear to be mostly ironed out after PSZ made changes to their series.
So, what really happened to inequality?
Even taking into account the changes suggested by AS, the preponderance of evidence suggests that income inequality has increased, both in the U.S. and in other countries. Evidence also shows U.S. inequality increasing in other measures, such as health, mortality, and wealth. It is hard to see why inequality on other dimensions would have increased, in some cases substantially, if the distribution of income had not changed. Still, the research by AS raises important questions about the magnitude and timing of that increase and the assumptions researchers must make to help inform the public.
Related Content


Authors


-
Acknowledgements and disclosures
The Brookings Institution is financed through the support of a diverse array of foundations, corporations, governments, individuals, as well as an endowment. A list of donors can be found in our annual reports published online here. The findings, interpretations, and conclusions in this report are solely those of its author(s) and are not influenced by any donation.
The Brookings Institution is committed to quality, independence, and impact.
We are supported by a diverse array of funders. In line with our values and policies, each Brookings publication represents the sole views of its author(s).


Commentary
Measuring income inequality: A primer on the debate
December 21, 2023