This article is part of the “Monitoring the pillars of democracy” series. It focuses on the seven pillars essential to defending democracy, as outlined in the Brookings Democracy Playbook 2025 published by the Anti-Corruption, Democracy, and Security (ACDS) project. The series includes research and commentary on actionable steps democracy actors can take to strengthen democratic institutions and protect freedoms in the U.S. and abroad.
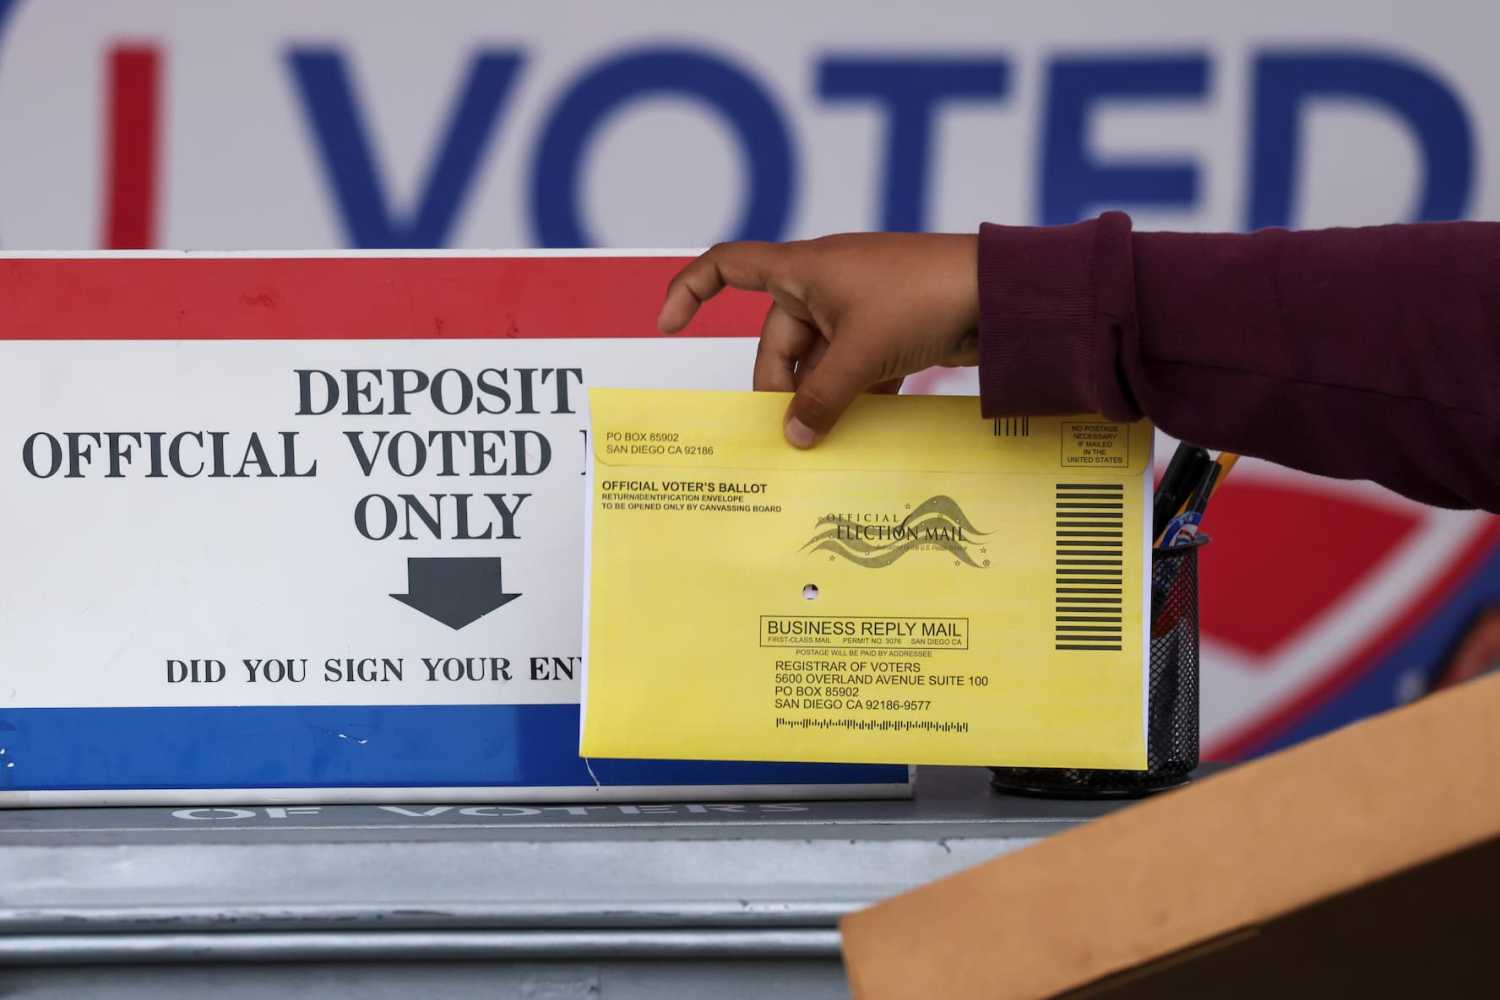
Ensuring safe, free, and fair elections is essential to maintaining a functioning democracy, particularly at a moment when three-quarters of Americans believe that democracy is under threat. Mail voting, a widespread feature of our election system, has become politically charged in recent years.
Public debate surrounding mail voting has come into greater focus following President Trump’s initial announcement of his intention to issue an executive order (EO) in advance of the 2026 general election. The EO purportedly would attempt to remove certain types of mail voting across the country. Several election law experts have assessed that an EO seeking to change election procedures presents an overreach of executive power and would be unconstitutional.
It is unclear ahead of the 2026 general election what types of mail voting a possible Trump EO might attempt to restrict or eliminate. Such an EO could be legally challenged. The president’s stance on mail voting has fluctuated. He has often criticized “100% Mail-In Voting” while at times signaling his support for absentee voting.
In this piece, we examine the important role of mail voting in maintaining a free, safe, and fair electoral process in the United States. We find that mail voting—universal vote-by-mail in particular—has substantial benefits for election administration and tens of millions of U.S. voters. As part of this analysis, we corroborate prior research that mail voting is secure and find low overall mail voting fraud, particularly in universal vote-by-mail voting systems.
How mail voting works in the US
Mail voting background
The U.S. has a long history of mail voting. Large-scale use of mail ballots originated during the U.S. Civil War, when some soldiers were allowed to vote remotely after absentee voting laws were passed in their home states. Today, mail voting is widely used around the world, with more than 30 countries—including Switzerland, Germany, and South Korea—allowing voters to cast ballots by mail.
Mail ballots are widespread across the United States. For example, in 2024 alone, the U.S. Postal Service processed over 99.2 million mail ballots.
Though terminology differs across analyses, for this piece we define mail ballots to be inclusive of both absentee and universal vote-by-mail ballots. Absentee ballots refer to those that may be requested by a voter who is unable to vote in person. These ballots can be subcategorized into those that require an excuse (excuse absentee ballots) and those that do not (no-excuse absentee ballots). In states with universal vote-by-mail, every registered voter is automatically sent a mail ballot they can use as an alternative to in-person polling.1 Every state in the U.S. provides access to either universal vote-by-mail ballots, absentee ballots, or both.2
State-by-state mail voting landscape
Given the availability of case data, our analysis focuses on U.S. general elections between 2016 and 2022. To understand the mail voting landscape for each of those elections, we began by analyzing select laws related to mail voting for each year across all 50 states and the District of Columbia.3
In both 2016 and 2018, there were 20 excuse absentee states, 28 no-excuse absentee states, and three universal vote-by-mail states.
The 2020 presidential election, which we include in our analysis, saw many states temporarily adopt more accessible voting policies amid the COVID-19 pandemic, some of which were codified in the following years. Some states like Alabama and Delaware passed emergency rules or temporary laws to transition to no-excuse absentee voting. Other states like Connecticut and Kentucky still required an excuse but included COVID-19 among the valid reasons for excuse absentee voting. Of the excuse absentee states, only Indiana and Texas did not change their absentee voting policies in light of the pandemic. Some jurisdictions that previously used no-excuse absentee voting systems transitioned to universal vote-by-mail, including California, Nevada, Vermont, and Washington, D.C.
With these policy changes, we determined that, in 2020, 13 states had excuse absentee voting systems (with many states expanding qualifying excuses), 28 had no-excuse absentee voting systems, and 10 had universal vote-by-mail voting systems.
In 2022, there were 15 excuse absentee states, 27 no-excuse absentee states, and nine universal vote-by-mail states. Alabama, Delaware, and South Carolina reverted to an excuse absentee voting system. New Jersey was the only state that transitioned from using universal vote-by-mail during 2020 back to no-excuse absentee voting in 2022.
The impact of mail voting
Increase in overall voter turnout
Several studies indicate that certain forms of mail voting can increase voter turnout. A 2009 study for the Pew Charitable Trusts found that no-excuse absentee voting increased voter participation by about 3 percentage points in comparison to states with excuse absentee voting, when controlling for other factors that may impact turnout. Adoption of a universal vote-by-mail voting system is associated with about a 2% increase in voter turnout compared to counties that did not adopt such a system, based on a 2020 study in the Proceedings of the National Academy of Sciences of the United States of America (PNAS) using a within-state comparison of counties across three states that adopted universal vote-by-mail. Additionally, a 2023 study in the Election Law Journal found that individuals had a higher probability of voting in 2018 and 2020 under a universal vote-by-mail voting system (70%) than in states with no-excuse absentee voting (65%) or in states with excuse absentee voting (62%).
Notably, a 2020 Stanford University study found that universal vote-by mail “does not appear to affect either party’s [Democrat or Republican] share of turnout” nor “increase either party’s vote share.”
Increase in access for voters
Mail ballots can be the most practical and accessible—and in some cases, the only—way to participate in the electoral process for many voters, including those with disabilities, older Americans, students living away from home, lower-income voters, and military personnel stationed overseas. However, by restricting qualifying excuses, states are at risk of disproportionately impacting segments of the electorate, such as youth voters, voters with disabilities, and voters of color.
Other mail voting requirements can disproportionately impact many individuals’ ability to exercise their right to vote. Following the passage of a Texas law in 2021, the Brennan Center for Justice found that Latino, Asian, and Black voters in the 2022 primary election were 30% more likely than white voters to have their absentee ballot applications or excuse absentee ballots rejected. Restrictions included a requirement that voters include either their driver’s license number or the last four digits of their Social Security number on their ballot application and return envelope, and that this number matches the one on file.
In general, states that adopt universal vote-by-mail voting systems reduce some racial, economic, and other disparities in election participation.
Cost savings under universal vote-by-mail voting systems
Voting by mail has other key benefits beyond increased voter access and engagement. States with universal vote-by-mail often see significant cost savings, in part because of diminished costs due to closing in-person polling locations, reducing the number of temporary poll workers needed, lowering equipment costs, and decreasing need for provisional ballots (defined as back-up or “fail-safe” ballots for voters who believe they were improperly excluded from a list of registered voters).
Colorado’s universal vote-by-mail voting system demonstrates these advantages. Following Colorado’s adoption in 2013 of H.B 13-1303, which instituted universal vote-by-mail, the state saw an average 40% decrease in county election administration costs between 2008 and 2014, according to a 2016 study by the Pew Research Center. Other states that adopted universal vote-by-mail policies experienced similar cost savings.
Evaluating different mail voting systems
Several prior analyses have found that mail voting fraud is extremely rare, though exact percentages differ slightly based on the years or cases reviewed. A piece in the Hill in 2020 drawing from the Heritage Foundation’s database found that only about 0.00006% of total votes cast were fraudulent mail votes over the preceding 20 years. Other analyses have looked at a subset of states that have transitioned to universal vote-by-mail. The New York Times reported that states that have universal vote-by mail voting systems see “essentially zero fraud.” Specifically, they found that Oregon has seen only about a dozen documented cases of fraud since switching to a universal vote-by-mail voting system in 2000. A study conducted by the American Statistical Association found “no evidence that voting by mail increases the risk of voter fraud overall,” and estimated that Washington state would have likely seen around 80 more cases of fraud between 2011 and 2019 had it not transitioned to a universal vote-by-mail voting system.
To complement the body of existing literature, we analyzed data on instances of mail voting fraud across mail voting systems in the U.S. 4
Only a few publicly available databases exist that compile cases of recent election fraud. News21 developed an extensive database for cases of election fraud between 2000 and 2012.5 The Heritage Foundation compiled an election fraud database containing cases of election fraud in the U.S. with years ranging from 1982 to 2025,6 which they describe as “not an exhaustive or comprehensive list.”
Our findings
Our analysis cross-references cases of mail voting fraud with an analysis of each state’s mail voting system to determine what percentage of the very small total amount of mail voting fraud comes from excuse absentee, no-excuse absentee, and universal vote-by-mail voting systems.
As our analysis focuses on four of the five most recent general elections (2016, 2018, 2020, and 2022),7 we relied on records of cases from the Heritage Foundation’s database. Each case entry involved one individual who had been charged with a type of election fraud.
First, we find that cases of fraud involving any form of mail ballots were very rare. Across the entire country, and utilizing a maximally inclusive estimate, between six and 46 cases of mail voting fraud were identified in each general election. To calculate the percentage of mail voting fraud in a given year, we divided the total number of mail voting fraud cases by the total number of mail votes cast for each general election. We find an average total mail voting fraud percentage across the 2016, 2018, 2020, and 2022 general elections of only 0.000043%, or about four cases of mail voting fraud out of every 10 million mail votes.
Although the database we utilized self-identified as “not…comprehensive,” we have reason to believe that this limited scope did not meaningfully distort our overall findings. The News21 database, which is among the most extensive databases of its kind currently publicly available, includes over 2,000 cases, of which we found 1,605 related to alleged voting fraud between 2000 and 2012. That averages to roughly 134 cases per year. Even if we assume this same case rate persisted for the four general elections examined, and assume the 134 cases of voting fraud were all mail voting fraud,8 that would still translate to only about 2.5 cases of mail voting fraud per 1,000,000 mail votes. This indicates that, even under assumptions that greatly inflate the frequency of mail voting fraud, the resulting probability of fraud remains negligible.
Irrespective of the comprehensive or non-comprehensive nature of the database, the proportions of fraud reflected in the data provide us with valuable insights. Our analysis demonstrates that, relative to absentee voting systems, universal vote-by-mail voting systems comprise the smallest percentage of the already very low mail voting fraud.9
Conclusion: Looking ahead
As highlighted in the Democracy Playbook 2025, safe, free, and fair elections are paramount for a healthy democracy. Moving forward, access to publicly available, comprehensive data on mail voting is critical to provide transparent and accurate information to election officials, policymakers, and the public.
As the discussion surrounding mail ballots continues in the lead-up to the 2026 elections, leveraging our understanding of the positive impacts of mail voting—particularly universal vote-by-mail—is vital to advancing equitable and secure elections.
-
Methodology
*Note that this methodology includes some sections and footnotes from the above piece for clarity and readability.
As our analysis focuses on four of the five most recent general elections (2016, 2018, 2020, and 2022), we relied on the records of cases from the Heritage Foundation’s database, which “presents a sampling of recent proven instances of election fraud.” Though the “Explore the Data” page indicates categorizations for “Case Type” and “Fraud Category,” we were not able to locate any publicly available information on the methodology used to collect this sampling of cases. The Heritage Foundation’s website states: “To be clear, this database is not an exhaustive or comprehensive list of all election fraud in the states. It does not capture all cases and certainly does not capture reported instances or allegations of election fraud, some of which may be meritorious, some not, that are not investigated or prosecuted.” The database contains 1,600 cases with years listed from 1982 to 2025.
Each case entry we included involved one individual who had been charged with a type of election fraud. Though there were cases listed in 2024 and 2025 in the Heritage Foundation’s database, none of those cases involved fraud that took place during the 2024 election year. We thus focus our analysis on the four prior general elections: 2016, 2018, 2020, and 2022.
For the purpose of our analysis, voting fraud includes but is not limited to altering the vote count, fraudulent use of absentee ballots, buying votes, or ineligible voting, but excludes false registration and ballot petition fraud. To err on the side of inclusion, we define mail voting fraud as any instance of voting fraud involving the use of a mail ballot.
We began our analysis by determining which cases in the database included voting fraud that took place in relation to one or more of the four general election years we examined, as well as which ones could have possibly involved mail voting fraud under our definition. To err on the side of inclusion, we included cases in our database that ended in nolle prosequi notices, plea deals, pre-trial diversion programs, or other alternative sentencing structures. We included cases in which some, but not all, charges were dropped. We also included any cases that took place within 60 days of each year’s general election to provide a maximum possible estimate. While there is variance in state statutes governing the number of days before a general election that mail ballots can be distributed, the earliest specified date is 60 days prior (in Delaware and North Carolina), which serves as a reasonable upper bound for inclusion.
We excluded cases from our database in which the year of offense could not be confirmed, as well as those involving fraudulent ballot petitions. We also excluded any cases that took place over 60 days prior to the election. Any case with a charge of registration fraud was excluded, given that mail voting does not make registration fraud easier or harder to commit. Finally, we excluded any cases in which all legal charges were dropped or defendants were acquitted.
In making the above classifications, we do not intend to assert nor imply any individual determinations of guilt or liability.
For each included case, we independently verified key facts using court filings, administrative records, and news sources. After classification, we used our source files to determine whether each case involved use of mail ballots. Cases with evidence of mail voting were marked as such. Cases with evidence of in-person voting were classified as “no explicit evidence of mail voting.” Cases lacking clear evidence of voting method were also marked “no explicit evidence of mail voting” and excluded in our final count to avoid false positives.
We then reviewed state mail voting laws for each general election year using data from the United States Election Assistance Commission’s Election Administration and Voting Survey (EAVS) to identify which states had excuse absentee, no-excuse absentee, and universal vote-by-mail voting systems in each year.
Some states in each general election year had exceptions to their mail voting policies. For example, in 2016, Minnesota had a no-excuse absentee voting system, with an exception for some non-metropolitan counties or cities with fewer than 400 registered voters. In those locales, there was often the option of using an all-mail voting system. We were unable to confirm whether the cases we analyzed fell under such exceptions given statutory differences across states and years. However, based on exploratory analysis we conducted across a subset of several, randomly selected states, it is likely that very few—if any—of the cases we analyzed fall under these exceptions. We examined all cases of mail voting fraud in Arizona, Idaho, Indiana, Maine, Minnesota, and New Jersey that took place during the 2016 general election and confirmed that no cases fell under the relevant statutory exceptions.
For the cases we have determined involved mail voting fraud, we cross-referenced the state in which the case took place to determine what type of ballot was used: an excuse absentee ballot, a no-excuse absentee ballot, or a universal vote-by mail ballot. By default, we kept the state listed in the Heritage Foundation database, as that was the jurisdiction in which the individual was charged. For duplicate voting cases in which an individual voted by mail in one state and in person in another, we assigned the state to that in which mail voting took place, to err on the side of inclusion. When duplicate voting involved mail ballots in two different states, we assigned the state that was not the individual’s primary residence, as that is the state in which they cast a duplicate, fraudulent vote. In states with universal vote-by-mail, if an individual voted on behalf of two people and was not listed in the Heritage Foundation’s database as committing impersonation fraud, we again erred on the side of inclusion and assumed use of a mail ballot.
Using EAVS data, we calculated the total number of mail ballots transmitted to voters in each general election by summing the number of ballots transmitted to domestic absentee voters and the number of ballots transmitted to voters under the Uniformed And Overseas Citizens Absentee Voting Act (UOCAVA). We also used EAVS data to calculate the total number of mail ballots cast nationally and in each state for each general election year. Because no cases of fraud in the Heritage Foundation’s database occurred in American Samoa, Guam, the Northern Mariana Islands, Puerto Rico, or the U.S. Virgin Islands, we excluded these jurisdictions and focused our analysis on the 50 states and the District of Columbia.
Using our compiled dataset, we calculated the percentage of mail voting fraud per total mail ballots cast for each general election by dividing the total number of mail voting fraud cases by the total number of mail votes cast and multiplying by 100. We then took the average percentage across all four general elections.
For our counterfactual analysis, we used the News21 database of election fraud cases. According to News21, “a national investigative reporting project” their team sent out over “2,000 public-records requests and spent nearly $1,800 on fees for records searches and copies of documents. The team also reviewed nearly 5,000 court documents, official records and media reports. The result is the most extensive collection of U.S. election fraud cases ever compiled.” The database contains over 2,000 cases and lays out its methodology and limitations. We scraped the data from the News21 website and, consistent with our own analysis, filtered out cases related to registration fraud, petition fraud, campaign fraud, procedural error, and intimidation, leaving the 1,605 cases dealing with voting fraud specifically. To err on the side of inclusion, we retained cases that had not yet reached a conviction. As with our primary dataset, we do not intend to assert nor imply any individual determinations of guilt or liability in making these determinations.
We divided these 1,605 voting fraud cases by the 12 years covered by the database to estimate the average number of voting fraud cases per year, yielding an average of 134 cases. We then divided 134 by the total number of mail votes cast for each general election and multiplied by 100 to calculate the counterfactual percentage of mail voting fraud for each general election. The 134 cases on average per year do not in reality each represent a case of mail voting fraud. Finally, we averaged these percentages across all four general elections.
Next, again using our modified Heritage Foundation database, we calculated the share of total mail voting fraud percentage represented by each of the three mail ballot types (excuse absentee, no-excuse absentee, and universal vote-by mail).
We calculated the total number of mail ballots cast nationally for each general election year by aggregating state-level data. Using our prior classification of state mail voting systems, we sorted the states into three categories for each general election: those that used excuse absentee voting; those that used no-excuse absentee voting; and those that used universal vote-by-mail. For each of these three categories, we summed the total votes cast in relevant states to determine how many votes of that type were cast across the nation for each general election year from 2016 to 2022. Using the cases we determined to be related to mail voting fraud, we followed a similar method to calculate the total number of mail voting fraud cases of each type for the same time span.
Finally, we calculated a normalized rate of mail voting fraud by dividing the total number of mail voting fraud cases per type by the total number of mail ballots cast of that type in each general election (e.g. the number of excuse absentee fraud cases in 2016 divided by total mail ballots across states that used an excuse absentee voting system in 2016). We normalized to account for the fact that the number of mail ballots cast in each state and number of states of each type varied widely. We then summed the normalized rates of mail voting fraud across the three systems—excuse absentee, no-excuse absentee, and universal vote-by-mail—and divided each system’s normalized rate by this combined total, multiplying by 100 to express the result as a percentage. This final calculation allowed us to identify the percentage of the overall (and already exceedingly small) mail voting fraud percentage attributable to each mail voting type.
For further questions or additional information on our methodology, please contact [email protected].
Related Content

Authors

-
Acknowledgements and disclosures
The authors would like to thank Maeva Sole Alagna, Madison Gee, Noune Kachichyan, Caroline Macneill, and Eric Urby for research assistance and Robin Lewis and Eric Urby for editorial assistance.
-
Footnotes
- Definitions are adapted from The Measure of American Elections, “Mail Ballots in the United States: Policy Choice and Administrative Challenges” by Christopher B. Mann.
- Some states have processes that allow voters to join a mail voting list. When added to said list, voters will automatically receive a mail ballot for each election. Some states offer permanent lists; others allow voters to join a list for one year. In our analysis, we did not subset mail voting categories by those that allow voters to join a mail voting list. For more information, see the National Conference of State Legislatures.
- Because no cases of fraud in the Heritage Foundation’s database occurred in American Samoa, Guam, the Northern Mariana Islands, Puerto Rico, or the U.S. Virgin Islands, we excluded these jurisdictions.
- For the purpose of our analysis, voting fraud includes but is not limited to altering the vote count, fraudulent use of absentee ballots, buying votes, or ineligible voting, but excludes false registration and ballot petition fraud. To err on the side of inclusion, we define mail voting fraud as any instance of voting fraud involving the use of a mail ballot.
- According to News21, “a national investigative reporting project,” their team sent out over “2,000 public-records requests and spent nearly $1,800 on fees for records searches and copies of documents. The team also reviewed nearly 5,000 court documents, official records, and media reports. The result is the most extensive collection of U.S. election fraud cases ever compiled.” The database contains over 2,000 cases and lays out its methodology and limitations. We scraped the data from the News21 website and, consistent with our own analysis, filtered out cases related to registration fraud, petition fraud, campaign fraud, procedural error, and intimidation, leaving the 1,605 cases dealing with voting fraud specifically. To err on the side of inclusion, we retained cases that had not yet reached a conviction. We do not intend to assert nor imply any individual determinations of guilt or liability in making these determinations.
- The database “presents a sampling of recent proven instances of election fraud.” Though the “Explore the Data” page indicates categorizations for “Case Type” and “Fraud Category,” we were not able to locate any publicly available information on the methodology used to collect this sampling of cases. The Heritage Foundation’s website states: “To be clear, this database is not an exhaustive or comprehensive list of all election fraud in the states. It does not capture all cases and certainly does not capture reported instances or allegations of election fraud, some of which may be meritorious, some not, that are not investigated or prosecuted.” The database contains 1,600 cases with years listed from 1982 to 2025. To err on the side of inclusion, we included cases in our database that ended in nolle prosequi notices, plea deals, pre-trial diversion programs, or other alternative sentencing structures. We included cases in which some, but not all, charges were dropped. We also included any cases that took place within 60 days of each year’s general election to provide a maximum possible estimate. While there is variance in state statutes governing the number of days before a general election that mail ballots can be distributed, the earliest specified date is 60 days prior (in Delaware and North Carolina), which serves as a reasonable upper bound for inclusion. We excluded cases from our database in which the year of offense could not be confirmed, as well as those involving fraudulent ballot petitions. We also excluded any cases that took place over 60 days prior to the election. Any case with a charge of registration fraud was excluded, given that mail voting does not make registration fraud easier or harder to commit. Finally, we excluded any cases in which all legal charges were dropped or defendants were acquitted. In making the above classifications, we do not intend to assert nor imply any individual determinations of guilt or liability.
- Though there were cases listed in 2024 and 2025 in the Heritage Foundation’s database, none of those involved fraud that took place during the 2024 election year. We thus focus our analysis on the four prior general elections.
- The 134 cases on average per year do not each represent a case of mail voting fraud.
- Of the minuscule 0.000043 percent of mail voting found to be fraudulent out of all mail ballots cast in the 2016–2022 general elections, after adjusting for total mail ballots cast by type, 48.5 percent involved no-excuse absentee systems, 37.9 percent involved excuse-based absentee systems, and 13.5 percent involved universal vote-by-mail systems. We normalized to account for the fact that the number of mail ballots cast in each state and number of states of each type varied widely.
The Brookings Institution is committed to quality, independence, and impact.
We are supported by a diverse array of funders. In line with our values and policies, each Brookings publication represents the sole views of its author(s).