
Introduction
The first year of the second Trump administration has seen dramatic changes in immigration policy, resulting in a sharp slowdown in net migration to the United States. We expect the pattern of restrictive policy and increased enforcement to continue or intensify through the coming year. Building on work released in late 2024 and mid-2025, we use available data combined with judgment to estimate a range of likely outcomes for net migration for the years 2025 and 2026. We conclude that net migration was likely close to zero or negative over calendar year 2025 for the first time in at least half a century. Specifically, we estimate that net migration was between –295,000 and -10,000 for the year. For 2026, we project net migration is likely to remain in negative territory. These figures come with the caveat that recent reductions in data transparency make the estimates more uncertain.
The downward population pressure stemming from negative net migration has important implications for the macroeconomy. In recent years, growth in the U.S.-born working-age population has been weak, and nearly all growth in the labor force has stemmed from immigration flows. The 2022–24 immigration surge was accompanied by robust job growth, with immigrants both supplying labor and generating demand for goods and services. Conversely, the recent slowdown in population growth has affected the level of employment growth consistent with an unchanged unemployment rate, often called “breakeven employment growth.” We estimate that, in the second half of 2025, breakeven employment growth of 20,000 to 50,000 jobs each month was consistent with immigration flows. That number could dip into negative territory over 2026. Reduced immigration also has modest dampening effects on GDP and will weaken consumer spending by an estimated $60–$110 billion combined over the two years.
Immigration flows in 2025 and 2026
To estimate net migration, we separately consider inflows and outflows in “low immigration” and “high immigration” scenarios. Though deportations and other exits receive more media attention, a slowdown in new arrivals, especially via humanitarian parole and refugee programs and across the Southwest border, has a bigger effect on reducing migration flows in 2025.
Our results suggest that net immigration likely ranged between –295,000 and –10,000 for 2025. For 2026, we project that net immigration will likely range between –925,000 and +185,000. In Figure 1, we compare those outcomes to net immigration since 2020, a year when immigration was constrained because of the pandemic. After reaching a roughly normal pace in 2021, immigration surged from 2022 to 2024.
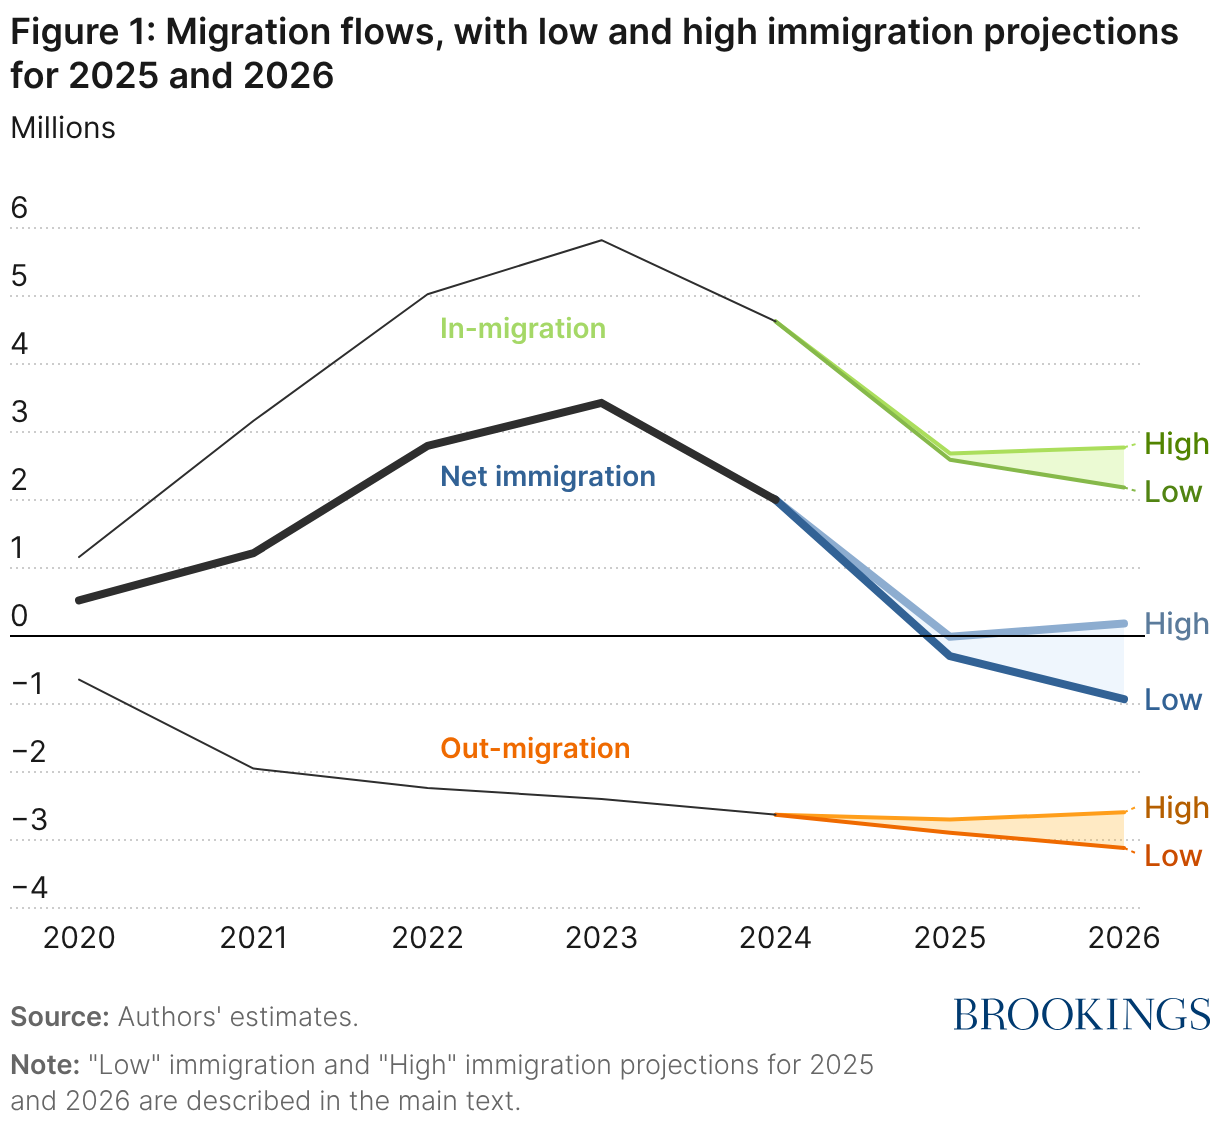
Figure 2 breaks out components of total in-migration plotted in Figure 1, including under the low- and high-immigration scenarios for 2025 and 2026. We next discuss how we arrive at those estimates.
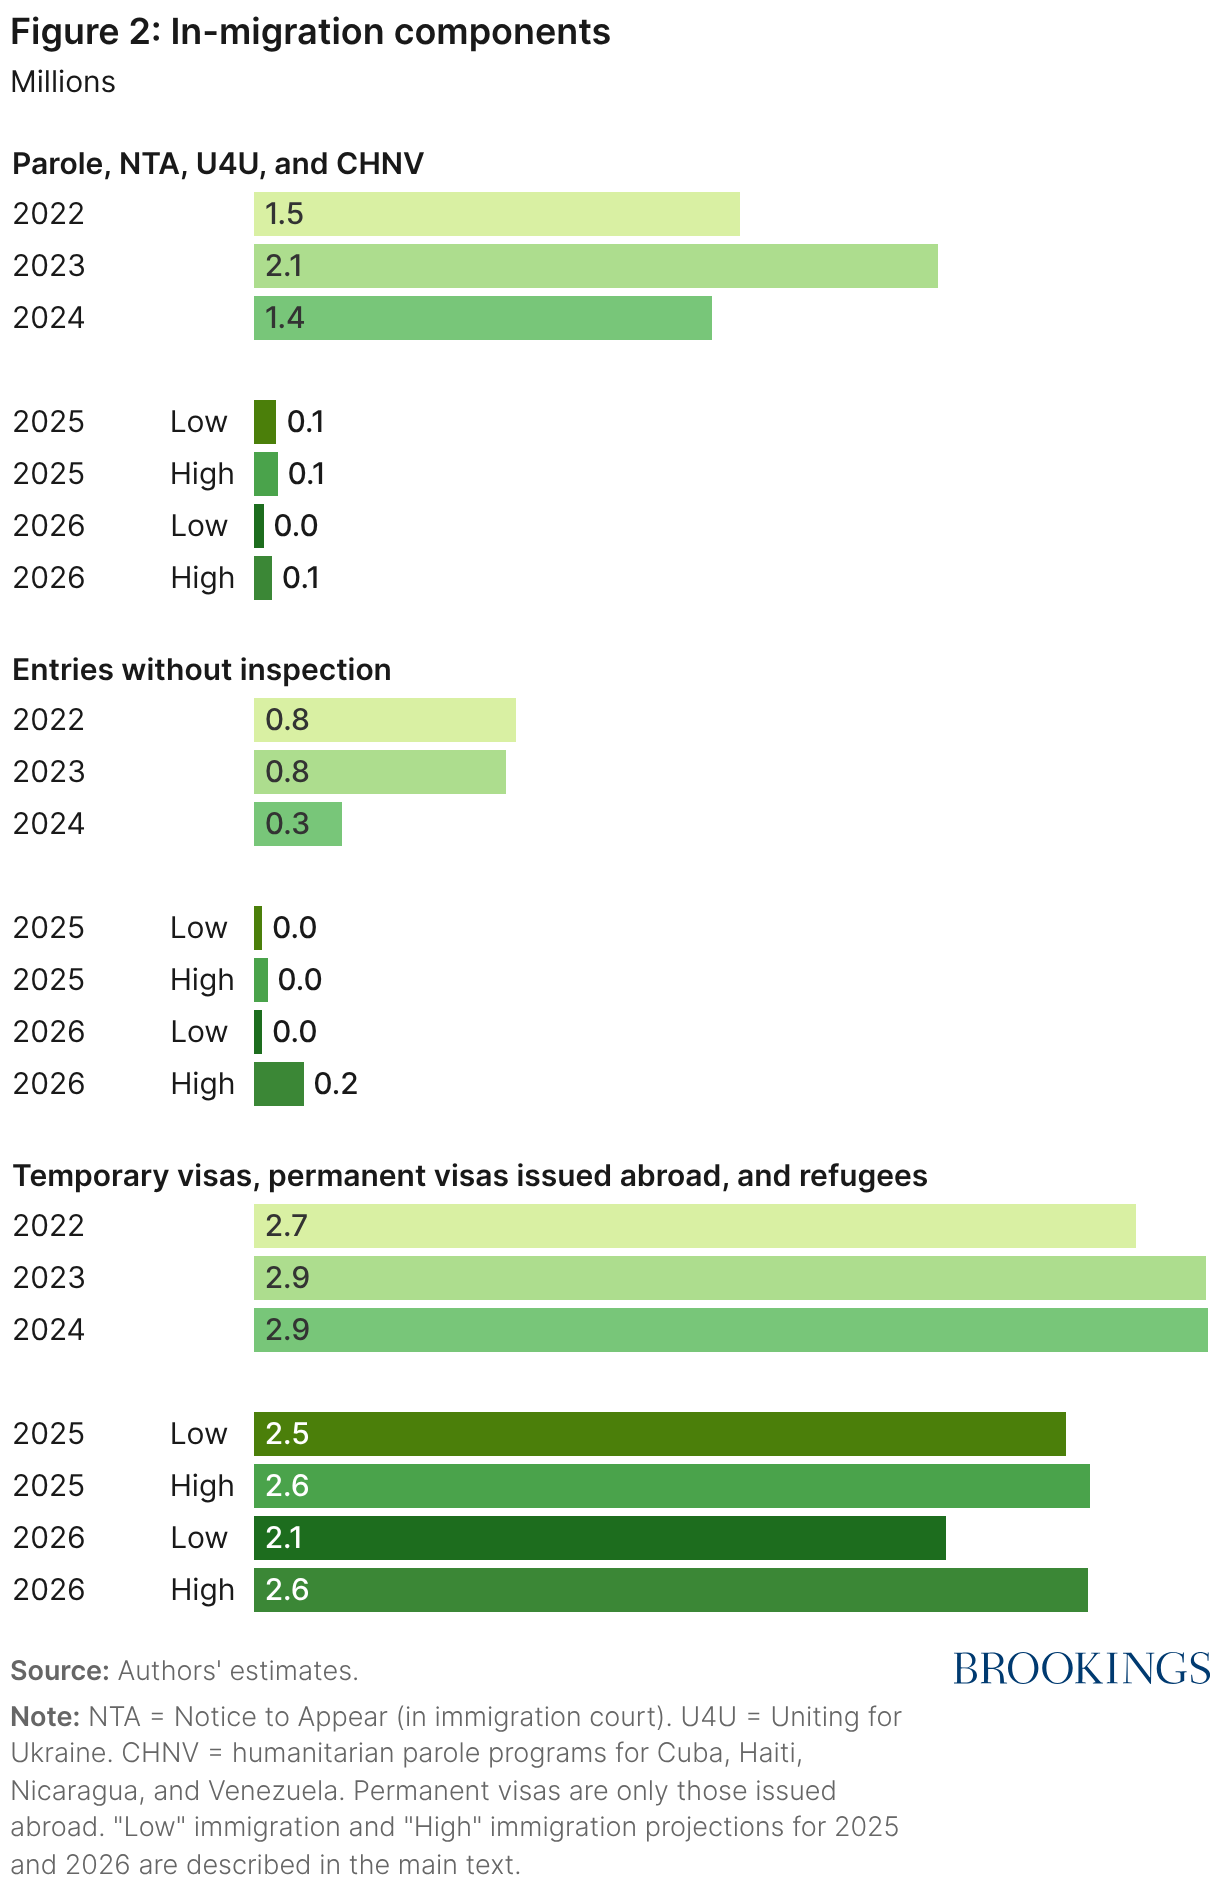
Inflows – Green cards issued abroad. The U.S. issues a variety of permanent visas—including family-based green cards, employment-based green cards, and diversity visas. Roughly half are issued to those already living in the United States. Monthly totals of green cards issued to individuals abroad are released by the U.S. State Department. The data have not been updated since May 2025. We can, however, see a marked year-over-year decline of more than 20% by May 2025 relative to May 2024. The average of April and May was 82% of the previous April and May.
We assume in the high-immigration scenario that monthly green cards issued from June through December 2025 are 82% of what they were for the same month in 2024. In the low scenario, we assume the number was further reduced to 95% of the high scenario. The resulting estimate is that there were 560,000 to 575,000 green cards issued abroad in 2025, compared to about 670,000 in 2024.
For 2026, we assume that green card inflows could continue to fall as the result of January 1 expansions in the list of countries under full or partial travel bans, increased vetting and paperwork, and other forms of sand in the gears. In the low scenario, we assume 2026 flows will reach only 87.5% of 2025 low scenario flows, or about 490,000. The travel ban is expected to affect 20% of immigrants, but for some categories of immigrants, they likely will be replaced by immigrants from other countries, so we assumed a smaller than 20% drop-off in the category. In the high scenario, we assume the total number of green cards will continue at its 2025 high level, or 575,000, reflecting the possibility that the policy will not be implemented.
Inflows – Refugees. Though some refugees were likely admitted in early January 2025, the current administration has all but suspended the refugee program, with an exception for an unknown number of white South Africans. Data on the number of refugees are no longer publicly available. We assume that the total number of refugees for 2025 was between 7,600 and 12,000 and that the 2026 number will fall to between 1,200 and 7,500. For comparison, around 105,000 refugees were admitted in 2024.
Inflows – Temporary visas. The U.S. admits a large number of people through various non-immigrant (temporary) visa programs — including student visas, temporary work visas such as the H-2A and H-1B, and a variety of others. Excluding those for short-term tourism and business, about 2.17 million non-immigrant visas were issued in 2024. Data have not been released since May 2025, but year-over-year comparison suggests a monthly slowdown. In the high scenario, we assume the April-May reduction to 89% of the prior year monthly values persists for the rest of the year. In the low scenario, the figure is further reduced to 95% of the high scenario. The resulting range is 1.94–1.99 million temporary visa inflows.
For 2026, the low scenario assumes the number will decline further to 85% of the 2025 value, reflecting travel bans and other deterrents for a range of 1.65–1.99 million.
Inflows – Parole and notices to appear. Between 2022 and summer 2024, large numbers of border arrivals at or between ports of entry were allowed to enter the U.S., often granted a temporary parole status or given a notice to appear (NTA) in immigration court. Many of these arrivals expressed fear of returning to their home country and intended to pursue an asylum claim once in the United States.
These inflows fell substantially after a change in border policy in mid-2024 and have fallen further still with the new administration’s policies. The administration has not been considering most credible fear claims which would allow people to petition for asylum. It has also eliminated Biden-era humanitarian parole programs. Border information is updated monthly, so we have a good estimate of 2025 parole/NTA inflows at around 67,000 to 70,000, with many of those in the first month of the year. For comparison, the 2024 number was 1.41 million. For 2026, we assume these border entries will remain low at 26,000 to 53,000.
Inflows – Entries without inspection. Entries without inspection (border crossers who do not encounter any official) are inherently difficult to measure. The U.S. Department of Homeland Security uses technology and information on encounters to estimate this number but has not publicly released statistics in several years. For 2024, we rely on the recently released Congressional Budget Office (CBO) estimate of 270,000, which we believe to be reasonable. Work by David Bier suggests that entries without inspection fell substantially after the end of the Title 42 public health restrictions in 2023, with more people instead encountering an official and often receiving a parole or notice to appear.
In 2025, the number of people encountering a border official fell dramatically, despite increased patrolling. This implies a sharp slowdown in the number of attempted border entries. Using a historical ratio (from 2015 to 2019, or just 2019) of encounters to estimated entries without inspection, we estimate 2025 entries without inspection to be between 22,000 and 39,000. For 2026, we believe this number could potentially increase in the high scenario given elevated geopolitical uncertainty and innovation in smuggler networks. For 2026, we assume a range of entries without inspection of 22,000 to 150,000.
Figure 3 breaks out components of total out-migration plotted in Figure 1, including under the low- and high-immigration scenarios for 2025 and 2026. We discuss how we arrive at those estimates next.
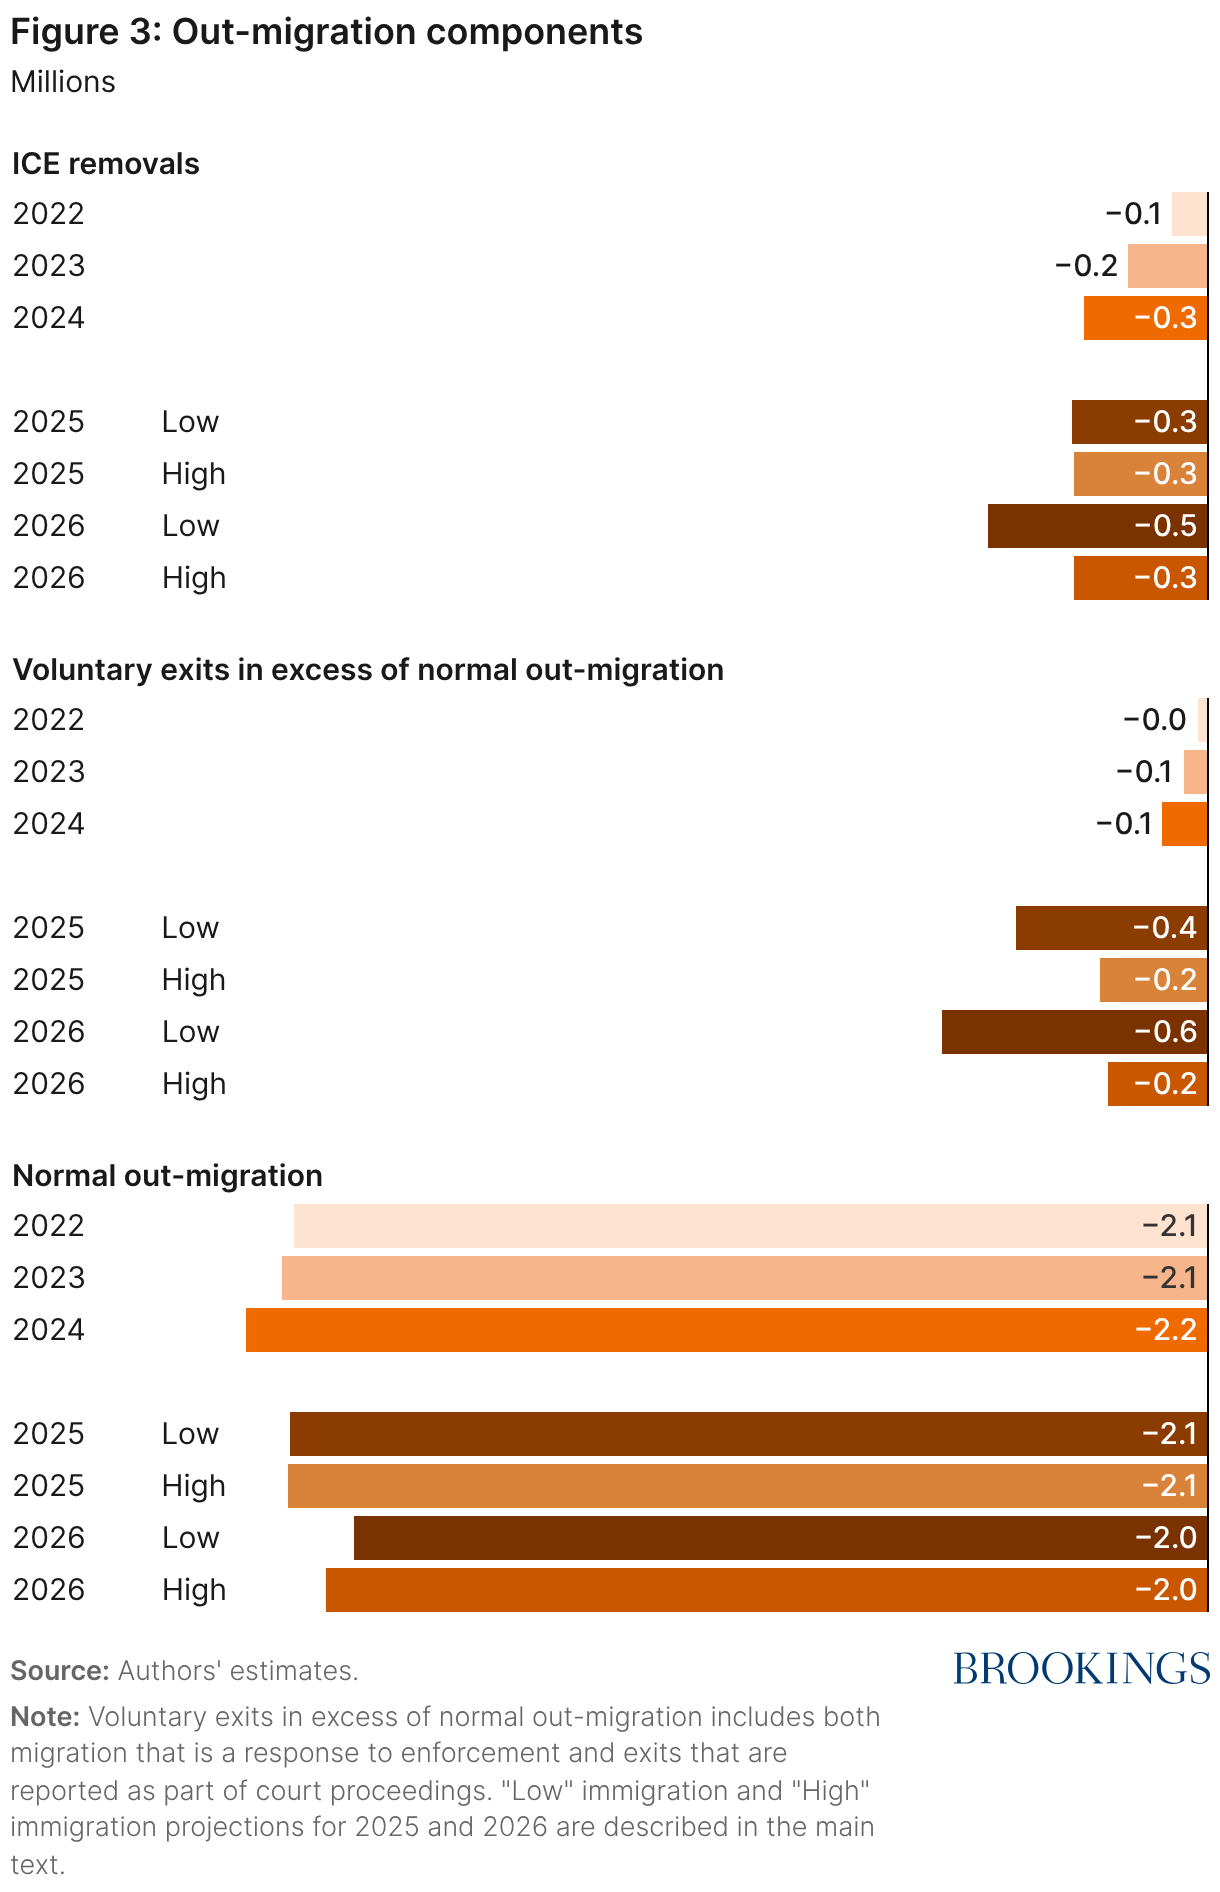
Outflows – Normal out-migration. Outflows are harder to measure than inflows. Detailed statistics are not kept on those who leave, especially those who exit across a land border. We assume that immigrants who have stayed in the country more than two years and newly arrived green card holders and refugees have an annual baseline outmigration rate of 2.5%, an estimate informed by examining cohorts in the American Community Survey and research using tax records. Given their more precarious status, we assume recent arrivals with a notice to appear in immigration court or parole have an exit rate of 3%, and recent entries without inspection a rate of 4%. Recently arrived temporary visa holders are assumed to leave at a rate of 20%, reflecting the fact that almost all temporary visa holders transition to another legal status or exit according to the terms of their visa. By assumption, the level of normal outflows is mechanically reduced when the foreign-born population shrinks and when a smaller fraction of the foreign-born population has arrived within the last two years.
Outflows – Removals. Though official data is less available than in the past, we use information through July from the Deportation Data Project and data through November from U.S. Immigration and Customs Enforcement (ICE) detention management reports. We estimate 310,000 to 315,000 removals for 2025. This estimate is lower than some public statements from the administration, as discussed below, potentially in part because it is limited to border and interior removals executed by ICE.
Information provided by the Deportation Data Project makes it possible to have a consistent monthly removal series over time. The dataset excludes noncitizens processed for expedited removal or voluntary return without entering ICE custody; those excluded are largely border encounters leading to immediate removal, which would not have been considered entries in our analysis. Border encounters transferred to ICE are included. From January to July, removals reported in the Deportation Data Project are 87% of those reported in the ICE detention management reports. As a result, to generate a consistent estimate for removals from August through November, we infer monthly removals from ICE detention management report updates and multiply by 87% to make the two sources more comparable. Then, we estimate that removals in December are the same as in November or 10% higher.
At 310,000 to 315,000, the 2025 removals are not much higher than the 2024 removals of around 285,000. The nature of these removals has changed, however. In fiscal year 2024, only 18% of ICE removals were initiated by ICE as opposed to U.S. Customs and Border Protection, meaning the vast majority of ICE deportations were of recent border crossers. Comparable statistics have not been released for 2025, but it is clear from border statistics and other evidence that most removals in 2025 were from the nation’s interior.
For 2026, we assume removals will again be around 310,000 or will increase. Our low-immigration scenario assumes that about 510,000 individuals will be deported in 2026, consistent with a daily removal rate of around 1,400 people. This scenario suggests amplification beyond the second half of 2025 when the average was just under 1,000 per day. Funding in the One Big Beautiful Bill Act will likely allow for increased infrastructure and staffing to achieve a higher level of enforcement in 2026.
Outflows – Voluntary response to enforcement. Immigrants may respond to the enforcement environment even if they are not formally removed. For example, some immigration court cases end in “voluntary departure,” which carries fewer long-run penalties than an official removal. Using data from the Transaction Records Access Clearinghouse, we see that there were around 40,000 such court resolutions in 2025, compared to around 10,000 in 2024.
In addition, immigrants may choose to leave the United States if a family member is deported or may decide that leaving is a better option than risking detention or permanent family separation. Even those with legal status may choose to exit in a high-enforcement environment to avoid harassment or to find a more welcoming community. For example, graduating students may choose another global destination. At the same time, some may choose to avoid leaving the United States because of fears that there will be no means of re-entry, as is believed to have been the response during the 1990s increases in border enforcement.
There is little data to assess the degree to which immigrants have increased their voluntary exit rates in 2025 in response to the policy environment. Given the very different context from the circular migration common in the 1990s, our assessment is that greater border and interior enforcement will cause more out-migration. We assume proportional responses to deportations based on immigrant category, with those without legal status and recent arrivals more likely exit in response to enforcement. Our estimates suggest that between 210,000 to 405,000 left voluntarily in 2025 beyond what would have been normally expected without enforcement activity. For 2026, that number could reach 575,000 if the number of removals continues to increase.
Contrasting estimates of net migration in 2025
Our estimate of net migration of –295,000 to –10,000 for 2025 differs from some other prominent estimates. The most recent version of the CBO demographic estimates, released in January 2026, suggests net migration of around +400,000 for 2025. The CBO estimate includes fewer deportations than our estimate, and CBO also assumes voluntary out-migration falls in response to increased enforcement activity, whereas we assume it rises. Our midpoint estimates are about 550,000 lower than those of CBO.
Other estimates are much more negative than our own, notably those using Current Population Survey (CPS) data to examine the foreign-born population. For example, the CPS has been used by the Center for Immigration Studies and the Pew Research Center to estimate a decline in the foreign-born population of around 2 million. (Note that net immigration is not directly comparable to the change in the foreign-born population because the population figure also includes mortality, but this population number implies negative net migration of at least 1.5 million.)
However, as detailed by Jed Kolko and in forthcoming work by some of the authors of this piece, the CPS should not be used to infer anything about population levels. By construction, the CPS methodology uses pre-determined fixed “population controls.” The population levels for each month of 2025 in that survey were projected in late 2024, as were subpopulations by race/ethnicity and age, before it was known what would happen to immigration flows. The same CPS data that underlie the foreign-born population decline of 2 million, therefore imply an implausible rise in the U.S.-born population of more than 2 million (because the pre-determined overall population growth is positive). The CPS challenges are compounded by increased survey non-response which likely disproportionately affects immigrants in the current policy environment. Given the many issues with the CPS data (and indeed a warning from Census against using the CPS to estimate the size of the foreign-born population), we believe the analyses using the CPS substantially overstate the drop in the foreign-born population and therefore imply net migration that is also too far in negative territory.
A December 2025 U.S. Department of Homeland Security announcement claimed 2.5 million illegal aliens left the United States in 2025. This number is the sum of what is likely an estimate based on the CPS data (1.9 million) and a measure of removals (622,000). As noted above, the population estimates using the CPS are flawed. Even if correct, they involve the total foreign-born population of both legal and undocumented immigrants. They would also reflect deaths and both voluntary out-migration and forced departures. There would therefore be no reason to add a measure of removals to the estimated CPS population decline. Finally, the measure of removals used in this news release is nearly double that in ICE’s FY 2025 and FY 2026 detention statistics, suggesting the removal statistic cited may include rapid border removals and other enforcement activity not involving ICE. This announcement should not be considered a serious source for an estimate of net migration.
Labor market impacts
Our estimates of migration inflows and outflows have direct implications for labor force growth and job creation. Following our approach from previous work, in this section, we estimate the rate of employment growth that is consistent with full employment for each of our scenarios.
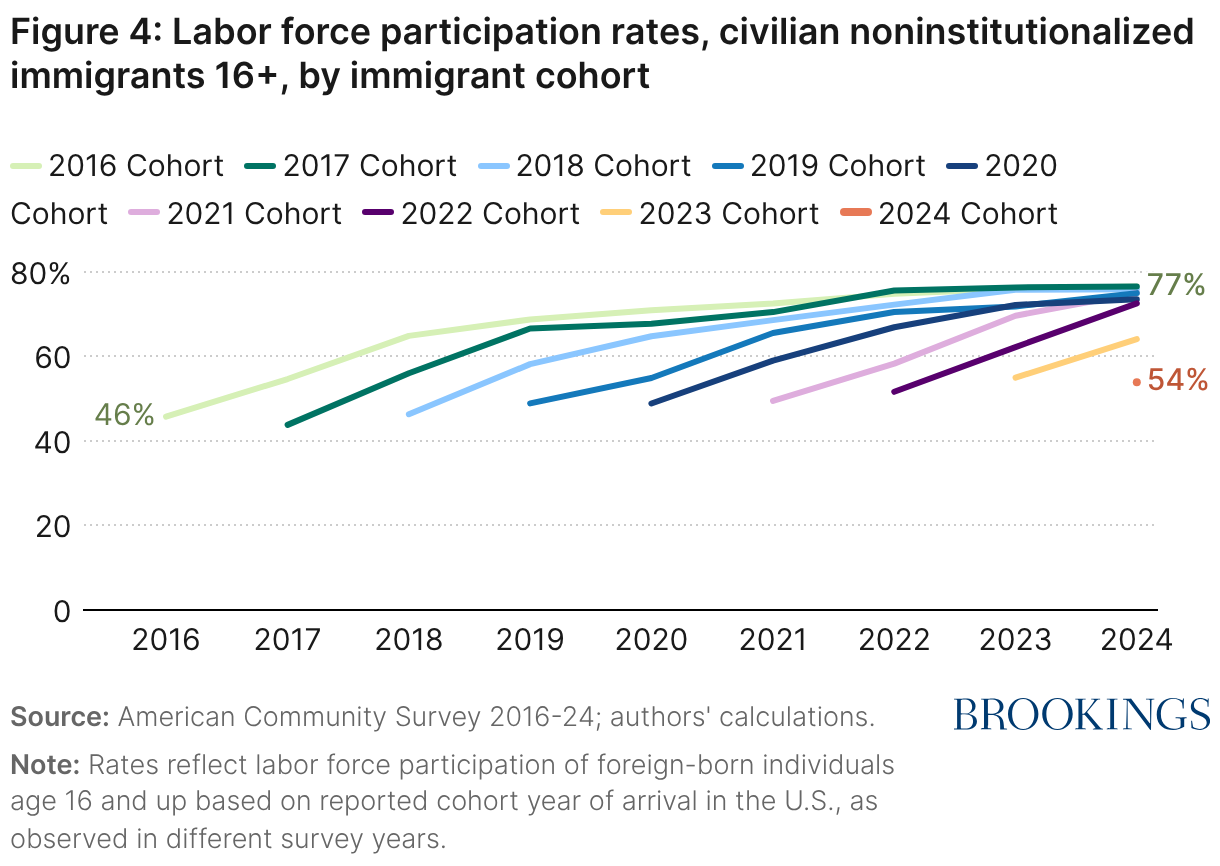
In a typical year, new immigrants do not all enter the labor force immediately. For that reason, the immigration surge in 2022, for example, continues to boost the size of the labor force in 2023 and 2024. That pattern is shown in Figure 4 using survey data through 2024. Interestingly, the most recent immigrant cohorts appear to have higher initial labor force participation rates such that the boost to the labor force happens more quickly.
That pattern appears to have been further disrupted in the first part of 2025. A sharp increase in work permit applications from January to April suggests a surge in interest in labor force participation among recent immigrants. Reflecting that, we assume a relatively quick ramp-up of labor force participation among immigrants in early 2025. For immigrants who arrive in the U.S. in the middle of 2025, we assume that the protracted increase in labor force participation happens as in prior years. This is consistent with the approach reflected in the bottom panel of Table 2 in our 2025 AEI Economic Perspectives paper.
Table 1 shows our estimates of monthly employment growth consistent with full employment. As the first few rows of Table 1 show, monthly potential employment growth from 2022 to 2024 was well over 100,000 and by some estimates in 2022 and 2023 close to or even above 200,000. On average, potential employment growth remained above 90,000 during 2025, but the full-year average masks a significant decline over the course of the year.

If we look solely at the second half of 2025, we estimate the rate of job growth consistent with full employment to have been 20,000 to 50,000 in both of our scenarios. Monthly non-farm payrolls as reported by the Bureau of Labor Statistics were just modestly below these estimates. With the caveat that the October–November government shutdown affected data collection, non-farm payroll growth averaged around 14,500 in the second half of the year. Over that same period when employment growth was modestly below our estimate of potential employment growth, the unemployment rate has risen by 0.3 percentage points.
Looking toward the current calendar year, 2026, we expect the decline in potential employment growth caused by changes to immigration policy to persist. In our low-immigration scenario, monthly growth for the year will average between –20,000 and +20,000 jobs. In our high-immigration scenario, we expect payrolls consistent with full employment to average between 10,000 and 50,000 jobs. These numbers are (even) lower than those of the second half of 2025 and dramatically below those of 2022 through 2024.
Effects on consumer spending and GDP
As in our previous analyses, we can translate our estimates of labor force growth into effects on consumer spending and GDP growth. For short-run GDP growth to change due to a reduction in net migration, labor force growth and earnings need to change. The direct effect on GDP growth owing to less output created by immigrants is roughly 0.2 percentage points in 2025 and 0.1 percentage point in 2026. Those estimates are shown in the top row of Table 2.
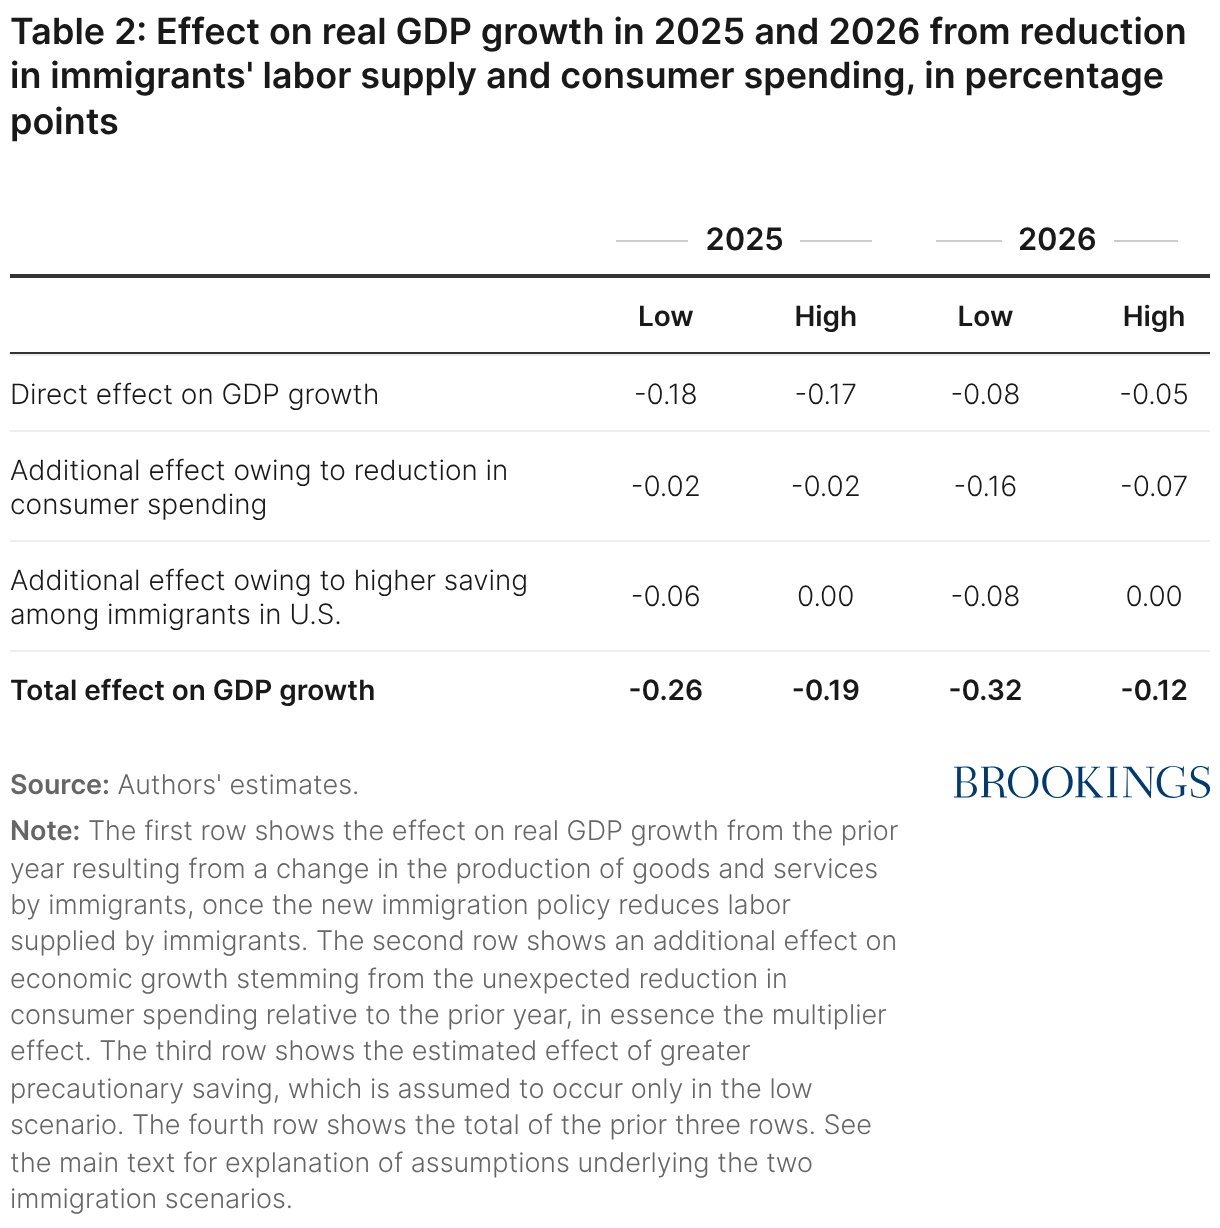
In addition to those direct effects, the reduction in consumer spending by immigrants also further dampens GDP growth. In our assessment, the reduction takes businesses by surprise; in response, those businesses take actions, such as laying people off, which have knock-on effects in reducing GDP.
Consumer spending is dampened for two reasons. First, fewer immigrants are in the U.S. and therefore are not spending in the U.S. Second, we expect that when immigration enforcement is very salient, immigrants who remain in the U.S. pull back on their spending because they are more uncertain about the future and may minimize going into public for shopping or leisure. Those effects on GDP do not happen immediately, so to some degree, reductions in consumer spending in 2025 continue to dampen GDP growth in 2026.
The reductions in aggregate consumer spending that result from the change in immigration policy are significant in dollar terms. We estimate that the factors that lower consumer spending by immigrants result in between $40 billion and $60 billion less spending in 2025 than in 2024. In 2026, consumer spending is projected to be further reduced by $10 billion to $40 billion. Those are useful estimates to keep in mind as some businesses report unexpected weakness in consumer demand.
All told, we estimate that the reductions in labor supply and consumer spending from changes to immigration policy affected GDP growth in 2025 by between –0.2 percentage point (high scenario) and –0.3 percentage point (low scenario). For calendar year 2026, the effect will be between –0.1 percentage point (high) and –0.3 percentage point (low). An implicit assumption here is that the Federal Reserve does not loosen monetary policy in response to the lower potential employment growth that results from reduced immigration.
Finally, the effects of the current immigration policy on inflation are likely small. That is because immigration does not just add to labor supply but to demand as well. Businesses experience a reduction in net immigration both as a reduction in labor supply and as a reduction in demand for their goods and services.
Conclusion
Our analysis suggests that the United States experienced negative net migration in 2025 for the first time in at least decades. We estimate net flows of –295,000 to –10,000 for the year. Though a high degree of policy uncertainty remains, continued negative net migration for 2026 is also likely. The slowdown implies weaker employment, GDP, and consumer spending growth.
There has been much speculation about how immigration policy might be affecting the strength of the labor market and the economy, as well as price and wage inflation, and how monetary policy should respond. According to our estimates, employment growth may remain quite weak relative to historical trends. Breakeven monthly employment growth is estimated at 50,000 or less and could well turn negative in 2026. The unemployment rate will be a better read of whether the labor market is weak owing to business cycle forces that monetary policy can address or simply owing to more constrained immigration.
Certain parts of the economy will see unexpectedly weak economic activity, such as businesses that serve part of the affected immigrant population. Such weakness is the new normal under current immigration policy, rather than weakness reflecting adverse business cycle conditions. As the economy adjusts, more accommodative monetary policy should be used cautiously.
Related Content
2026


Authors


-
Acknowledgements and disclosures
Wendy Edelberg and Tara Watson are senior fellows in economic studies at the Brookings Institution, where Watson directs the Center for Economic Security and Opportunity. Stan Veuger is senior fellow in economic policy studies at the American Enterprise Institute. The authors thank Shantanu Kamat, Eileen Powell, Johnny Willing, and Jonathon Zars for excellent research support, and Mark Greenberg for helpful feedback. We also benefited from valuable conversations with David Bier, Kristin Butcher, Chris Foote, and Jed Kolko.
The Brookings Institution is committed to quality, independence, and impact.
We are supported by a diverse array of funders. In line with our values and policies, each Brookings publication represents the sole views of its author(s).