This analysis is accompanied by a data interactive that allows users to select and compare proficiency data for each state by the subject and grade cohort: “Learning curves: Post-COVID learning trajectories by cohort, subject, and state.”
It has been almost six years since the COVID-19 pandemic led to widespread school closures in the United States. While some research indicates that students have partially recovered from stark pandemic-related drops in test scores, students today continue to perform at considerably lower levels than pre-pandemic cohorts. The 2024 National Assessment of Educational Progress (NAEP) found historic lows in math and English scores for 12th grade students and declines in both subjects for fourth and eighth graders relative to 2019.
While the COVID-19 shock was widespread, its effect on student learning was not uniform. Across the U.S., there was variation in school closures, the timing of return to in-person learning, and the extent of hybrid learning, both the time spent learning remotely and its effectiveness. Furthermore, schooling during this period was both novel and particular for each child because each child’s home circumstances, learning environment, facility with technology and tools, teacher(s), engagement, and absenteeism, among other things, were different. A child’s age and grade mediated these differences.
Research has explored how the pandemic impacted student learning along different dimensions, including differential effects by time spent in virtual or hybrid learning environments, by student characteristics including prior achievement, socioeconomic status, and race/ethnicity, and by community characteristics. There has been little research, however, on whether the grade level (i.e., kindergarten through 12th grade) during which a student experienced the pandemic disruption influenced the extent of learning loss and subsequent remediation.
The grade(s) during which a student experienced COVID-related disruptions could affect student learning curves because—in addition to the unique learning circumstances for each child during this period—students build on prior knowledge, learn new material, develop skills, and grow with each day and with each successive grade in school. Changing proficiency rates over the course of schooling could also reflect changing standards or tests, differential attrition out of public schools, or learning loss.
In this analysis, we follow cohorts of students over time to see if trajectories in proficiency rates in math and English Language Arts (English) differ before and after the pandemic based on the grade a student was in when they experienced COVID-era disruptions. For example, we ask: Is the proficiency rate trajectory for students who were in kindergarten during the 2019–20 school year different from students who were in fourth grade or different from students who were in kindergarten before the pandemic?
To answer these questions, we follow cohorts of students from third through eighth grade from the 2015–16 school year through the 2024–25 school year to establish proficiency trajectories in math and English. The below analysis is limited to the 28 states that did not change their standardized tests over this time period and for whom we have data through the 2024–25 school year. We track test scores for four cohorts for whom we observe test scores both before and after the 2019–20 school year (fourth through seventh graders) as well as four cohorts who were in K–3 in 2019–20 and for whom we can only observe proficiency rates from the 2020–21 school year onward.
This analysis is accompanied by a data interactive that allows users to see these proficiency trajectories for each COVID-impacted grade in English and math for every state, including those excluded from this analysis. In the appendix we show the analysis using all 50 states and D.C. as well as for the 31 states and D.C. that did not change their tests through the 2023–24 school year.
We find that the older the student was in the 2019–20 school year, the lower the subsequent proficiency rate trajectory. This pattern is more consistent in math than in English, as proficiency rates in English converge across cohorts in higher grades.
COVID disruptions caused pervasive and disparate learning loss
The term “learning loss” has generally been used in reference to students losing proficiency on material they have already learned, particularly over time periods when school is out of session, like summer breaks. Since the pandemic, the term has been used to refer to a decline in test scores relative to what students would have been expected to learn in the absence of the pandemic.
Quantifying learning loss over this period requires modeling how student outcomes would have changed if the pandemic had not happened, i.e., the counterfactual. Most studies construct this counterfactual from pre-pandemic test scores, using proprietary computer adaptive tests or state proficiency rates with restricted samples to improve comparability over time. Others use state standardized tests for grades three through eight, standardized across time and state using NAEP. Across samples and tests, researchers find that pandemic-induced disruptions had severe impacts on student test scores, with greater learning loss in math than in English.
The decline in performance was widespread across the U.S., but research also indicates that these declines varied greatly by school district and mapped onto and exacerbated existing disparities. Much of the variation in loss across districts was explained by differences in school modality in the 2020–21 school year. School districts with higher concentrations of low-income, Black, and Hispanic students had larger declines, as these schools had both more time not in-person and larger learning losses associated with virtual schooling modality. In the aftermath of the pandemic, performance gaps between Black and white students, Hispanic and white students, high- and low-income students, and high- and low-achieving students have continued or grown. Other community-level factors—like broadband access or disruptions to economic activity—were related to student performance but were not strong independent predictors of learning loss.
While the literature is clear that differences in virtual schooling drove differences in test score losses, a less-studied dimension of variation is how COVID-related disruptions and learning environments affected students at different ages. A small number of studies disaggregate learning loss by grade. Jack et al. (2023) find that schooling mode (the share of the 2020–21 year spent in-person, hybrid, or virtual) explained more of the variation in state proficiency rates for younger grades; offering in-person or hybrid learning, relative to virtual learning, reduced losses in pass rates by more for grades 3–5 than grades 6–8, on average. Goldhaber et al. (2022) similarly find that early elementary students demonstrated more loss on NWEA MAP scores relative to middle schoolers; the score distribution of younger students in 2021 was shifted lower than its pre-pandemic distributions.
Other research compares the trajectories of pre- and post-COVID cohorts. Lewis and Kuhfeld (2023) compare NWEA MAP scores of six post-pandemic cohorts across grade level in 2020–21, 2021–22, and 2022–23 to comparable students who tested in 2016–17 through 2018–19. The authors find that achievement gaps between pre- and post-pandemic cohorts increased in 2022–23 for all but the youngest cohort of students (those who began first grade in 2020–21). Young and Young (2024) construct similar pre- and post-pandemic counterfactuals: They create five longitudinal cohorts who began K–4 post-pandemic and match each to a pre-pandemic counterfactual based on grade. In contrast to Lewis and Kuhfeld, the authors find a greater gap in growth relative to pre-pandemic cohorts on the Curriculum Associates i-Ready Diagnostic Test for students who began the 2021–22 school year in kindergarten or first grade. While these studies don’t explicitly test what mediates differences in learning across ages, Young and Young reference several potential explanations from the literature, including differences in responses to virtual instruction, the age of which students develop foundational skills, and the timing of targeted interventions.
Our approach: Did COVID disruptions’ impact on proficiency trajectories depend on the grade a student was in during the 2020–21 school year?
A key feature of the existing research on cohort-based learning loss is that the research observes a baseline group of students with test scores measured exclusively prior to the pandemic and compares them to students with only post-pandemic test scores. Post-pandemic cohorts are defined by their grade level after the pandemic and matched to a cohort that began that same grade in a recent pre-pandemic period.
Our approach differs in how we measure pandemic-impacted cohorts, when we observe them, and to whom we compare them. Throughout this analysis, our pre-pandemic counterfactual will include test scores from the 2014–15 through 2018–19 school years, but we track pandemic-impacted cohorts across the pandemic, using pre-pandemic test scores from 2016–19 and post-pandemic test scores from 2020–21 onwards. 2019–20 tests were not administered due to the pandemic.
We ask: Did the effect of COVID-related disruptions differ depending on the grade a student was in during the 2019–20 school year? Figure 1 illustrates how we track students across the pandemic as they age and enter new grades with the cohort of students in fourth grade during the pandemic (2019–20). Rather than tracking fourth grade test scores each year (purple line), we follow fourth graders from 2019–20 as they complete post-pandemic tests in fifth through eighth grade (green dots in panel A; broken out and connected as the green line in panel B). The gap in the lines in this figure is due to the fact that testing did not occur during the 2019–20 school year.
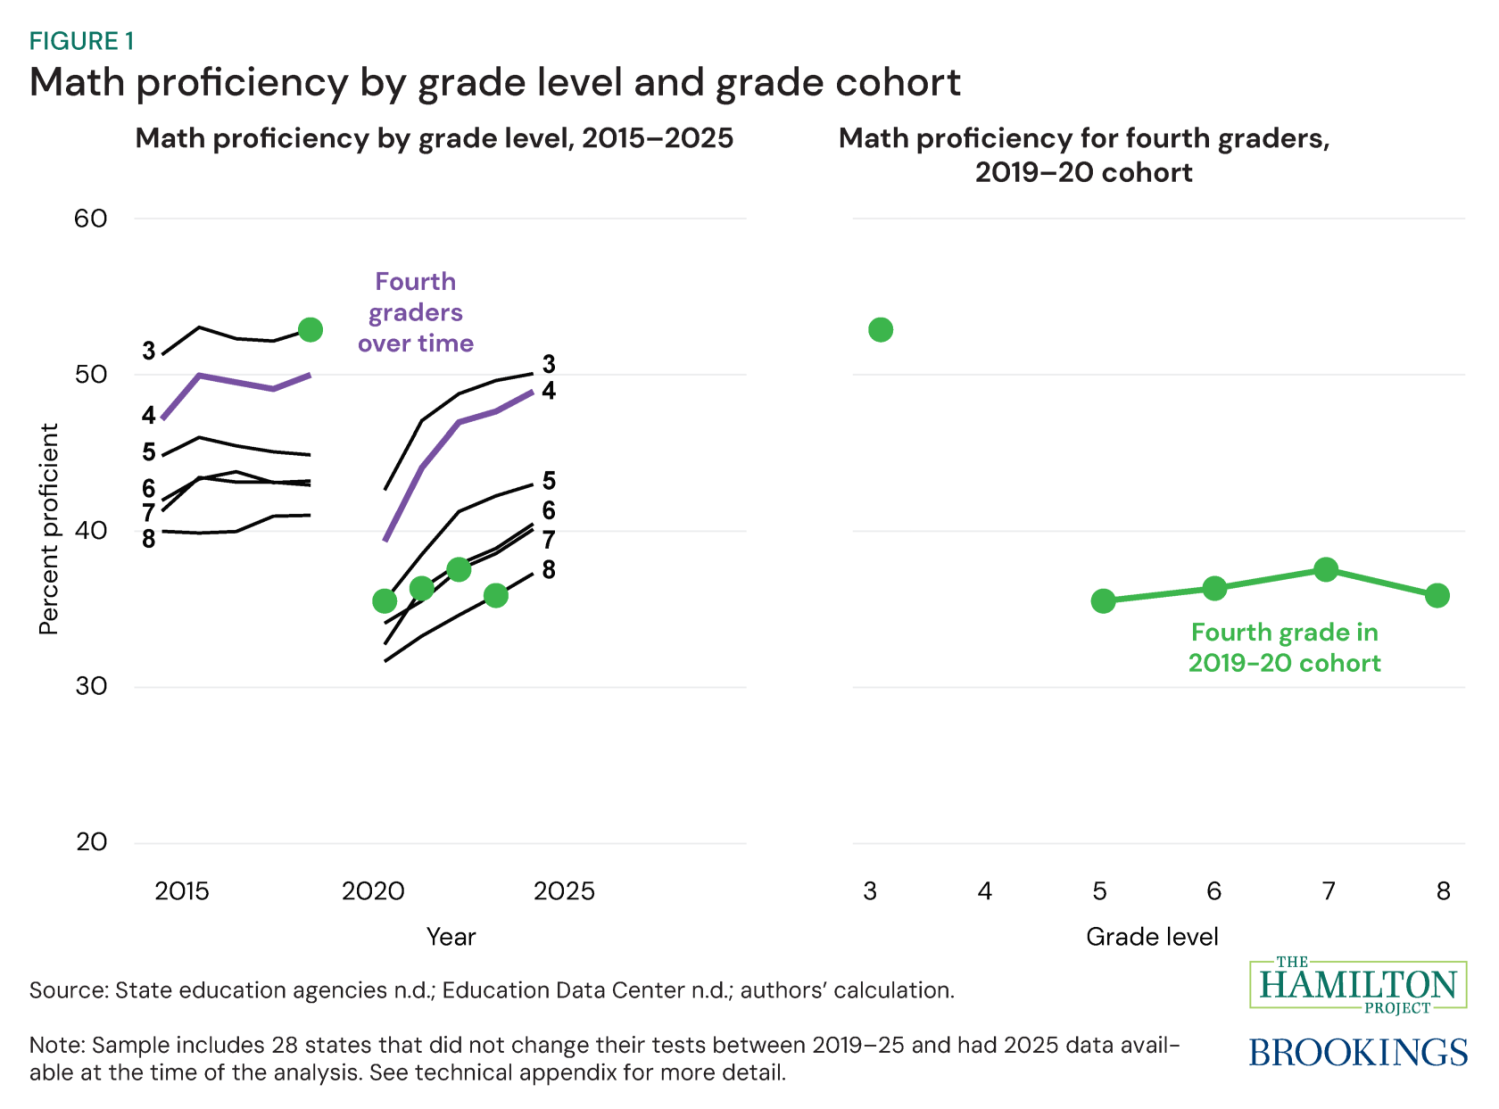
In panel A of figure 1, each line represents the proficiency rate of a grade level—third grade through eighth grade. Research that compares outcomes using this structure involves tracking a given grade over time by observing different groups of students each school year.
This is not our approach. In this analysis, we want to study students who experienced a shock during a given grade and follow them over time. This means that we study students who were fourth graders in 2020 as they progress through fifth grade through eighth grade rather than fourth grade each year, following these students as they move from fifth grade to sixth grade to seventh grade. The green dots in panel A represent students who were in fourth grade during the 2019–20 school year. Panel B connects the observations of these students from third through eighth grade to produce the proficiency rate trajectory, i.e. the learning curve, for the fourth grade cohort.
The green dots in panel A and panel B of figure 1 illustrate our approach with only one cohort. In the following analysis, we assess whether the timing of the COVID shock matters for the math and English trajectories of every affected cohort using proficiency data from state standardized tests for third through eighth graders from 2015–25 for the 28 states that did not change their tests.
Post-COVID learning curves in math
To assess whether and how post-COVID proficiency trajectories are different from pre-COVID, one must identify counterfactuals, i.e., the trajectory that could have plausibly occurred in the absence of the pandemic. For our analysis, we compare the trajectory of each pandemic-impacted cohort to three plausible counterfactuals, shown in figures 2, 3, 5, and 6.
- Counterfactual 1 (light blue): The cohort learning curve for eighth graders in 2019–20. This is the most recent cohort for which we observe pre-COVID tests in grades three through seven;
- Counterfactual 2 (gray): The combined pre-pandemic cohort learning curve. This is the average proficiency rate of all cohorts we observe from 2015–19. This average includes any pre-pandemic data we observe for pandemic-impacted cohorts. This includes those that are older than the treatment cohort we are observing: For example, the counterfactual for our fourth-grade pandemic cohort includes pre-pandemic data from students who were in grades five and six during the pandemic. This counterfactual will be slightly different for each cohort as the number of pre-pandemic observations for pandemic-impacted cohorts varies by grade; and,
- Counterfactual 3 (dark blue): The average proficiency rate for each grade level during the 2018–19 school year. This is not a cohort-based approach and instead shows the most recent pre-COVID proficiency level in each grade.
Figure 2 shows the COVID-affected fourth grade cohort (the exact same green line as in figure 1B) in comparison with the three counterfactuals. With three distinct approaches to developing a counterfactual, the pre-COVID counterfactuals in math all show a similar trend. The two counterfactuals that we observe for all grade levels show a gradual 12 percentage point decline in proficiency rates from third grade (around 53 percent proficient) to eighth grade (around 41 percent proficient). That all three counterfactuals (and the pre-pandemic trajectories for students affected by COVID later on) show a similar trajectory strengthens the case that they describe what plausibly would have happened if the pandemic had not.
However, the COVID-affected fourth grade cohort learning curve looks quite different: While the pre-COVID third grade test score is at the high end of the pre-pandemic cohorts (it is the exact same observation as the 2018–19 school year for third grade), the first post-COVID observation (fifth grade) is about 10 percentage points (21 percent) below the pre-pandemic rates and remains at about 36 to 38 percent proficient through eighth grade. Math proficiency rates fell for the fourth grade cohort by more than 17 percentage points from 2019 to 2021; but, once we correct for the pre-pandemic trend (a decline of about 7 percentage points from third to fifth grade), our estimate of loss due to COVID is closer to 10 percentage points.
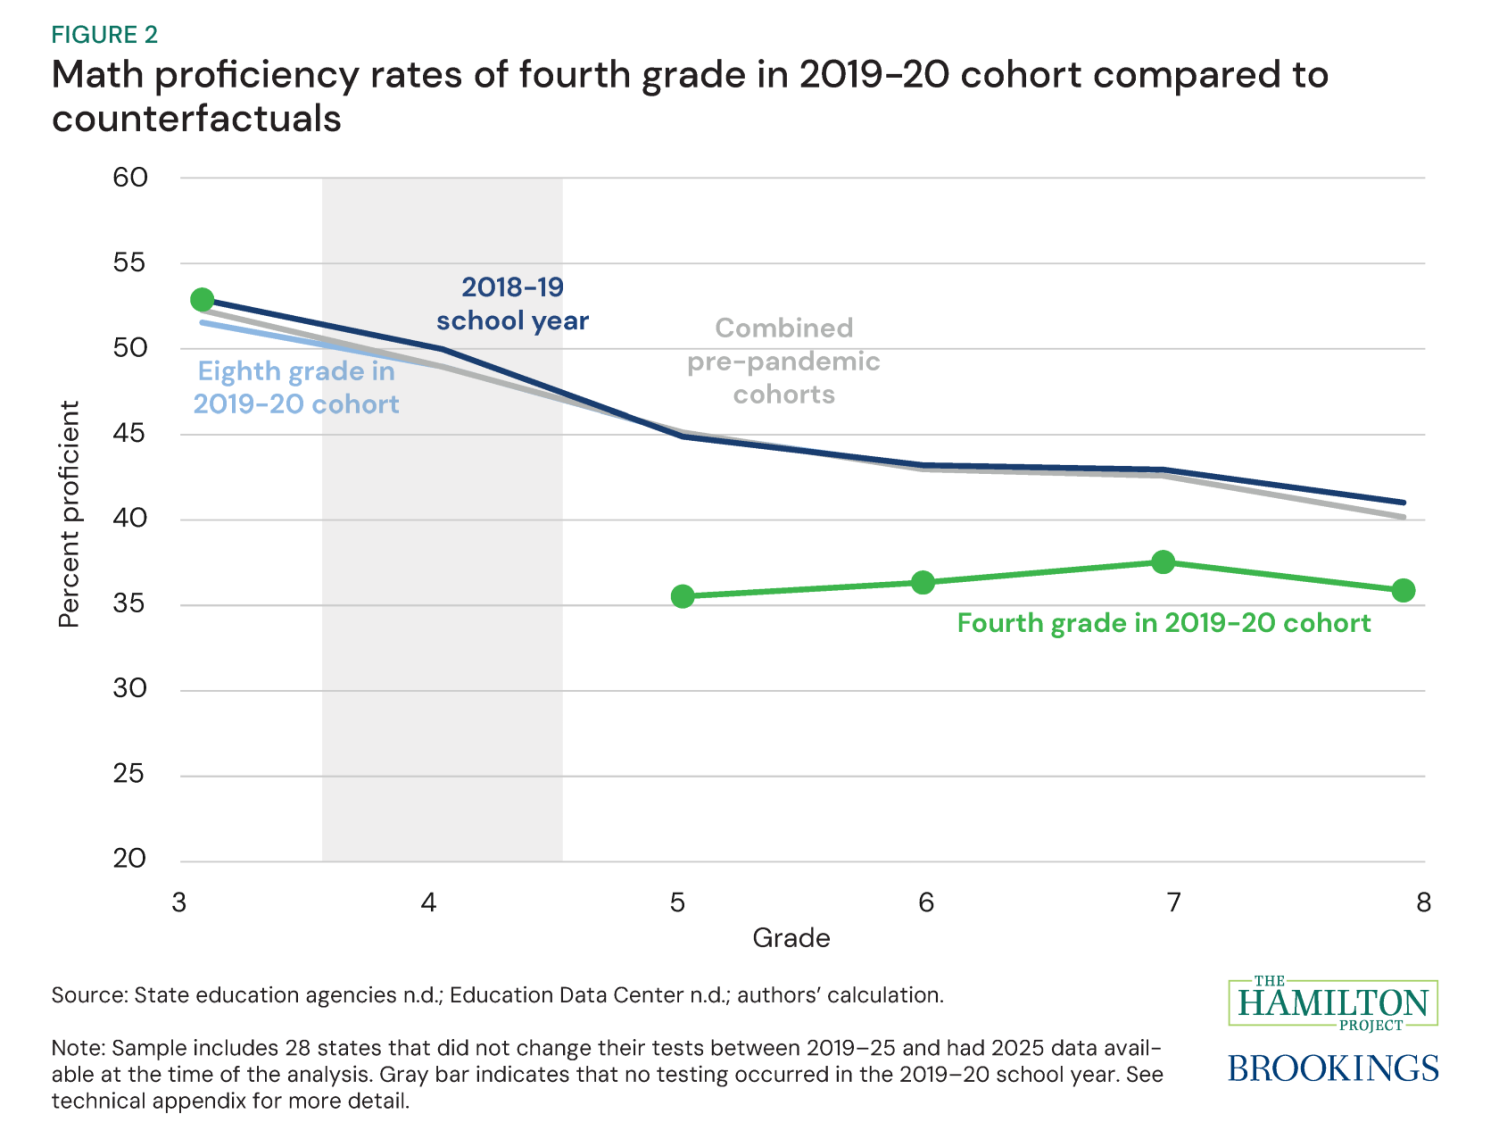
Figure 3 repeats the exercise in figure 2 for every pandemic-affected grade cohort. The two blue counterfactual lines (2018–19 school year scores and eighth grade in 2019–20) are the same in each figure, the gray combined counterfactual varies for each grade level cohort. This figure underscores a key feature of this analysis: The pandemic did not disrupt all students at the same point—older students had years of pre-pandemic learning, while younger cohorts began elementary school with disruption.
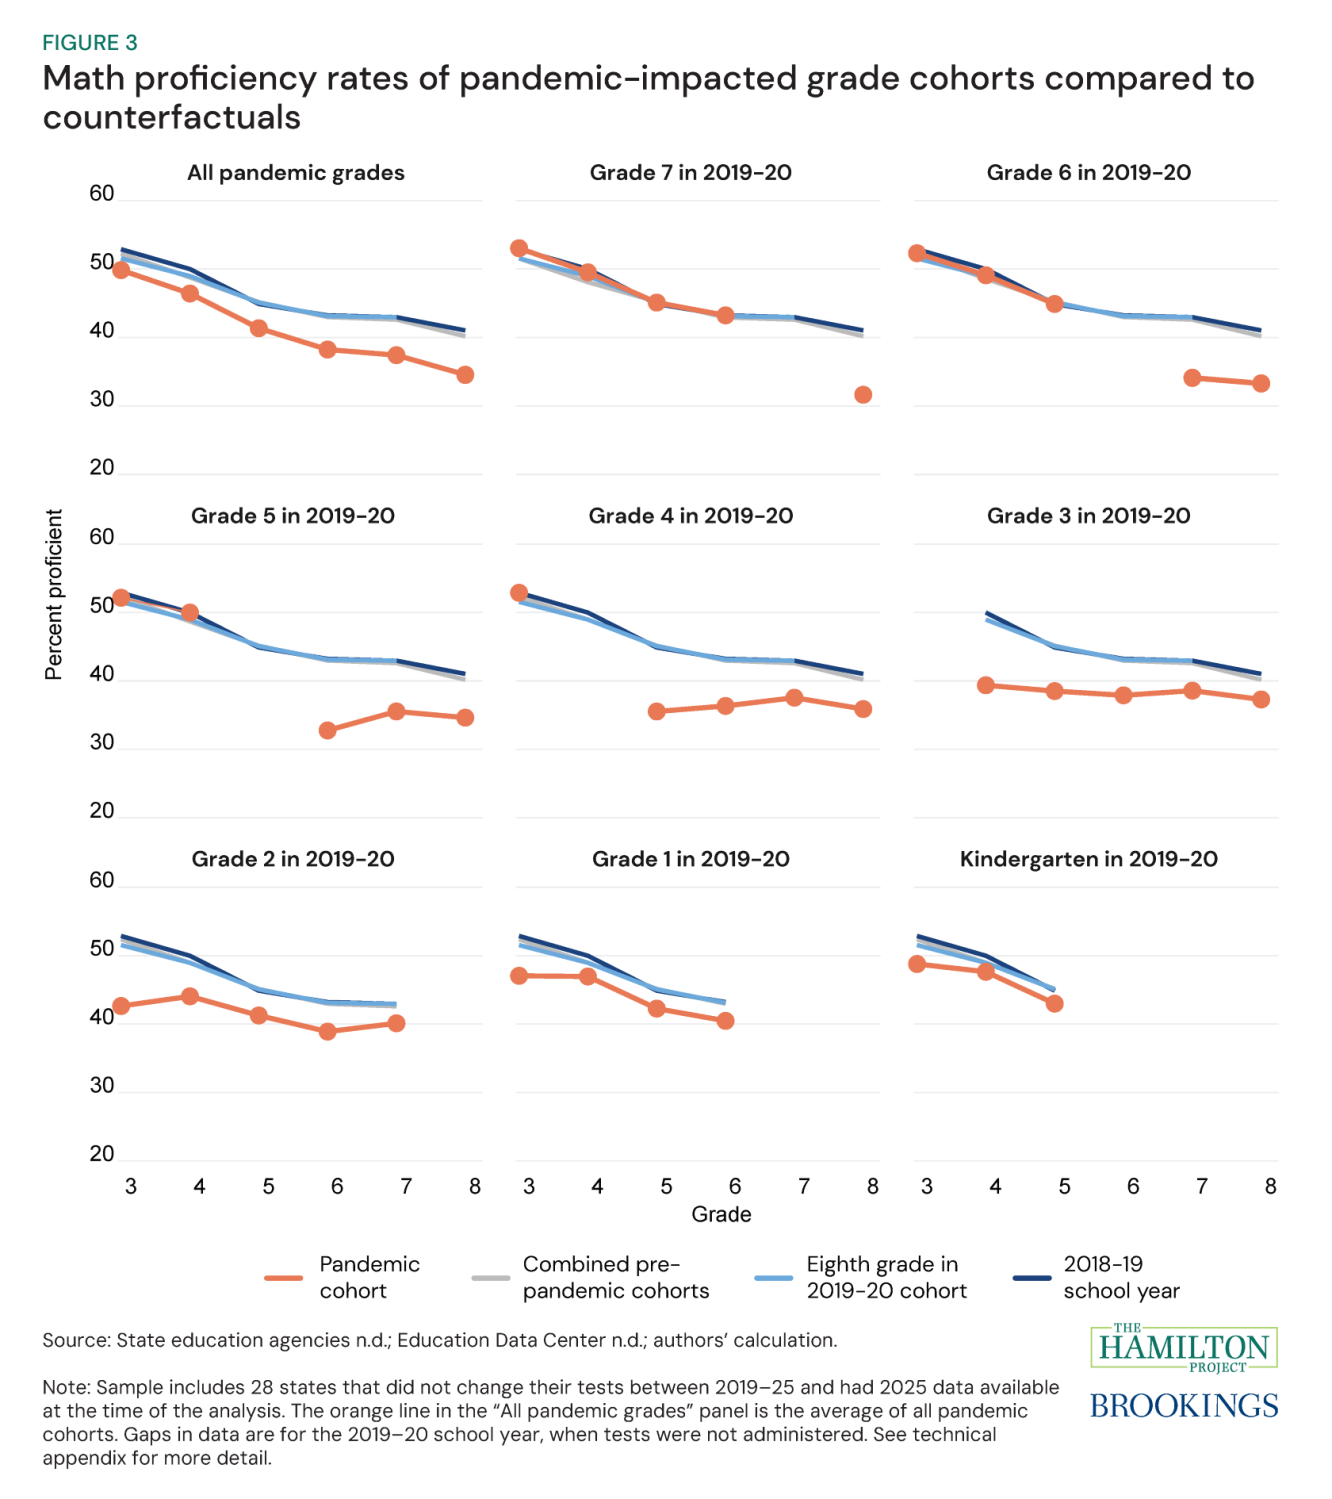
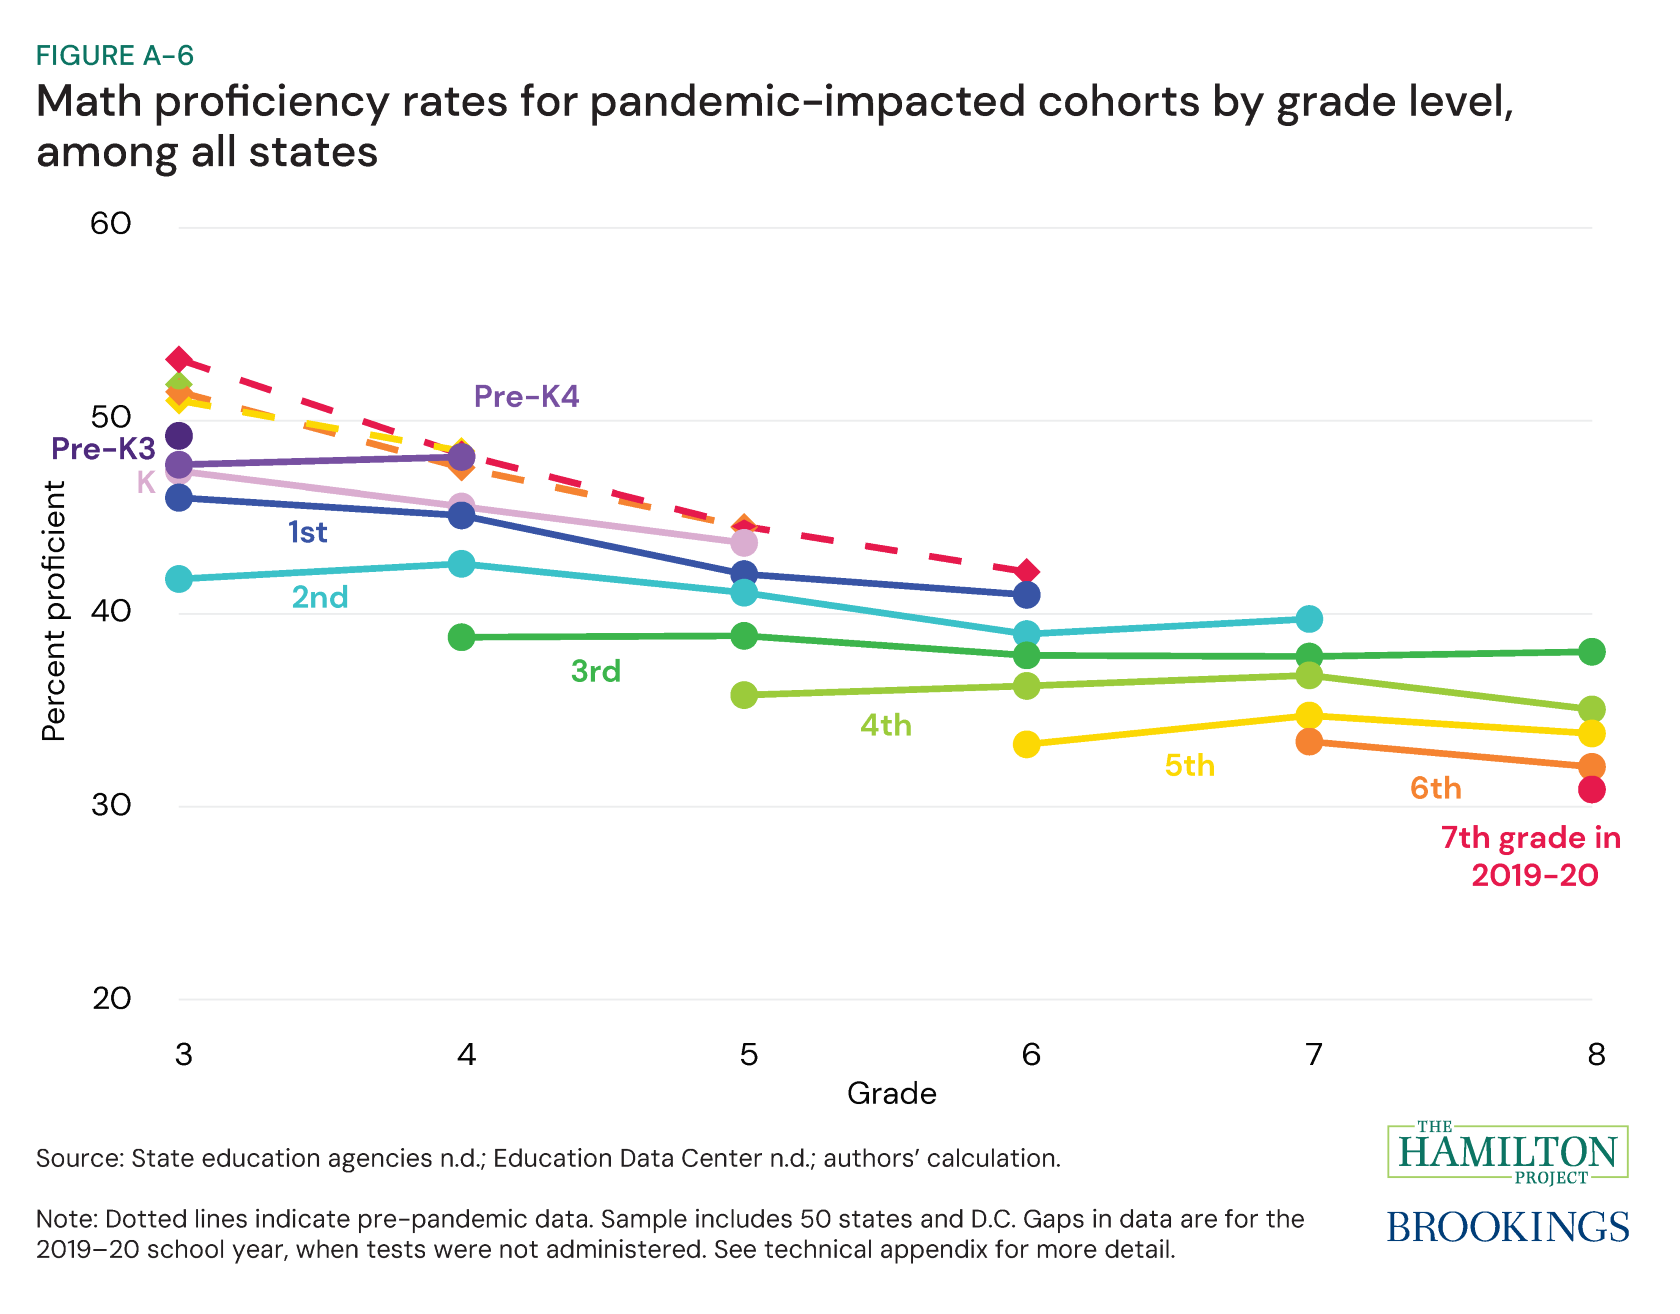
Proficiency rates for all cohorts we observe immediately after the COVID gap (cohorts three to seven) were about 9 percentage points below their pre-pandemic counterfactuals. In the following year, the third through fifth grade cohorts regained between one-quarter to one-third of their 2020–21 loss, while the sixth grade cohort regained only about 16 percent. Among students who were affected by pandemic disruptions before third grade, whom we only observe after the pandemic, proficiency rates are closer to pre-pandemic levels and learning curves than those of older pandemic-impacted cohorts. The younger a student was during the 2019–20 school year, the closer they are to their pre-pandemic counterfactual, and the older a student was, the larger the gap at each grade level.
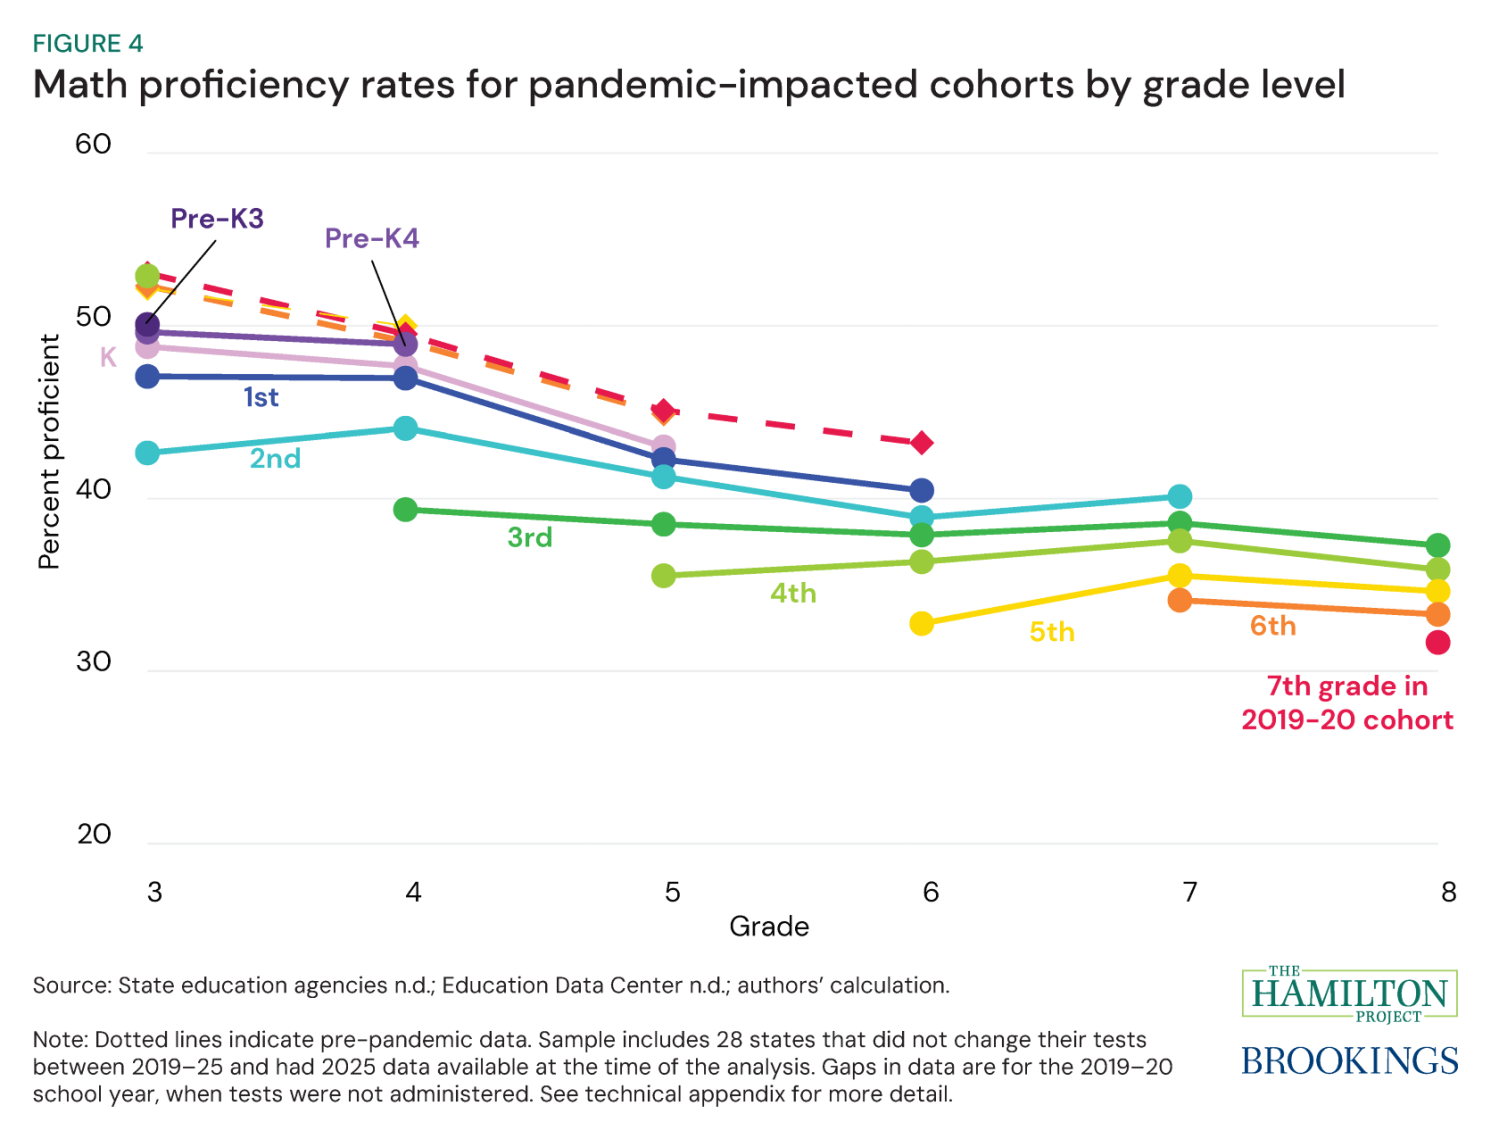
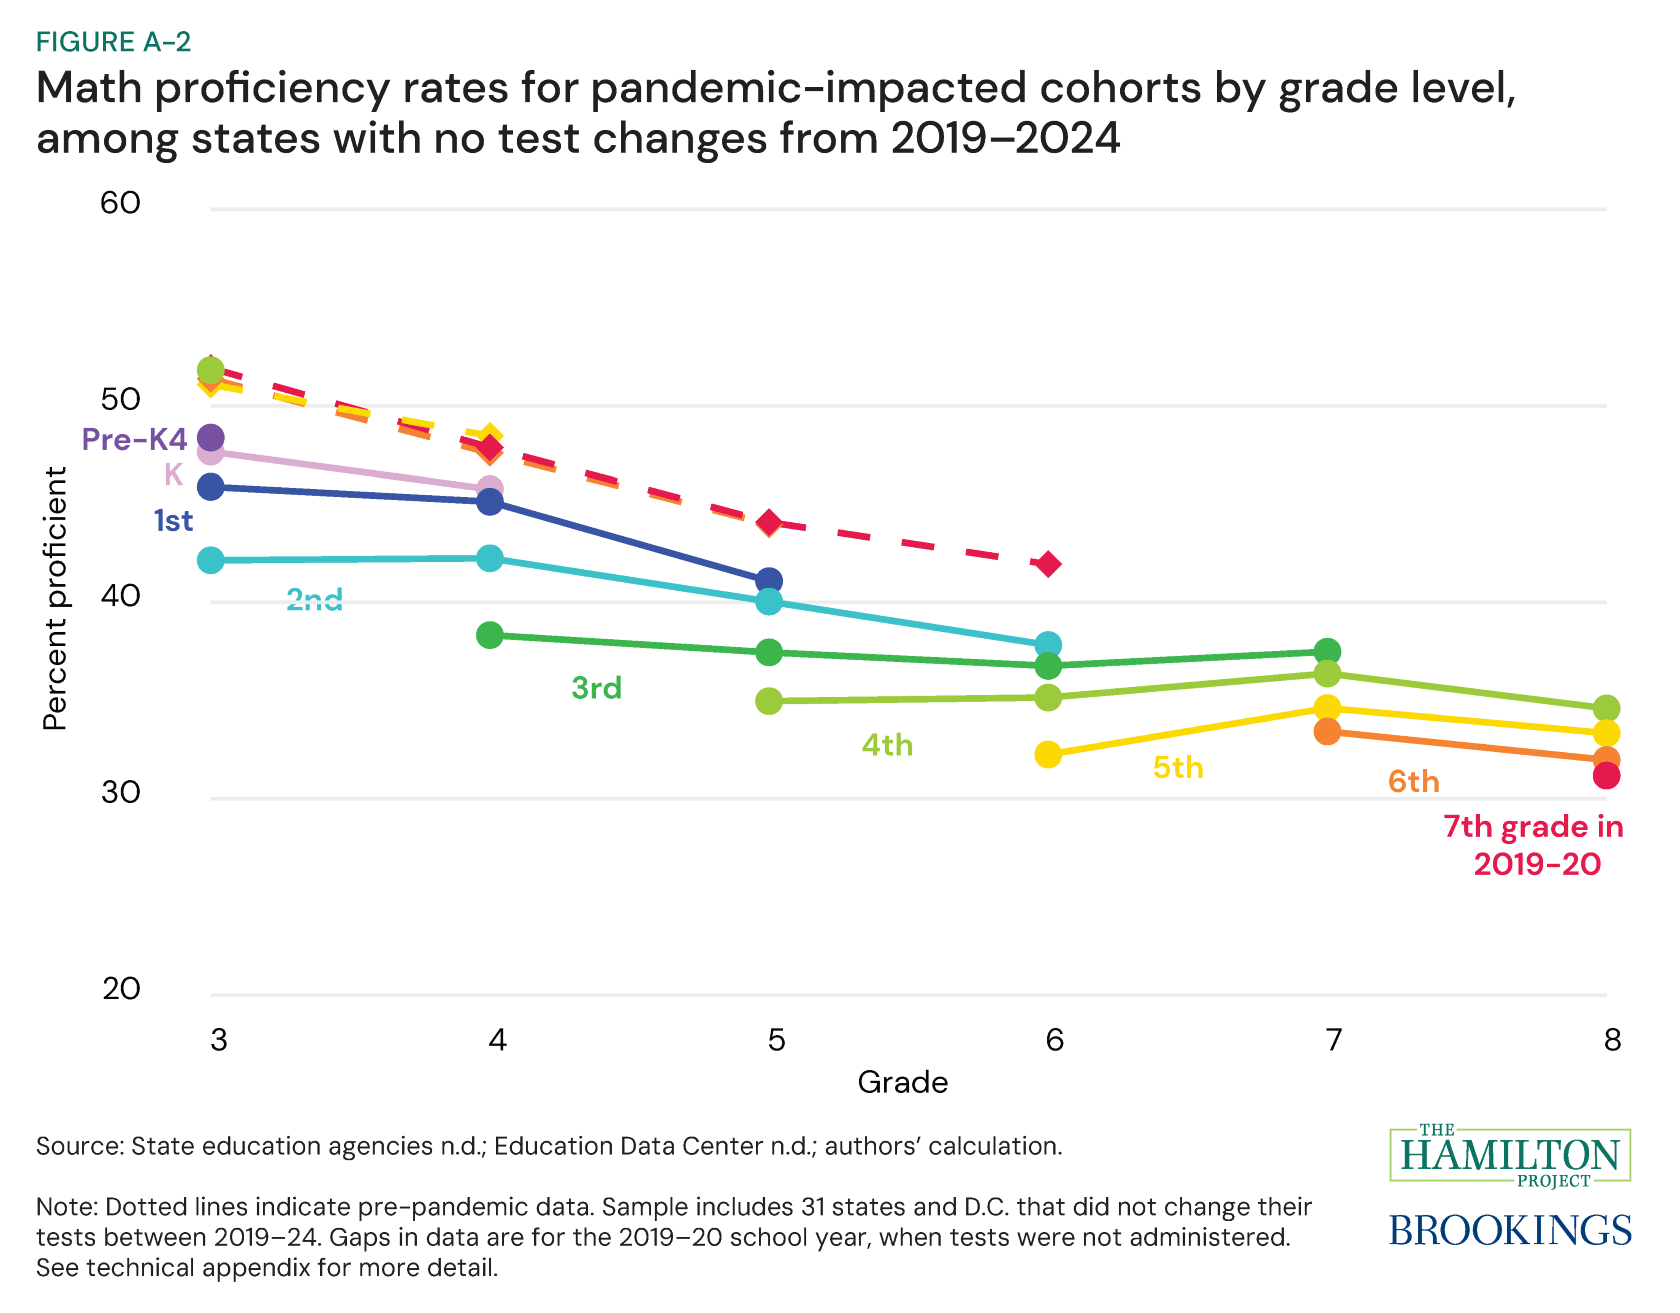
Figure 4 plots every COVID-affected cohort (all the orange lines from figure 3) and adds in students who were in pre-K4 and pre-K3. The cohorts are arranged in a rainbow by grade from seventh grade in 2019–20 (red) to pre-K3 in 2019–20 (dark purple) to make the figure easier to read; unequivocally, the figure shows that the learning curves follow the rainbow. While the pre-pandemic (dashed lines) cohort trajectories follow the same trend, the post-pandemic (solid lines) do not. At every grade level, the older the cohort was in the 2019–20, the lower their proficiency rate in each subsequent grade.
Post-COVID learning curves in English
We repeat the same exercise in math for English, focusing first on fourth graders in 2019–20 (figure 5), followed by all cohorts (figure 6), and then a comparison of the cohorts against each other (figure 7).
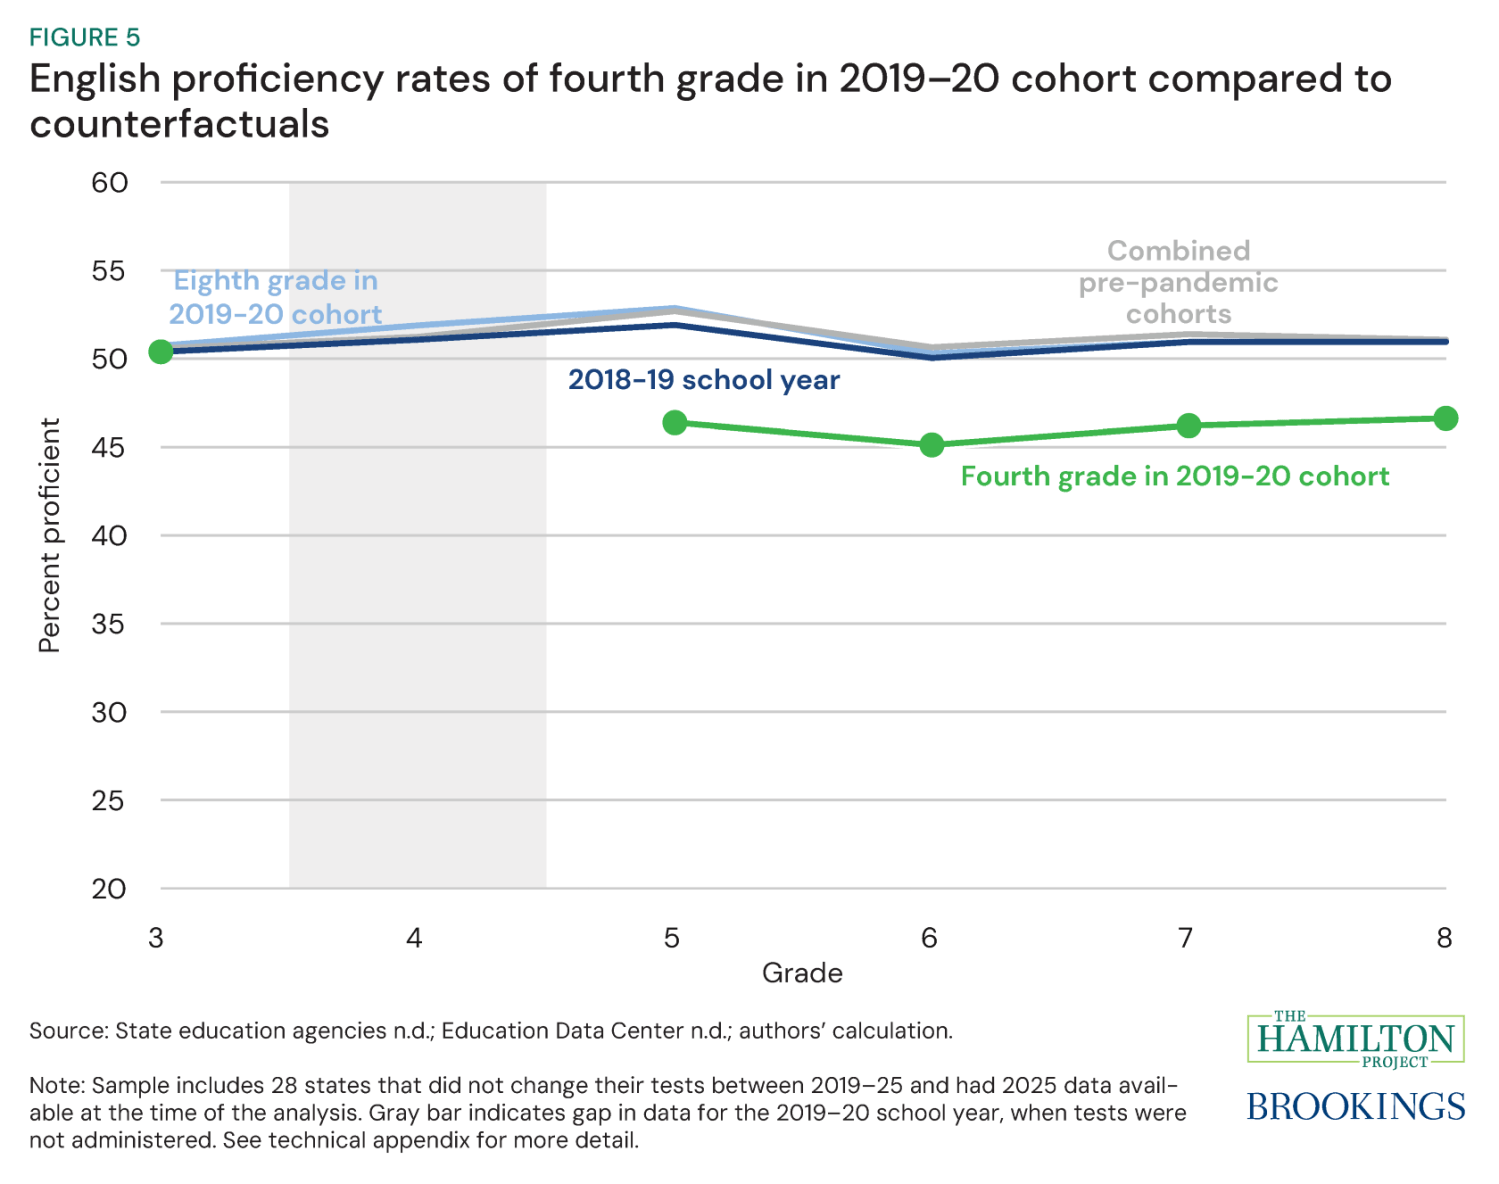
Figure 5 shows that, as for math, the three plausible English counterfactuals are consistent with one another, but, unlike math, they are mostly flat: English proficiency rates gradually rise during elementary school and reset at a somewhat lower level in sixth grade before slightly rising again through eighth. These changes are relatively small, as proficiency rates hover around 51 percent across the grade span. For students in fourth grade during the 2019–20 school year, the pattern persists at a lower level. We observe third grade test scores for this cohort in 2019, then again in 2021 after the pandemic. Simple subtraction implies a decline of just over 4 percentage points. However, pre-pandemic trends imply that English scores would have increased by about 1.9 percentage points in the absence of the pandemic, and so our estimate of the pandemic-induced decline is closer to 5.9 percentage points. These students saw test scores fall through sixth grade before rising at a higher rate than the pre-pandemic comparisons during middle school (sixth through eighth grade).
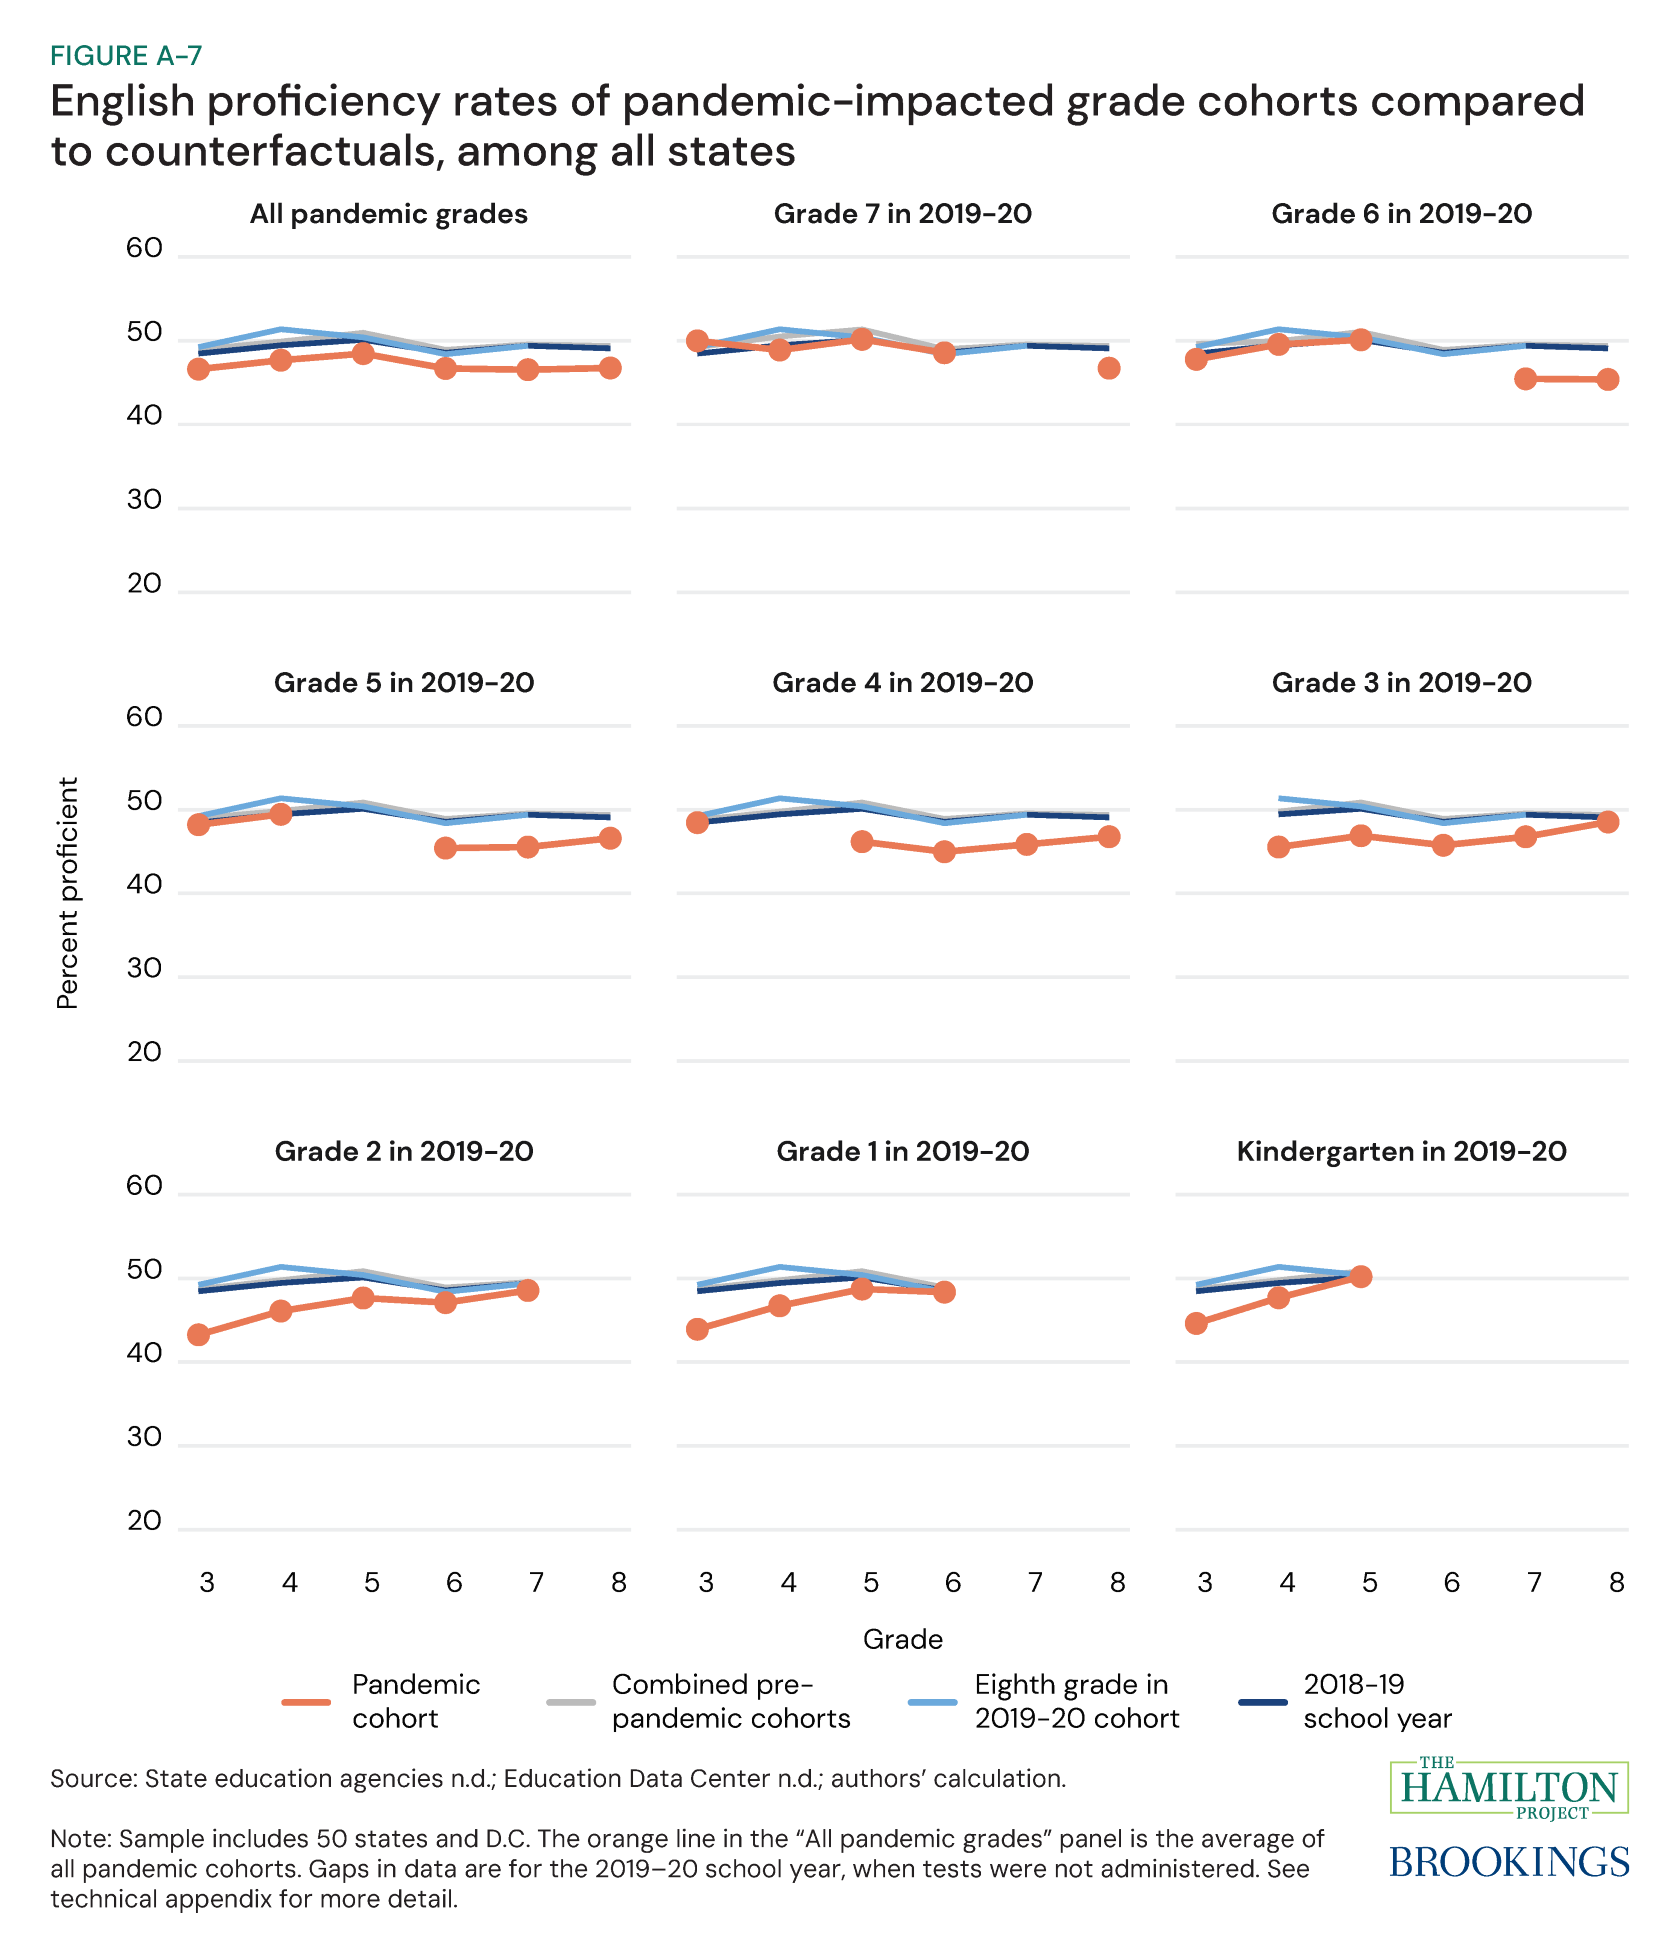
In figure 6, we extend this analysis to all pandemic-affected cohorts. When all the cohorts are combined (upper left corner), the pandemic-affected cohorts (orange line) show the same trend as the pre-pandemic cohorts through sixth grade: a slight increase from third to fifth grade, followed by a reset to lower proficiency levels in sixth grade and a subsequent gradual increase through eighth grade. However, this pattern starts from meaningfully lower levels, and there is substantial heterogeneity by grade cohort. While there is convergence in proficiency rates in seventh and eighth grade, for third through sixth grades, the older the student was during the 2019–20 school year, the lower the proficiency rate.
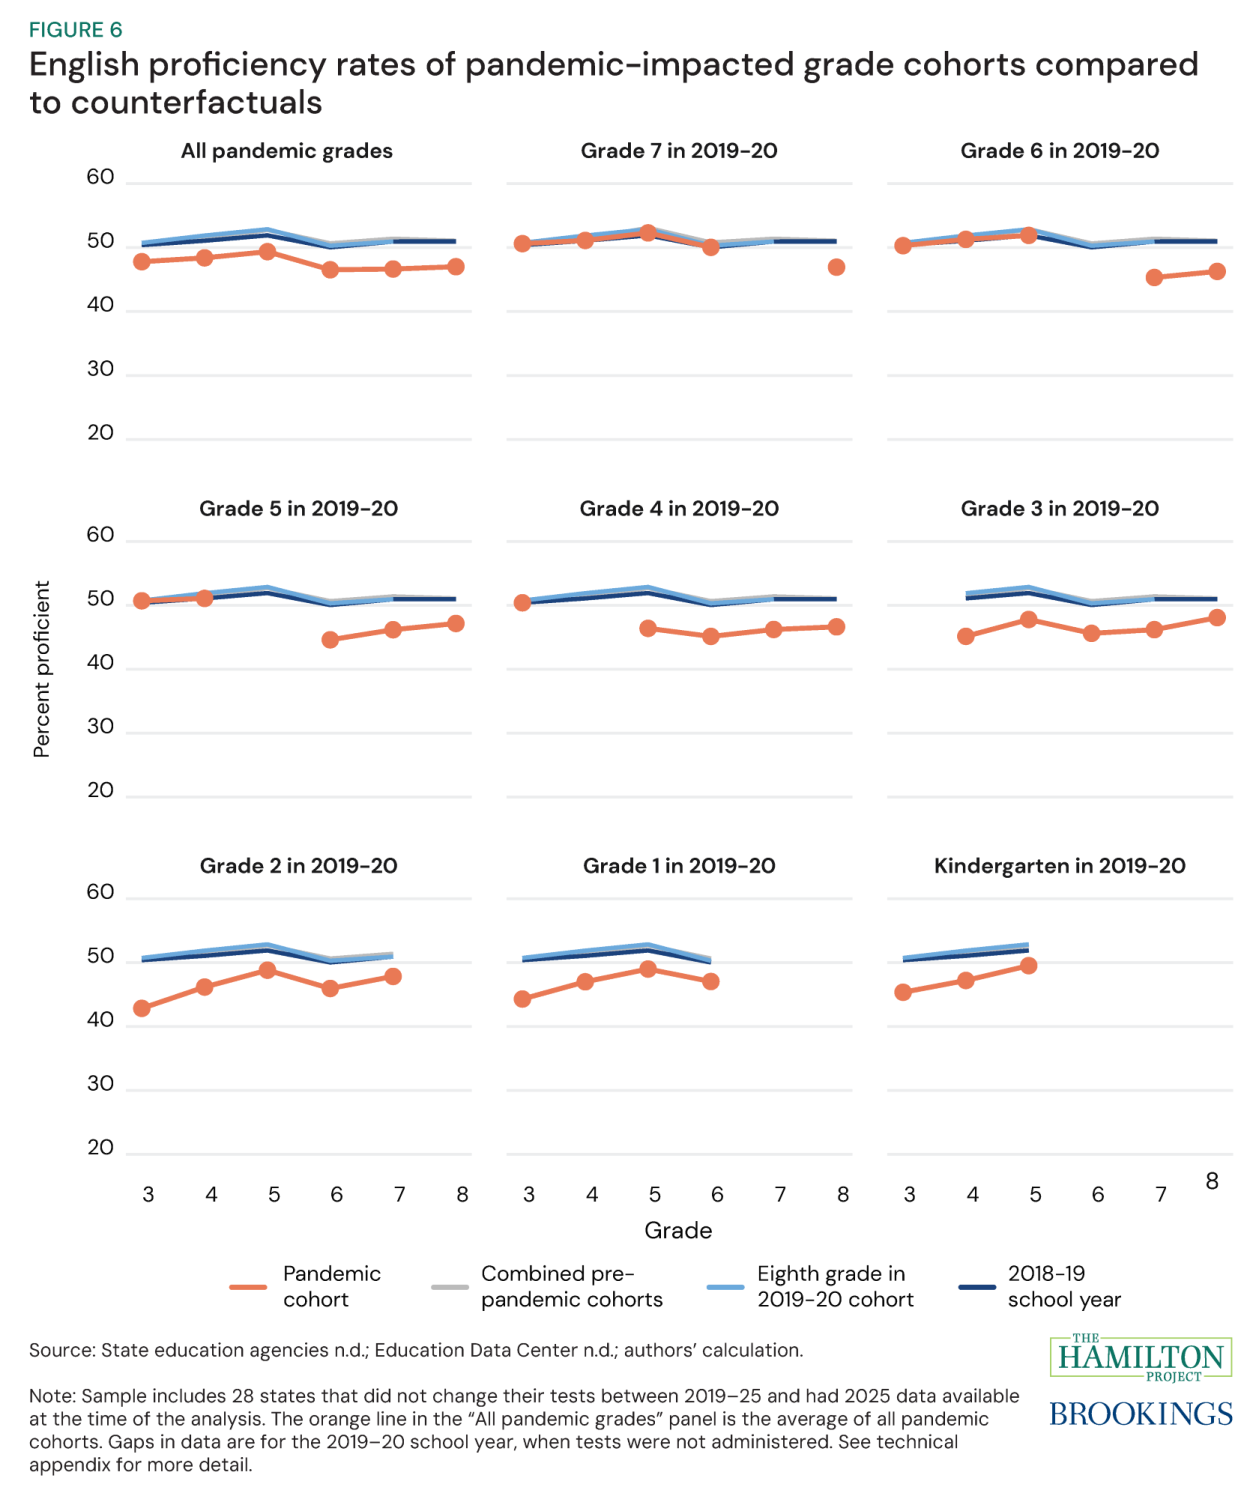
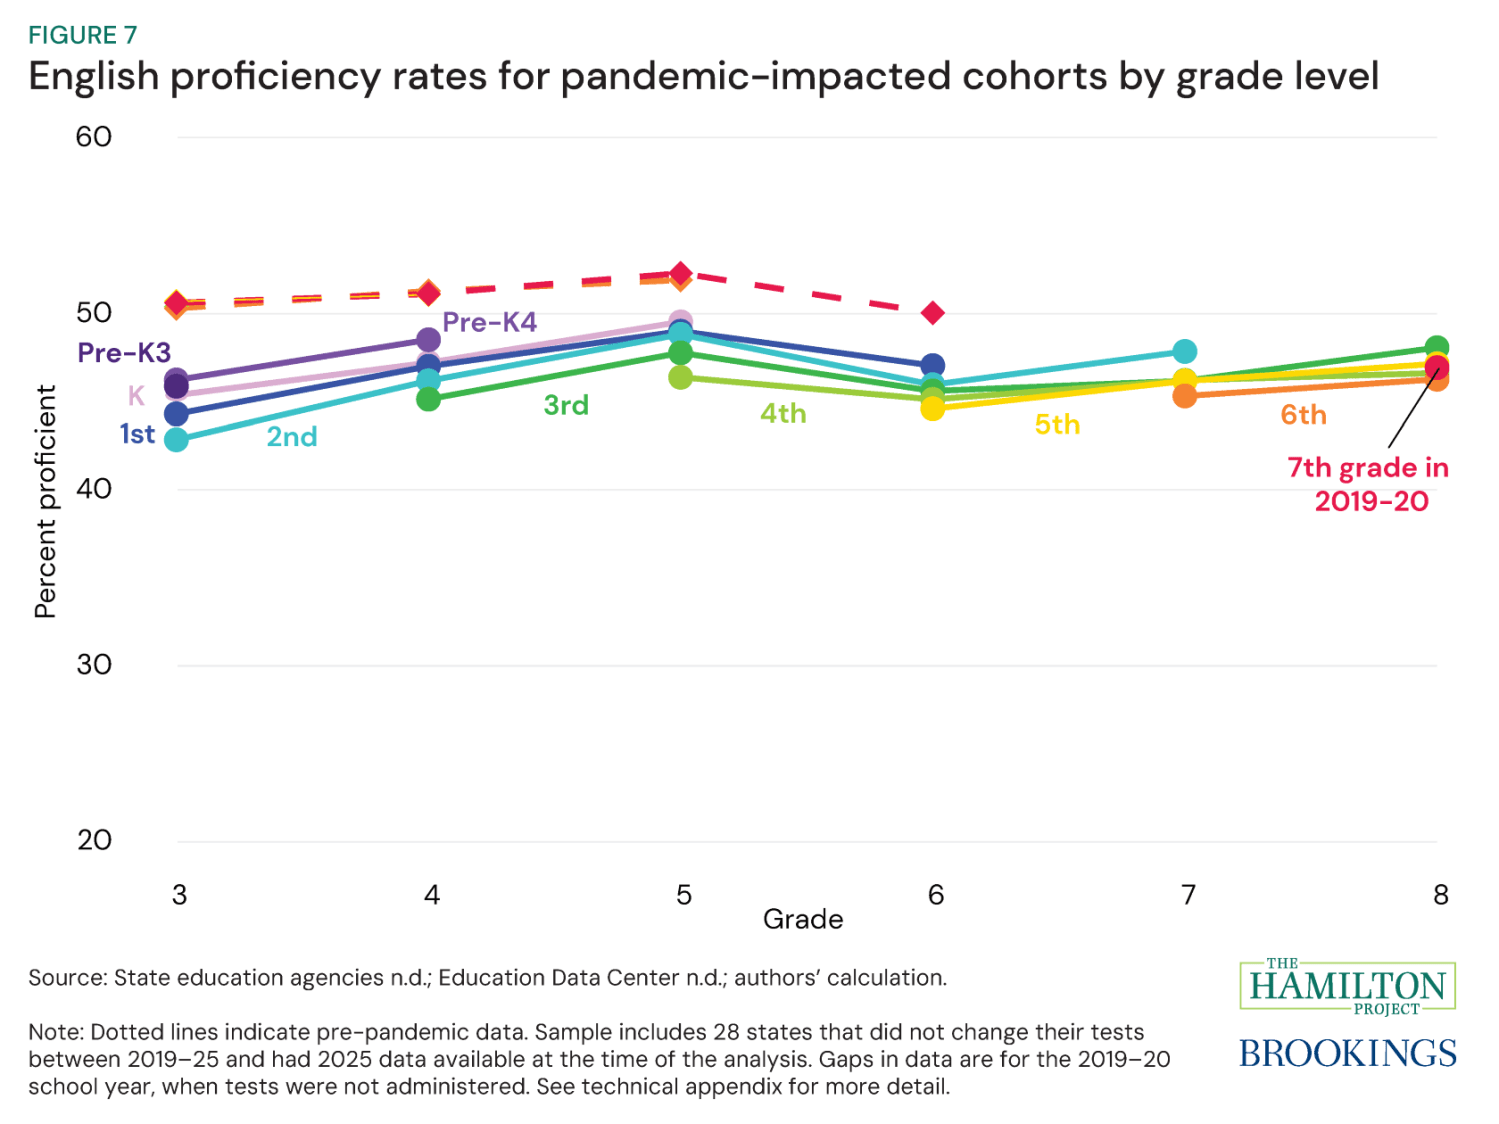
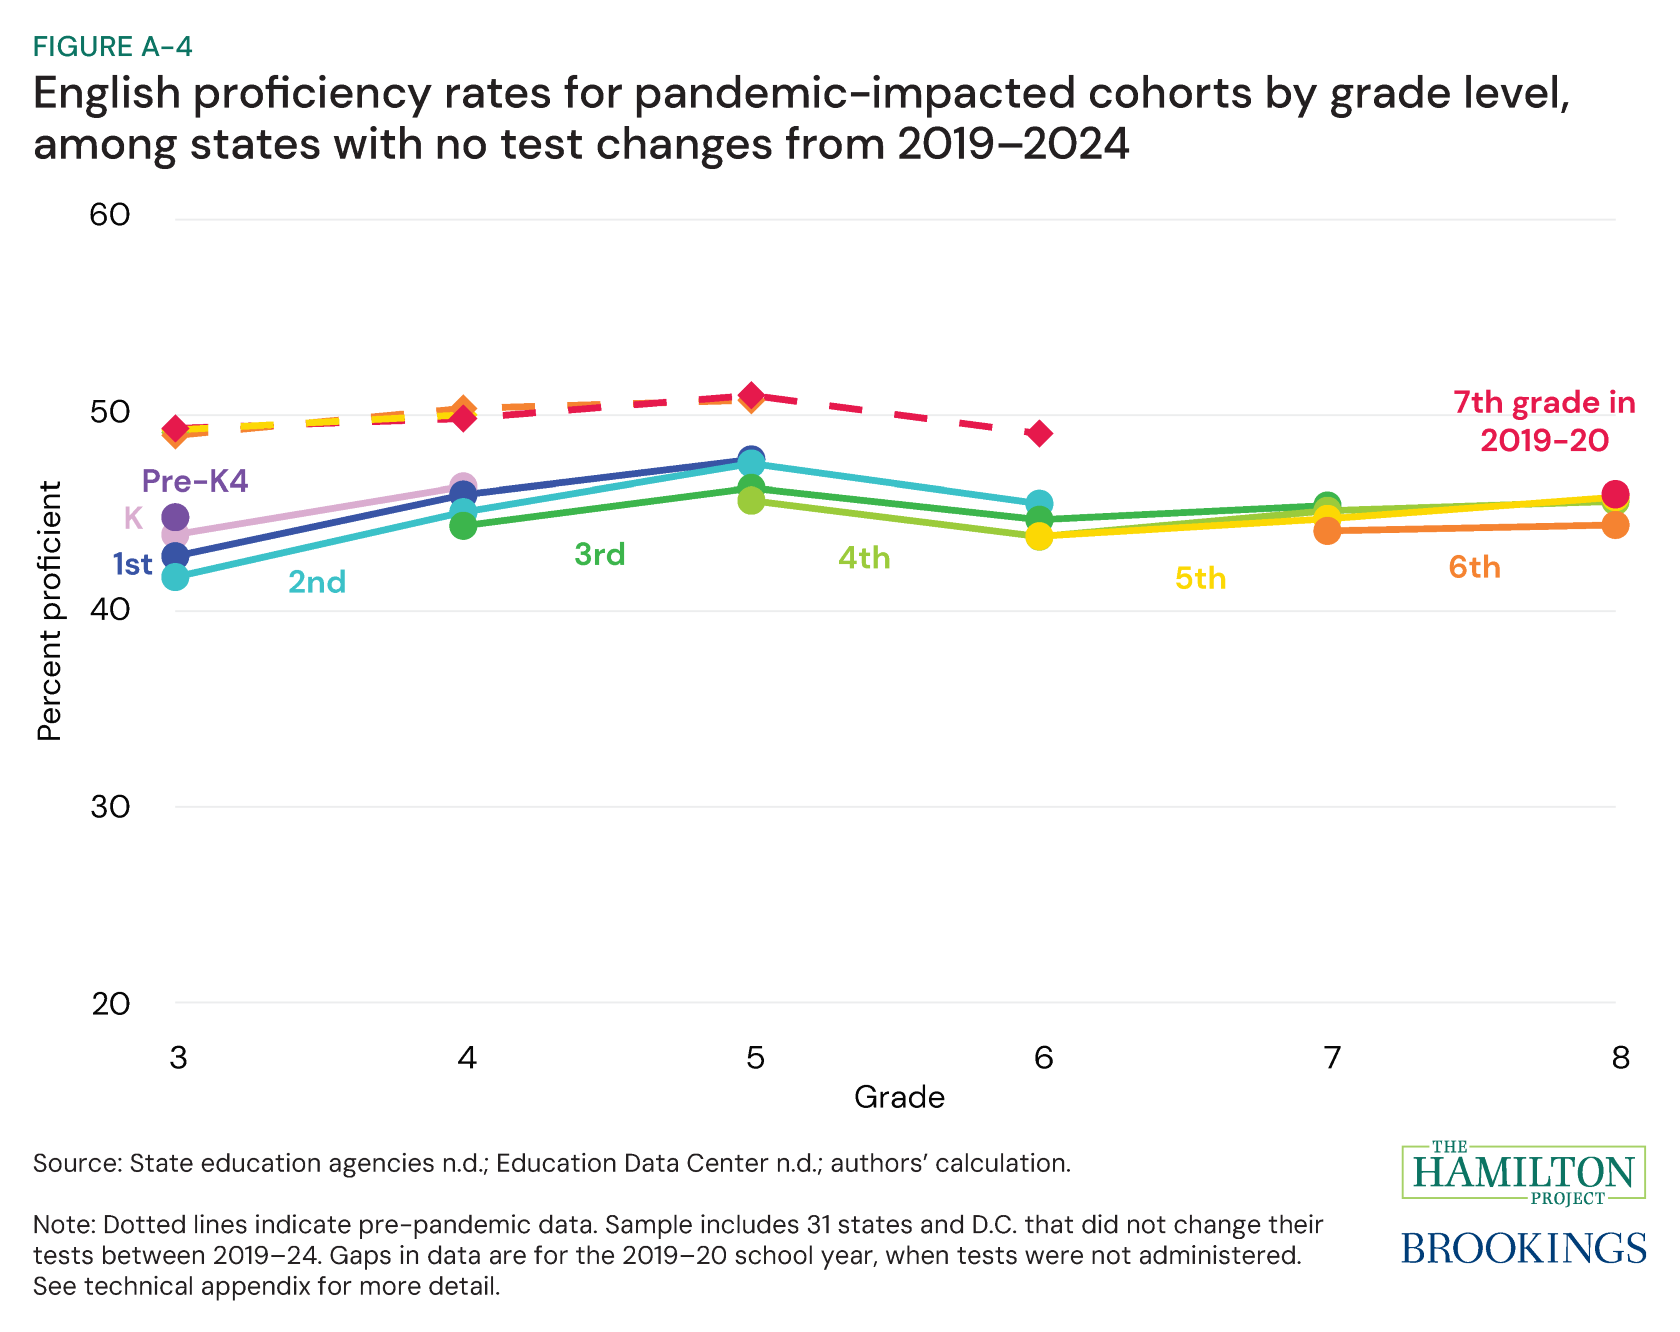
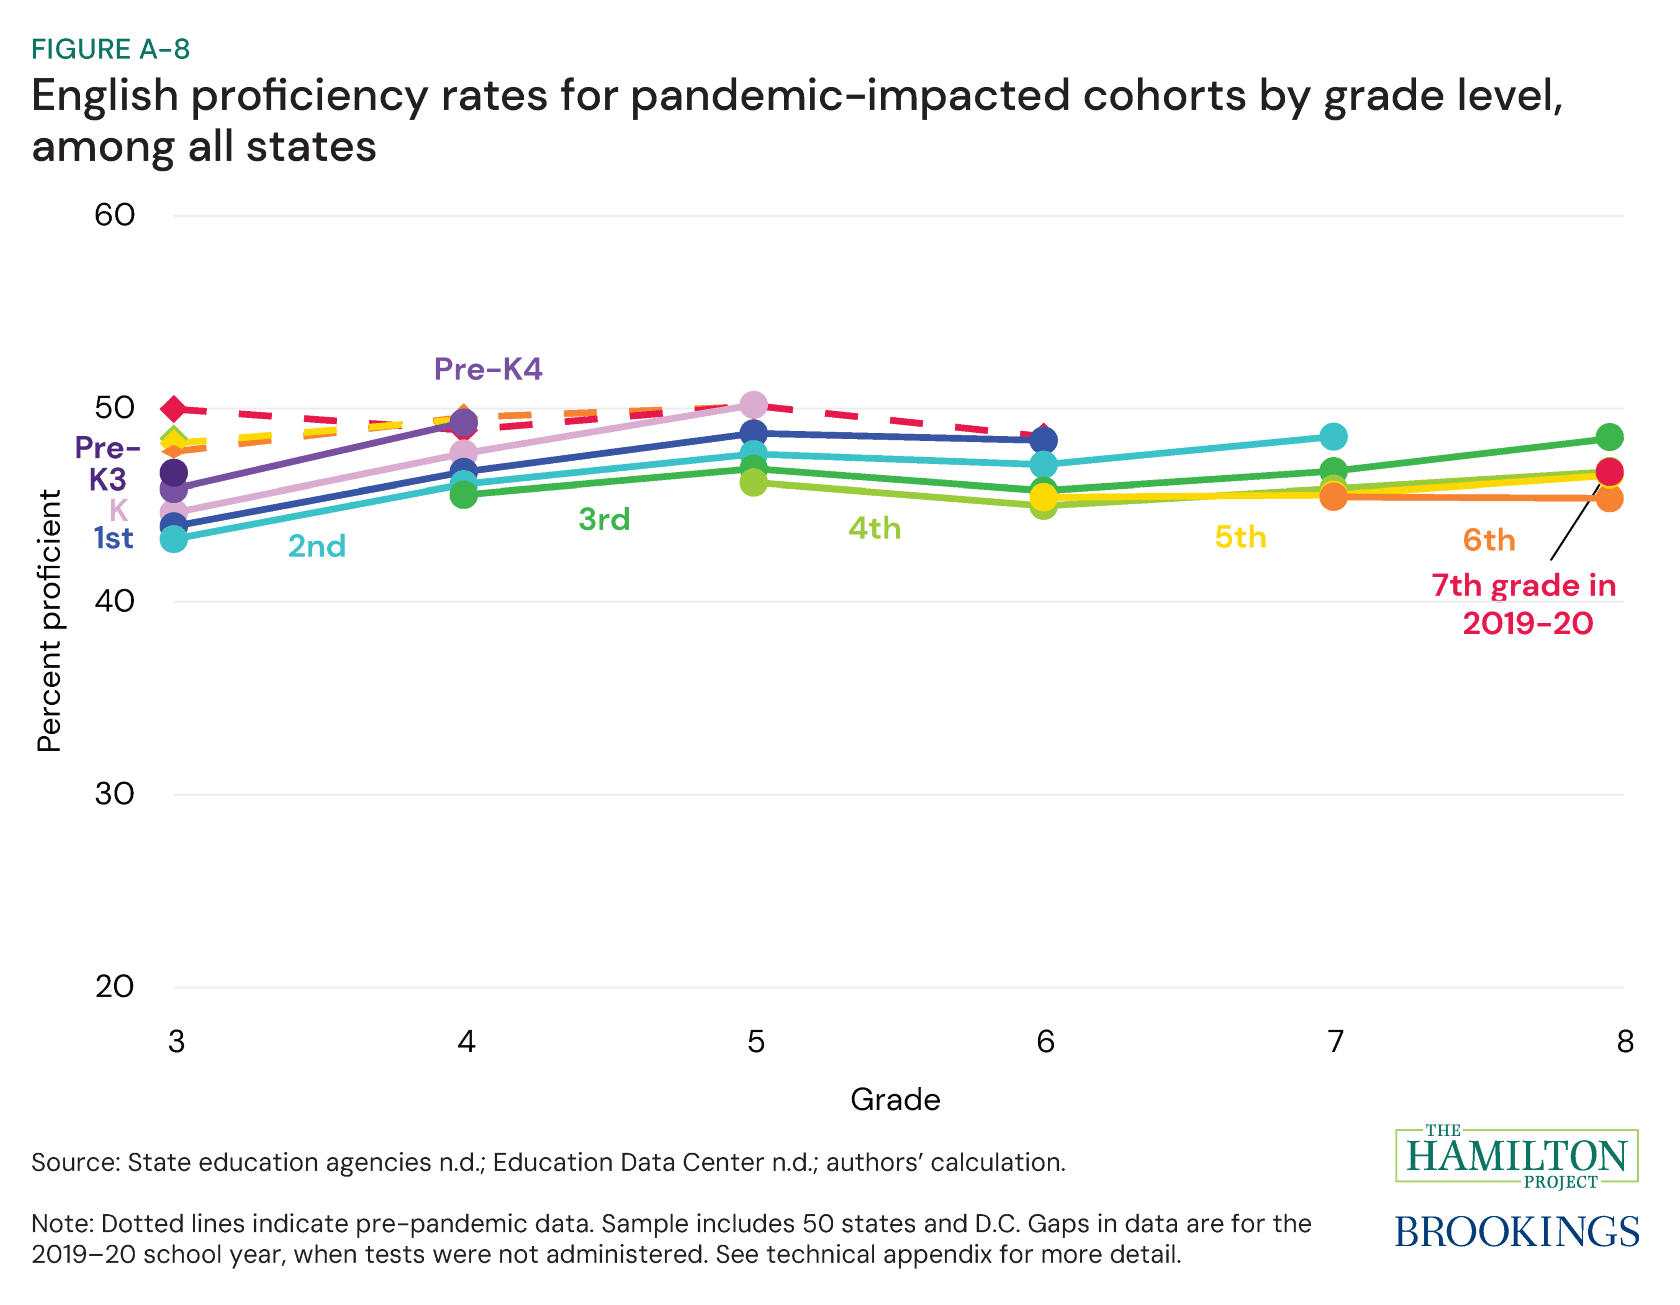
Figure 7 compares each pandemic-affected grade cohort against each other, arranged in a rainbow from the oldest (seventh grade in red) to youngest (kindergarten in purple). Here, the pattern of trajectories are more compressed, though the rainbow pattern still mostly holds. Proficiency rates are stable or marginally higher with each progressively younger cohort, with convergence among older cohorts in middle school.
Conclusion
This analysis is narrowly focused on determining whether there were learning curves differences by grade rather than why that was the case. We demonstrate that post-COVID proficiency rates in English and, especially, math are related to the grade a student was during the disruption. We find that the older the student was in the 2019–20 school year, the lower the subsequent proficiency rate trajectory. Future research should consider producing analyses by cohort in addition to grade level when investigating COVID’s impact on students. While we use proficiency rates, this approach could be applied to test scores and other outcomes. Furthermore, while this exercise is limited to data through eighth grade, this approach could and should be extended to high school and beyond.
-
Technical appendix
Sample: We collected data on proficiency rates from 2015–25 for all 50 states and the District of Columbia from state education agency websites. We supplemented missing or inaccurate data with data from the Education Data Collective, available here. Data are disaggregated by state, year, subject, and grade. For the main analysis, we include states that did not significantly change their tests or their underlying cut scores between 2019 and 2025 (from Kuhfeld and Lewis 2025 and authors’ assessment) and which had 2025 data available as of December 3, 2025.
Our final analytical sample includes 28 states: California, Colorado, Connecticut, Delaware, Georgia, Indiana, Iowa, Louisiana, Massachusetts, Michigan, Minnesota, Mississippi, Missouri, Nevada, New Hampshire, New Jersey, North Carolina, Ohio, Oregon, Pennsylvania, Rhode Island, South Carolina, South Dakota, Tennessee, Utah, Washington, West Virginia, and Wyoming.
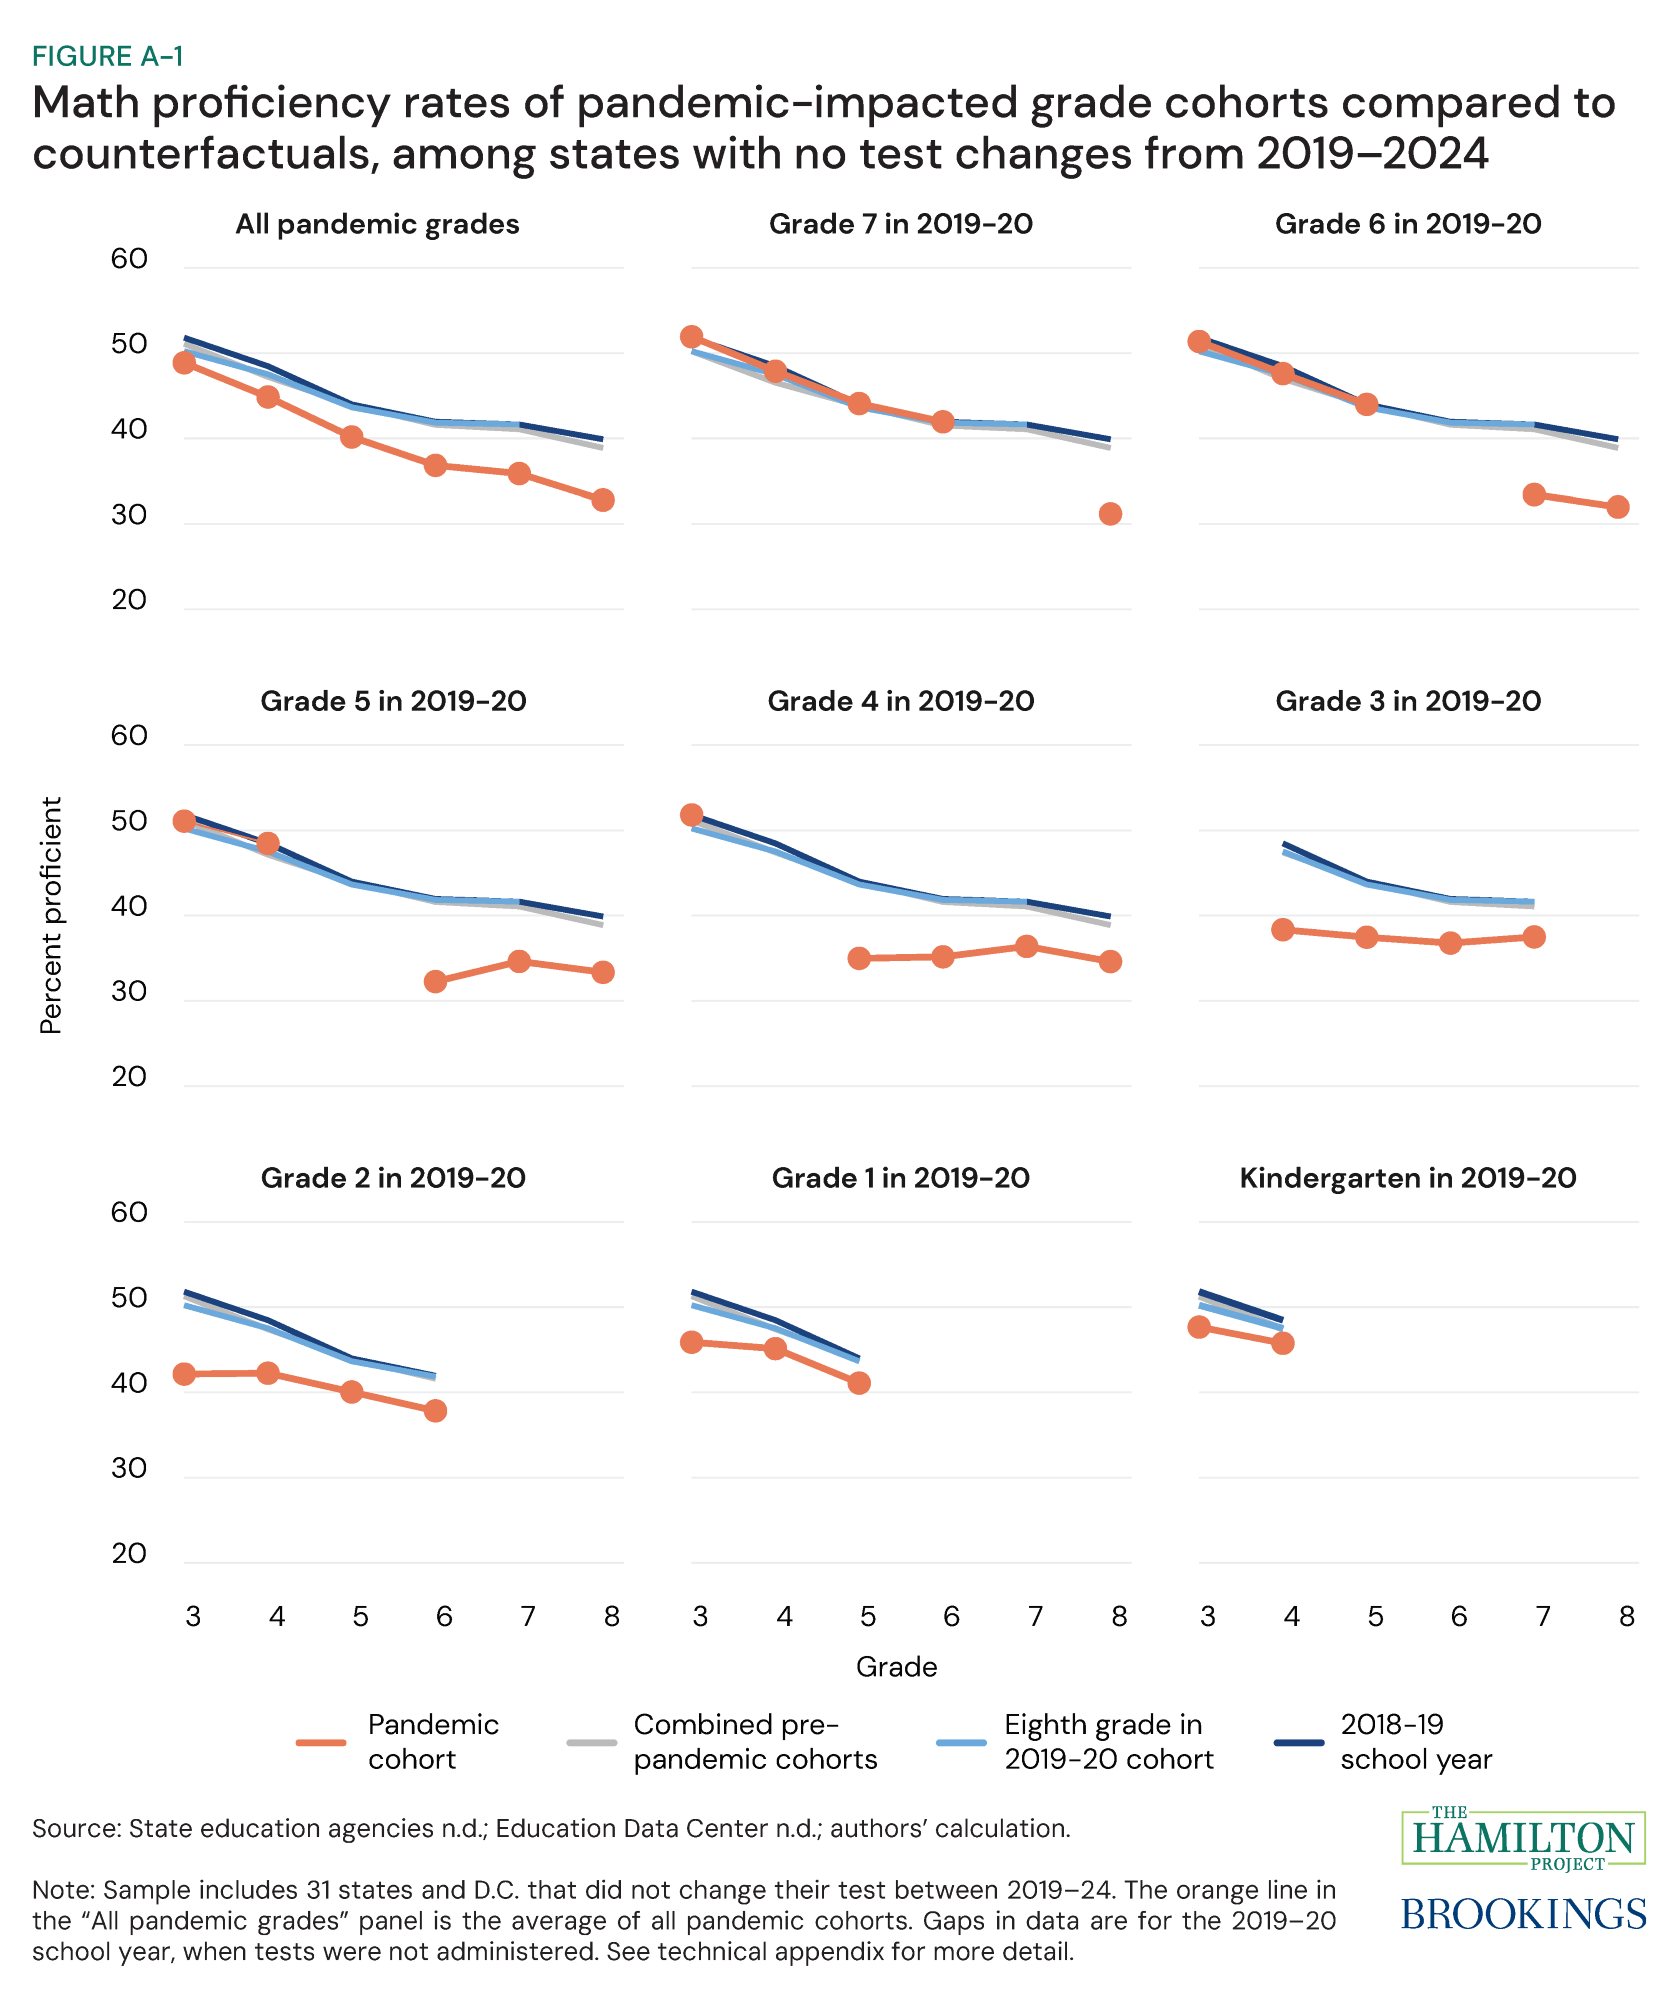
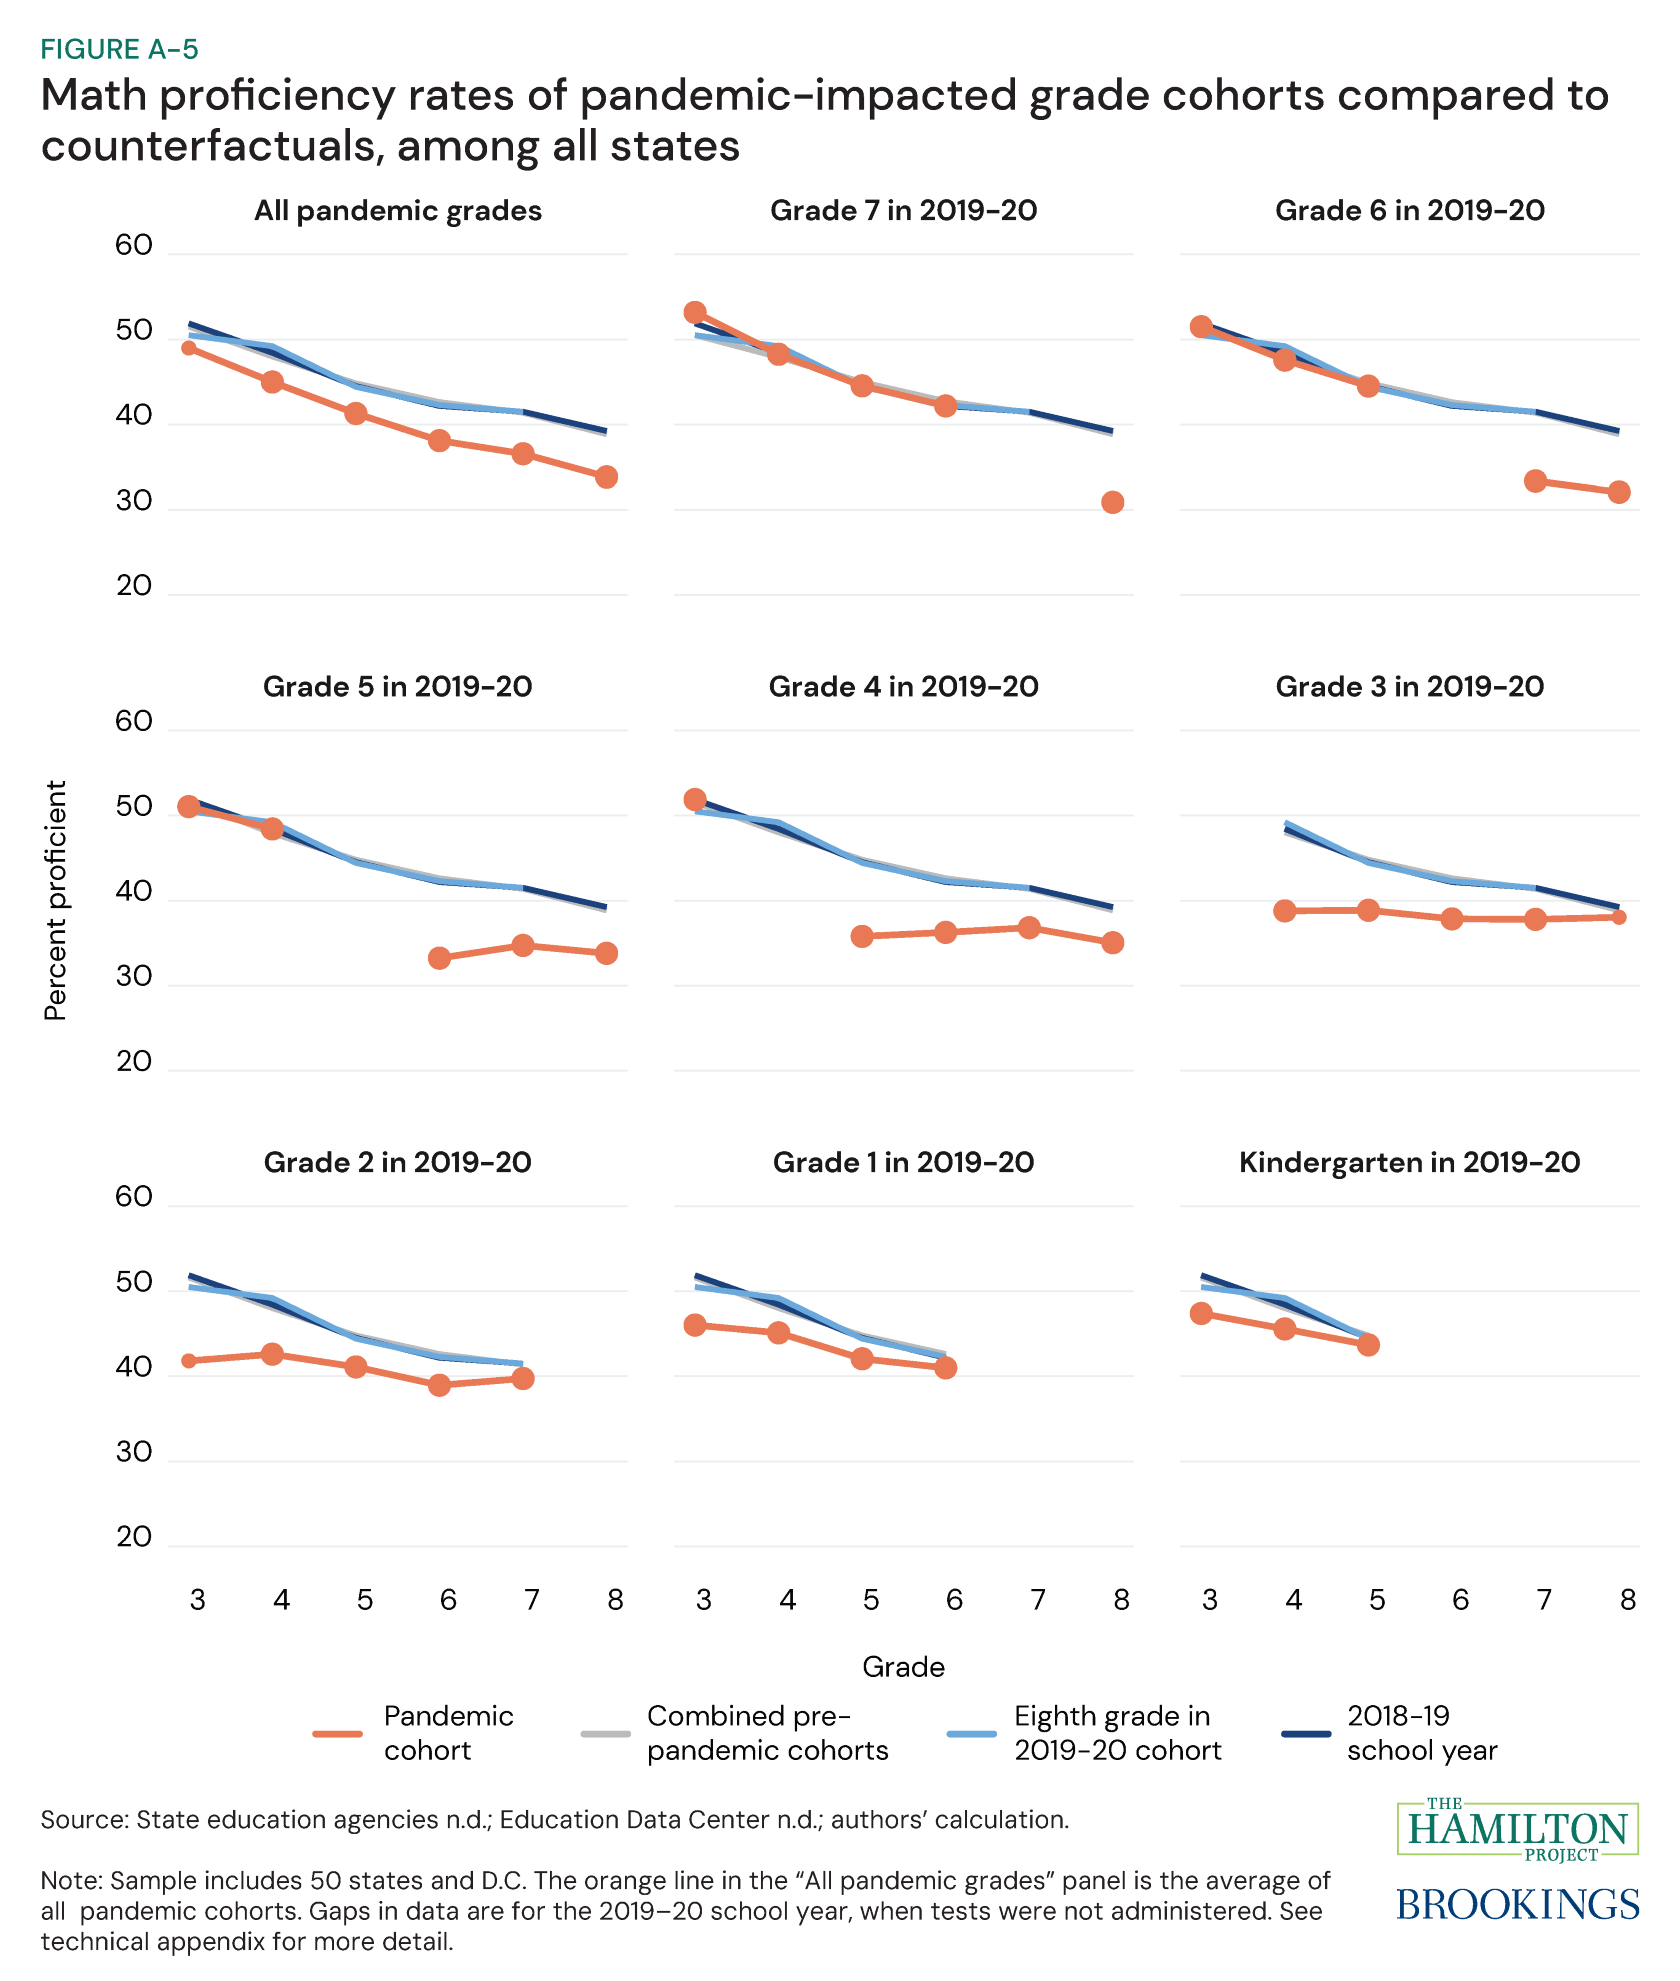
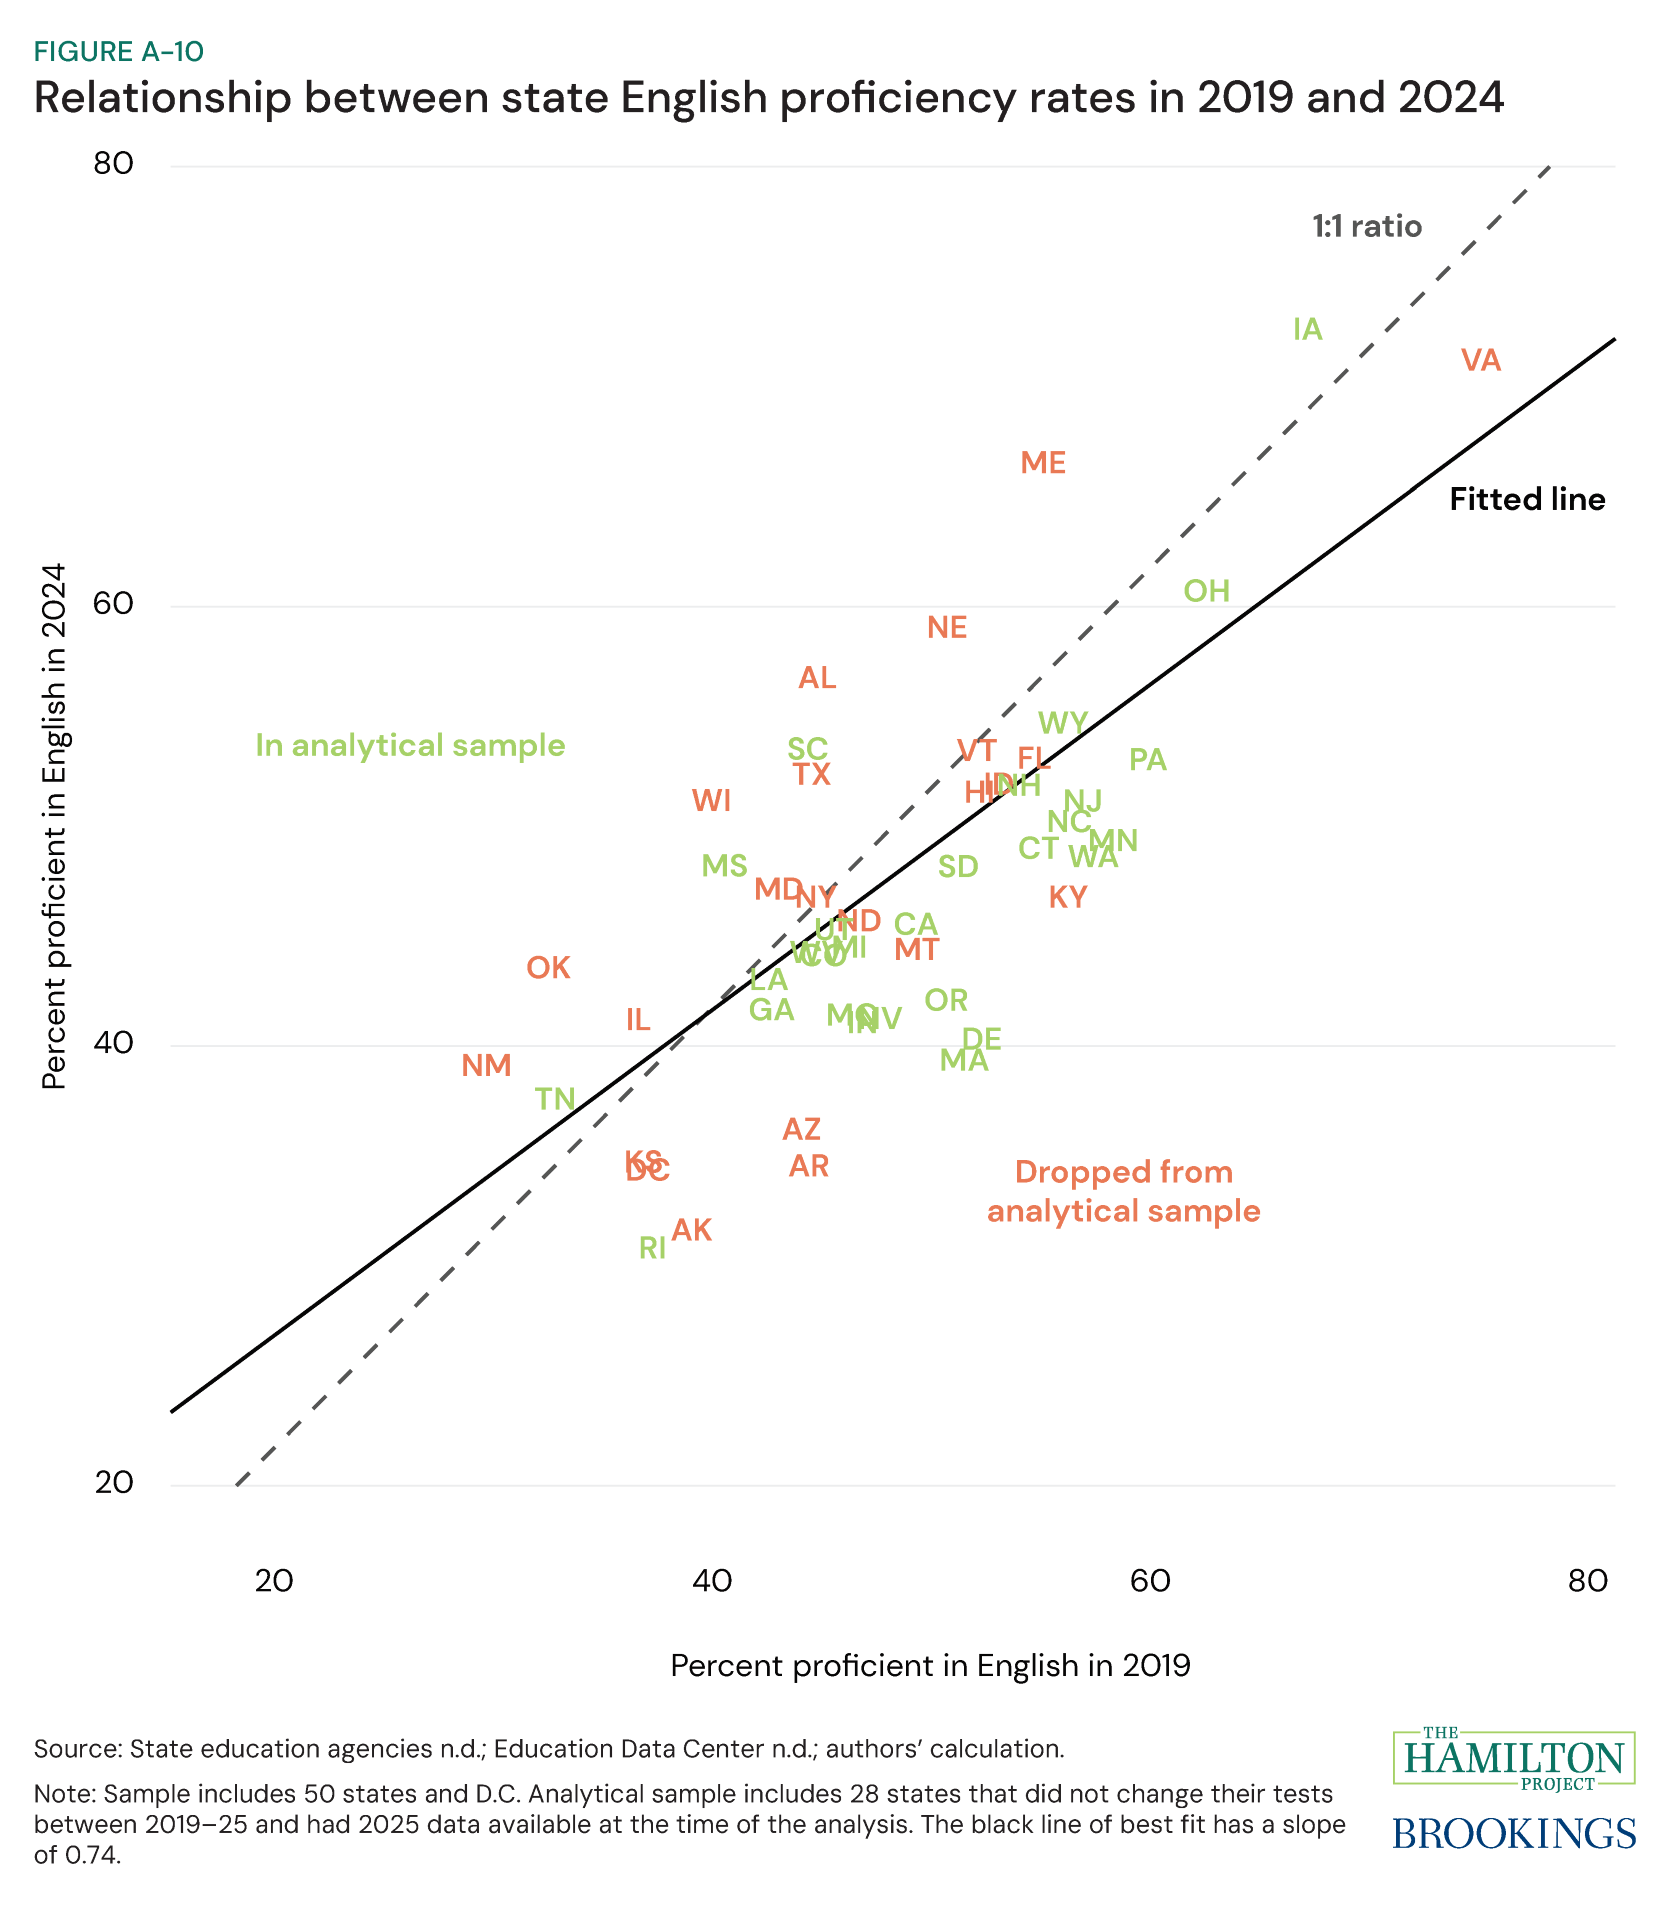
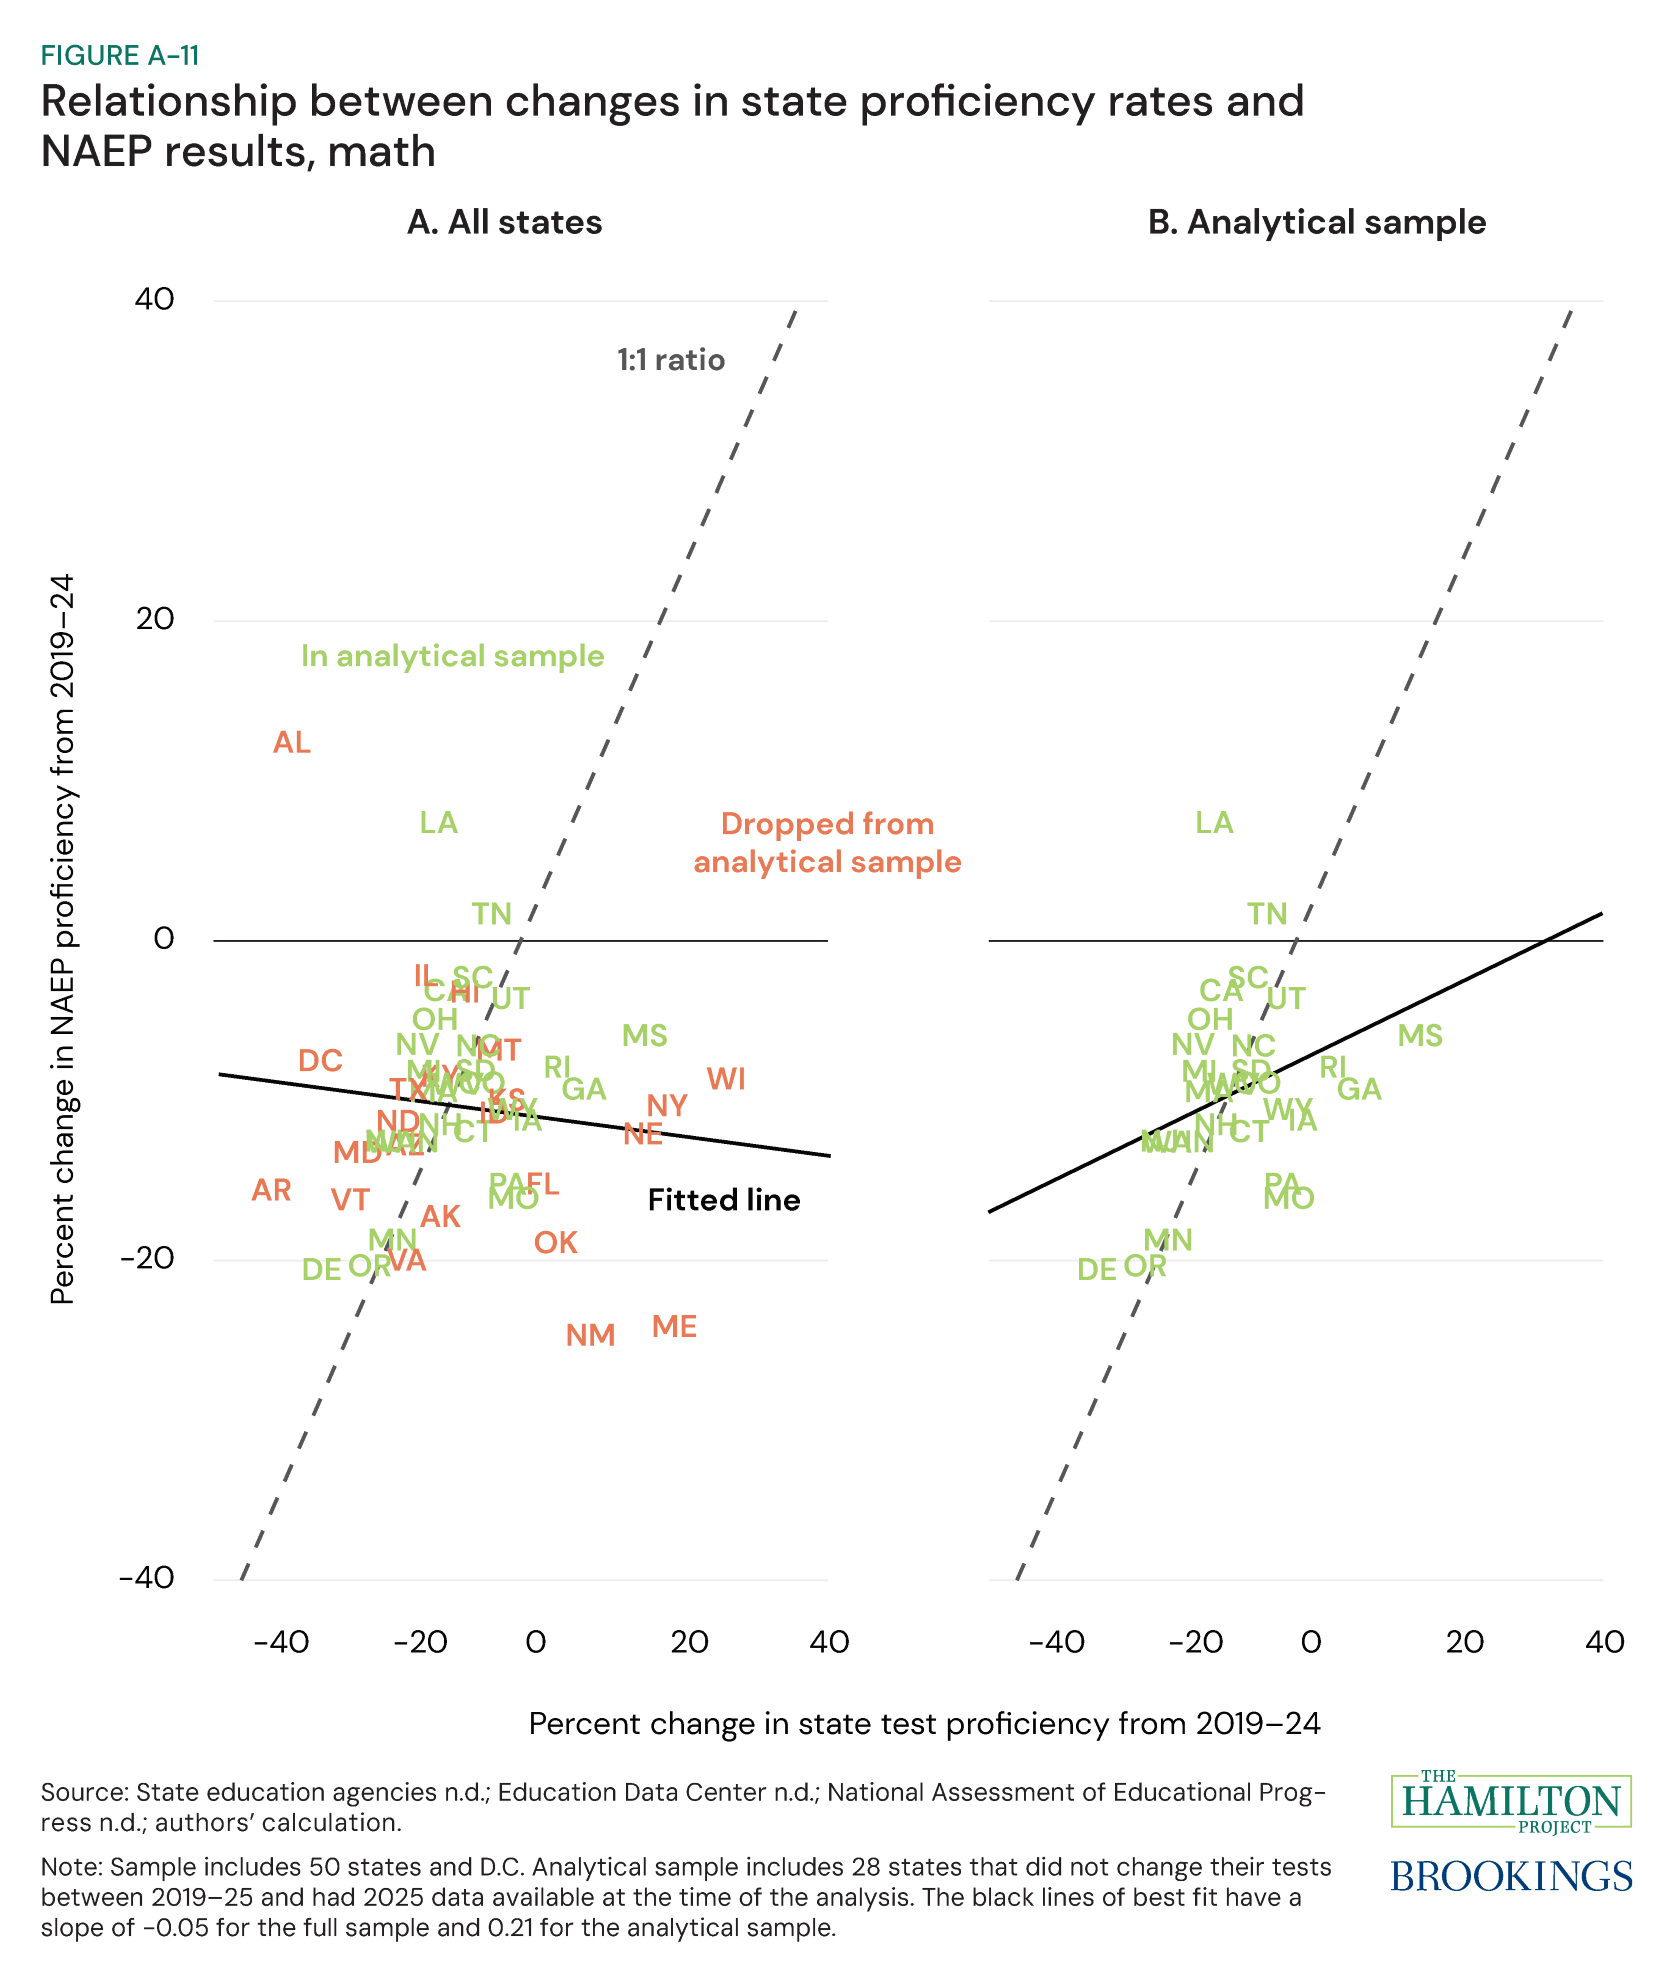
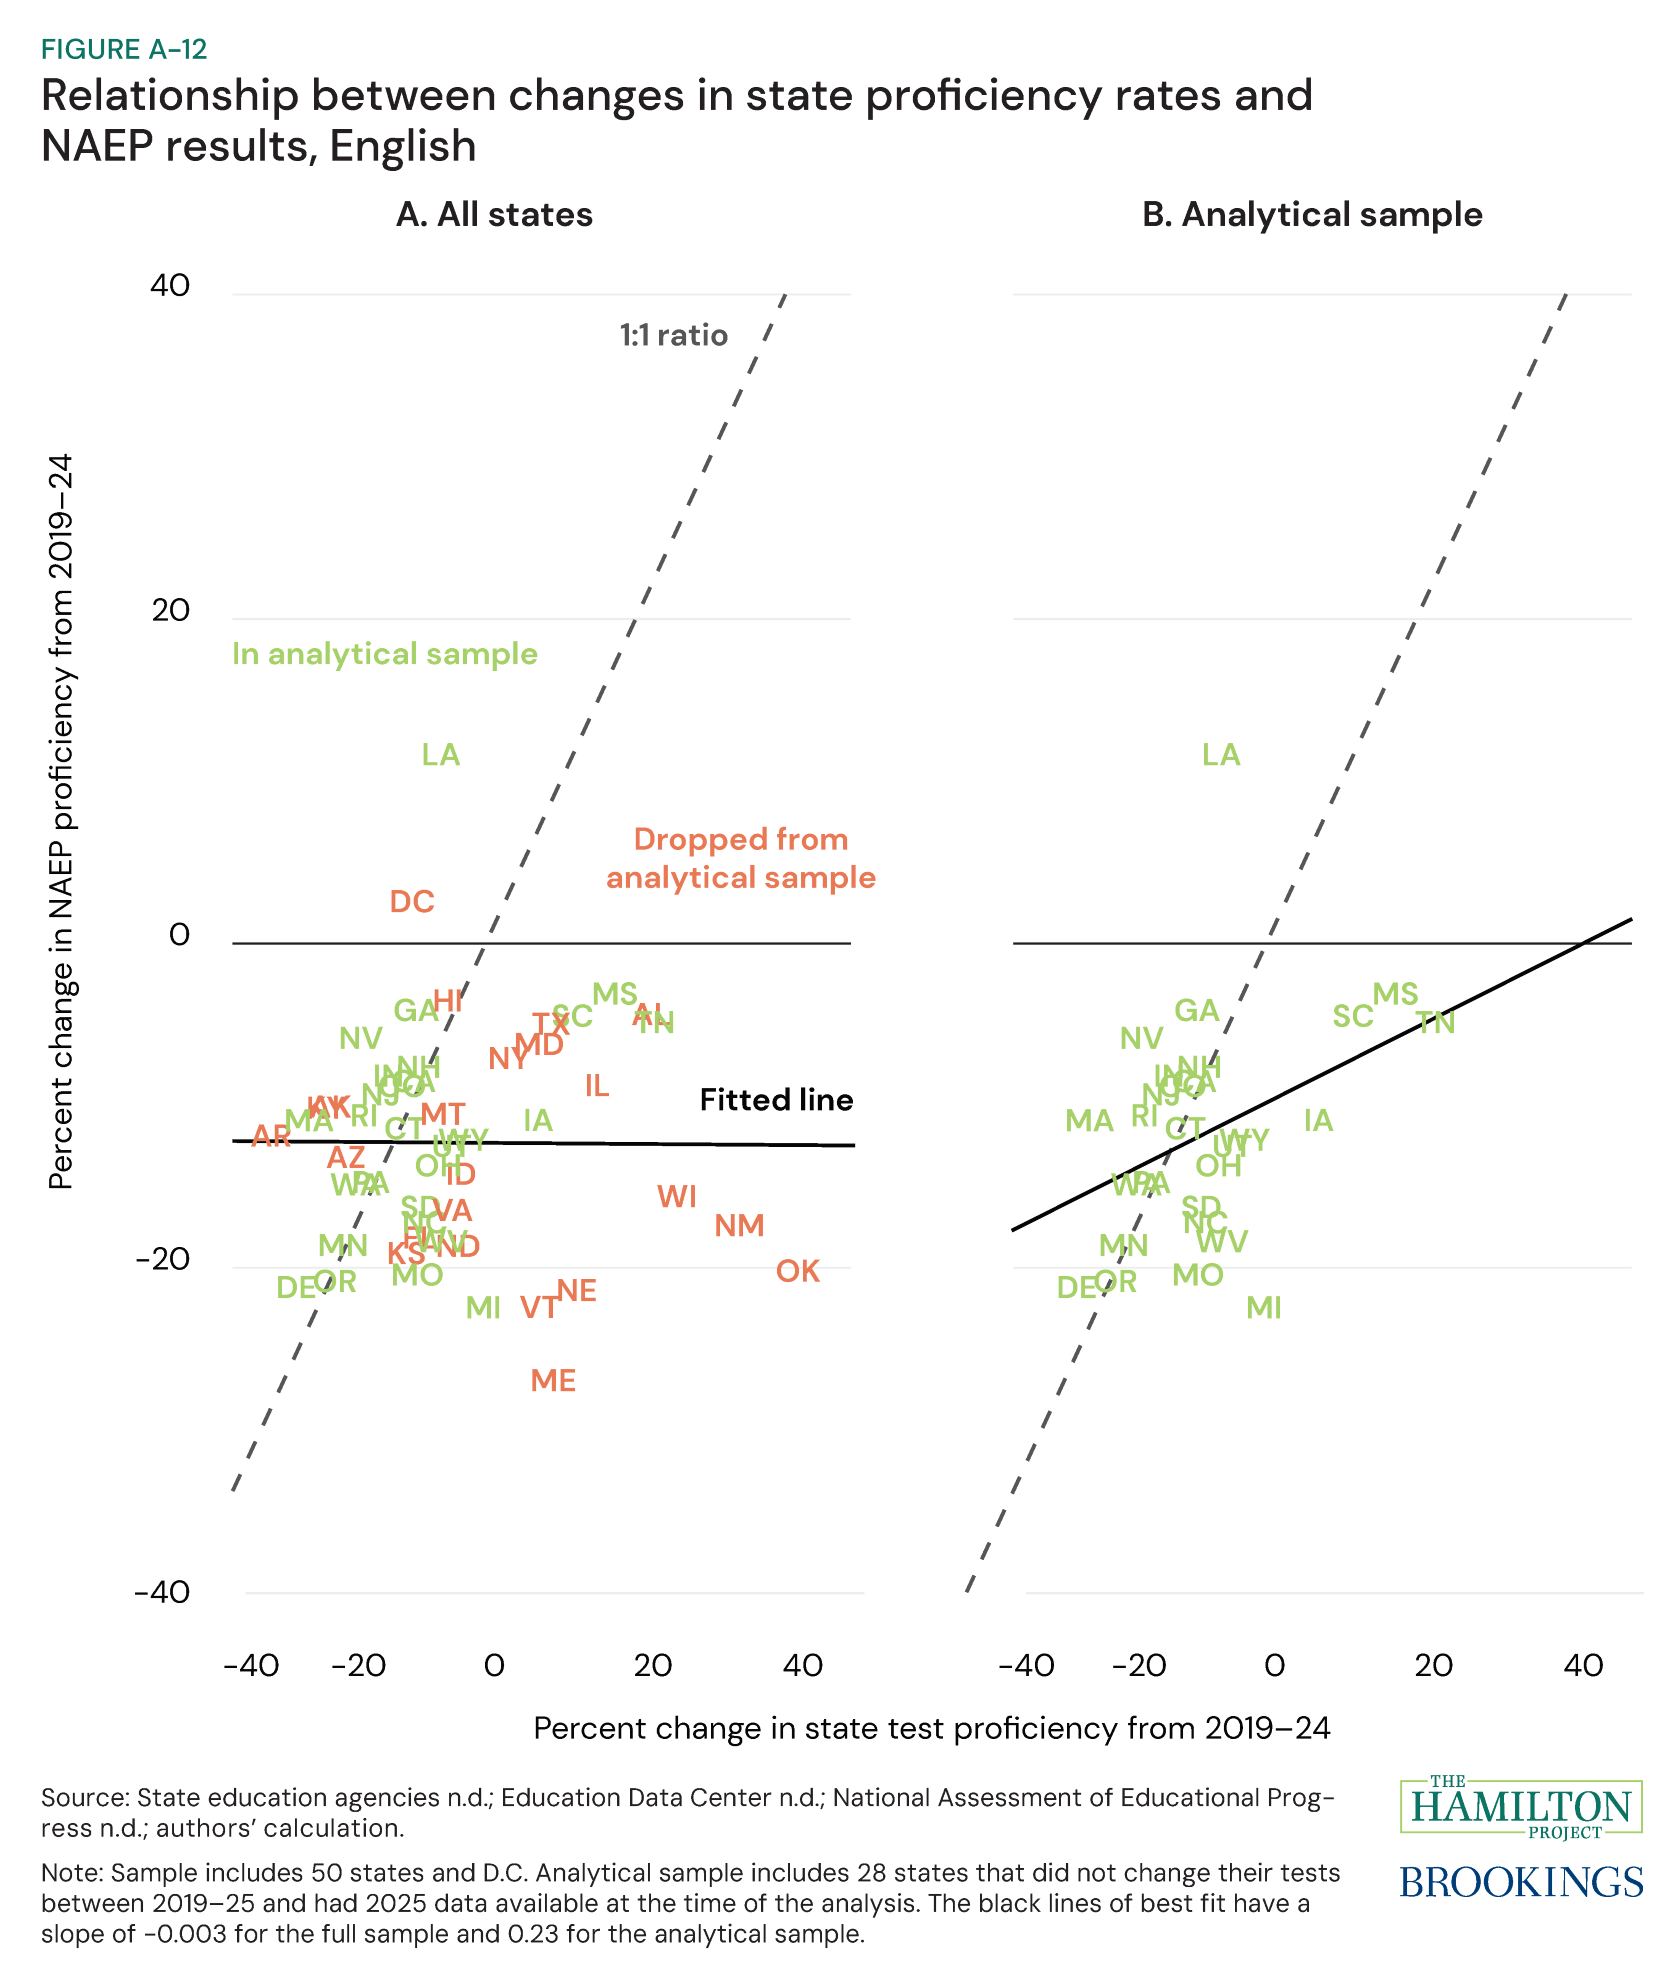
This excludes three states and D.C. that did not change their tests from 2019–24 but had not released data at the time of the analysis or changed their test in 2025. See appendix figures 1–4 for cohort trajectories with the 31 states and D.C. sample through 2024, and appendix figures 5–8 for cohort trajectories for all 50 states and D.C. More information on state test changes and other data flags are available in the technical appendix table. As shown in appendix figures 11 and 12, state test score data are more strongly correlated with NAEP trends when the states that changed their tests in this period are excluded.
For our analysis, we create a grade-by-year variable that indicates the grade a given set of students were during the 2019–20 academic year. We calculate average proficiency rates at the state-by-subject-by-grade-by-cohort level. We measure differences in the trajectory of cohort-based proficiency rates over the course of third to eighth grade as the change in proficiency rates across a given grade level for cohort-impacted cohorts relative to each pre-pandemic counterfactual.

Authors


Related Content

2025

-
Acknowledgements and disclosures
We thank Aviva Aron-Dine, Megan Kuhfeld, Sofoklis Goulas, Este Griffith, Diane Whitmore Schanzenbach, Jon Valant, and especially Sarah Reber for generous feedback on this analysis. Tia Cole and Asha Patt provided excellent research assistance. The accompanying data interactive was developed by Lauren Bauer, Sofoklis Goulas, and Eileen Powell, with substantive research assistance from Jimmy Zheng and Victoria Yan. We thank Jeanine Rees for graphic design support and Tiffany France, Lisa Petrovich, and Kate Wiley for developing the data interactive.
The Brookings Institution is committed to quality, independence, and impact.
We are supported by a diverse array of funders. In line with our values and policies, each Brookings publication represents the sole views of its author(s).