Employers continued to boost payrolls in 2015, capping six straight years of job gains. It was the third year in a row in which employment gains topped 210,000 a month. In the 12 months ending in November, public and private payrolls increased 220,000 a month, or about 1.9 percent over the year. Virtually all the growth in payrolls was in the private sector, which added 212,000 jobs a month. The public sector added modestly to its payrolls last year, but the number of government employees remains more than one million (4.4 percent) below the peak level attained in 2010.
Nearly all major industries except mining contributed to job gains in the past 12 months, though gains in manufacturing were weaker than in any year since the expansion began in 2010. Payrolls in the mining industry tumbled more than 10 percent, hurt by a steep fall in oil and gas prices and the decline in exploration for new energy reserves. The construction industry continued to add to payrolls last year at about the same pace as in the previous two years, although the level of employment is still about 1.2 million (15 percent) below the peak level achieved in 2006.
Based on the age composition of the U.S. population, between 65,000-80,000 new jobs are needed every month to keep the unemployment rate from rising. Since late 2010, monthly payroll gains have comfortably exceeded this threshold. As a result, the jobless rate has declined steadily. In the 12 months through November 2015, the unemployment rate dropped another 0.8 percentage point, falling to 5.0 percent. The jobless rate is now within a half percentage point of its level immediately before the Great Recession. Since reaching a peak in the autumn of 2009, the unemployment rate has been cut in half.
We’ve also seen improvement in other indicators of job market distress in the past year. The number of Americans who want full-time jobs but have been forced to take part-time positions fell more than 11 percent in the 12 months through November 2015. About 9 million workers who wanted a full-time job were employed part-time in the middle of 2010. That number has fallen to about 6 million in recent months. Similarly, the number of Americans in long spells of unemployment continues to shrink. Workers reporting they were unemployed 6 months or longer fell to 2.05 million in November, representing a considerable improvement since 2010. In that year, more than 6 million jobless workers reported they had been looking for work for at least a half a year.
The most welcome news for Americans who hold jobs is that inflation-adjusted wage levels improved last year. Real average hourly earnings increased 1.8 percent between November 2014 and November 2015, and real weekly earnings climbed 1.6 percent. These gains represent a considerable improvement compared with earlier years in the recovery, when real wage gains were negligible. Nonetheless, nominal wage gains in 2015 were only slightly faster than they were in earlier years of the recovery. The reason for the startling turnaround in real wage growth is that consumer prices increased very little over the past year. In the 12 months ending in November, the CPI edged up just 0.5 percent, almost a full percentage point more slowly than the average rate of consumer inflation in the previous three years. The slowdown was driven by lower prices for energy and other key commodities. (The “core” consumer inflation rate, which strips out the effects of price changes in energy and food, was 2.0 percent last year, a bit higher than the rate in the previous year.)
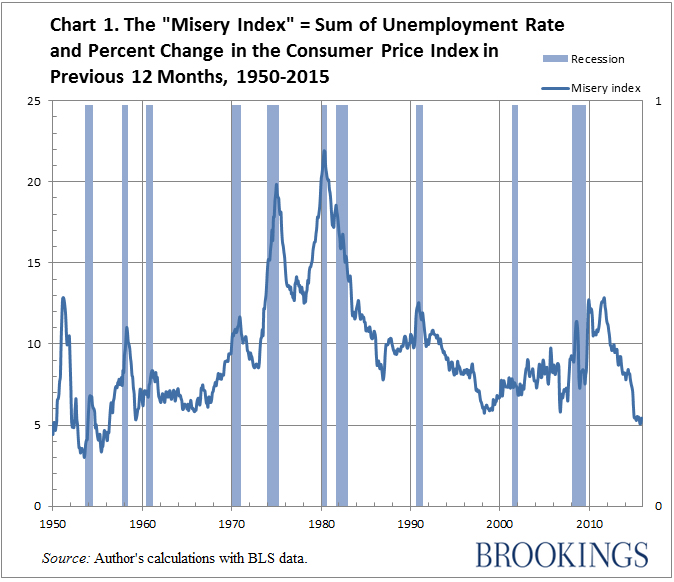
Back when politicians and voters cared more about inflation than they currently do, Brookings economist Arthur Okun proposed an economic indicator called the “misery index” to summarize the dual hardships of inflation and unemployment. To measure economic misery Okun suggested adding the current unemployment rate and a measure of consumer price inflation. In Chart 1 below I have added the civilian unemployment rate and the trailing 12-month percentage change in the CPI. In the 11 months of 2012 through November, the misery index averaged just 5.4, its lowest level since the 1950s and well below its average levels in the 1990s (8.8) and in the period from 2000 to 2007 (7.8). When inflation is benign and has remained subdued for a long time, Americans may forget the pain they feel when price increases are frequent and large. Okun’s misery index fell to an exceptionally low level in 2015, even if a small majority of Americans continues to believe the economy is getting worse.
The good news in 2015 is that unemployment continued to fall and real wages began to rise. The less welcome news is that key measures of labor force participation failed to improve. For example, the labor force participation rate of Americans between 25 and 54 was the same in November 2015 as it was in November 2014. More worryingly, it was 2.1 percentage points below its level in November 2007, just before the Great Recession. So far we have seen no rebound in participation among people in prime working ages, despite abundant signs that it’s easier to land a job.
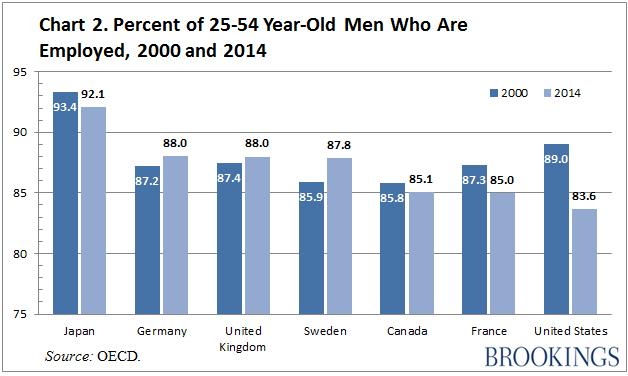
Low participation is the main explanation for depressed employment rates among prime-age Americans. Participation rates are not only low in comparison to levels seen before the Great Recession, they are also now below those in other rich countries. Charts 2 and 3 compare employment-to-population rates among 25-54 year-olds in seven OECD member countries (Canada, France, Germany, Japan, Sweden, the United Kingdom, and the United States). The charts show employment rates separately for men and women in two different years, 2000 and 2014. The countries are ranked, from left to right, by their employment rates in 2014. In 2000 the U.S. had the second highest male employment rate (Chart 2) and the second highest female employment rate (Chart 3) of the seven countries listed. By 2014, the U.S. had the lowest male and female employment rates among the countries compared. Although several nations saw declines in their prime-age male employment rate, only the U.S. also experienced a decline in its prime-age female employment rate. The other six countries all saw increases in female employment.
The main reason for the drop in prime-age U.S. employment was the decline in prime-age participation. An enduring puzzle of the current recovery is the failure of participation rates to rebound, even in the face of steady improvement in the job market.
The Brookings Institution is committed to quality, independence, and impact.
We are supported by a diverse array of funders. In line with our values and policies, each Brookings publication represents the sole views of its author(s).


Commentary
Op-edJob market news just keeps getting better
December 21, 2015