Developments in Japan have been front-page news in recent weeks. In a move widely attributed to concerns about sales of U.S. Treasury securities by Japan in an environment of rising U.S. long-term interest rates, the U.S. Treasury intervened in financial markets alongside the Bank of Japan to stem the ongoing depreciation of the yen.
While the U.S. intervention was very modest in size, Japan’s intervention was much more substantial: according to the Japanese Ministry of Finance, foreign exchange intervention during the period July 30 to August 26 was $97 billion, and during April 28 to May 27, it was $74 billion. While we don’t yet have U.S. data on transactions in Treasury securities for the month of August, data for May 2026 show that Japanese residents sold $60 billion in Treasury bills and some $2.8 billion in Treasury bonds.
This post makes three points from a longer-term perspective. First, the real exchange rate of the yen is extraordinarily weak. The large depreciation that took place after the COVID pandemic came on top of a hefty decline during the previous two decades. Second, the weight of Japan in the global economy has dropped very sharply during the past 25 years, a result of modest per capita growth, a shrinking population, and exchange rate depreciation. Third, Japan’s external creditor position, while still the third largest in absolute terms, has shrunk in relative importance and in relation to U.S. or world GDP. In regard to the U.S., Japan remains an important creditor, but far less so than two decades ago.
The real exchange rate
Figure 1 shows the value of the yen vis-à-vis its main trading partners, both in nominal terms and adjusted for differences in the relative rates of inflation (so that we are looking at changes in the purchasing power of the currency over the horizon being examined). The chart underscores the dramatic depreciation of the real effective exchange rate, virtually unprecedented among advanced economies: over 60% relative to the end of 1999, and 34% relative to its mid-2020 level. Taking a longer time perspective, the yen is 44% weaker relative to its average over the period 1980–2026.

The depreciation of the nominal exchange rate is also notable (36%), but a sizable part of the real depreciation is accounted for by the much lower rate of inflation in Japan relative to its trading partners. Between end-1999 and June 2026 prices in Japan rose by a cumulative 16%, vis-à-vis 98% in the U.S., 78% in the euro area, and 66% in China. Under these circumstances, constant purchasing power would have called for a large yen appreciation in nominal terms—but the opposite happened.
What factors help explain the extreme weakness of the yen? Some real depreciation relative to its 2000 level can be attributed to long-term fundamental factors such as a deterioration in the terms of trade, declining productivity growth relative to trading partners, and demographics. Divergence in the monetary policy stance compared to other major advanced economies—in principle a shorter-term factor—was clearly at play in different periods. For instance, the yen depreciated sharply with rising interest differentials relative to other advanced economies in the aftermath of the COVID pandemic, as Japan’s trading partners tightened monetary policy, but Japan did not. During this period, global risk appetite has generally remained strong, and under those circumstances, low interest rates make the yen a desirable funding currency for carry trades (investment in financial instruments denominated in higher-yielding currencies), driving down its value relative to currencies with higher interest rates. Those trades are typically unwound when volatility rises, resulting in yen appreciation (for instance in the aftermath of the Russian debt default of 1998 and during the global financial crisis of 2007–2009).
But even taking these factors into account, the magnitude of the real depreciation is still staggering, and its most recent bout is harder to explain, as argued for instance in the most recent IMF report on Japan: indeed, as of mid-September the interest rate differential on 10-year government bonds between the U.S. and Japan is about half its size in late 2023. Over a longer time horizon, the magnitude of fluctuations in the yen and the difficulty of explaining them with standard macroeconomic variables was already highlighted by Obstfeld (2010) in his discussion of the yen evolution during the period 1985–2008. It is also notable that Switzerland, another advanced economy with interest rates well below those of its trading partners (and well below Japan now), also characterized by large current account surpluses and sizable net foreign assets, has actually experienced sizable real appreciation since 2000.
Economic size
Japan is often depicted as a low-growth advanced economy: in per capita terms it has grown below 1% a year on average since the end of the 20th century, roughly in line with other advanced economies such as France, Germany, the United Kingdom, or Canada. Relatively weak per capita growth, a shrinking population, and especially the dramatic real depreciation of the yen highlighted earlier have led to a massive reduction in Japan’s weight in the global economy. According to IMF data, Japan accounted for about 14.7% of global GDP at market exchange rates in 2000, while its share in 2025 was only 3.8% (Figure 2). The decline in the relative size of Japan’s GDP was also affected by substantial terms of trade losses: since the last quarter of 1999 its GDP deflator (the price of its output) has increased by over 10 percentage points, less than its consumer price index (which is used in real exchange rate calculations) since inflation was mostly due to rising prices of imports, such as energy. The decline in Japan’s share of global GDP evaluated at purchasing power parity between 2000 and 2025 was also large, even though more modest (6.8% to 3.3%), and Japan’s share of world exports of goods and services also plummeted, from 6.7% to 2.8%.

Japan’s creditor position
Japan has run uninterrupted current account surpluses since 1981, and accumulated a sizable external creditor position, exceeding 80% of its GDP at the end of 2025 (Figure 3, orange line). But how important is Japan’s creditor position globally? From 1991 until 2024, Japan was the world’s largest external creditor. It accounted for 39% of global net creditor positions in 2000, and 29% in 2010. In subsequent years, creditor positions in Germany, China, and Middle Eastern oil exporters among others grew rapidly, and Japan’s share of global creditor positions gradually declined. Indeed, by 2025, its share was down to 11% and both Germany and China had become larger creditors in absolute terms. The blue line in the figure provides a sense of the decline in the global importance of Japan’s net creditor position, scaling it by U.S. GDP: around 2010, Japan’s creditor position was around 20% of U.S. GDP, and by 2025, it had declined to about 12%. Again, the real depreciation of the yen plays a crucial role in explaining the divergence between the orange and blue lines in the figure.
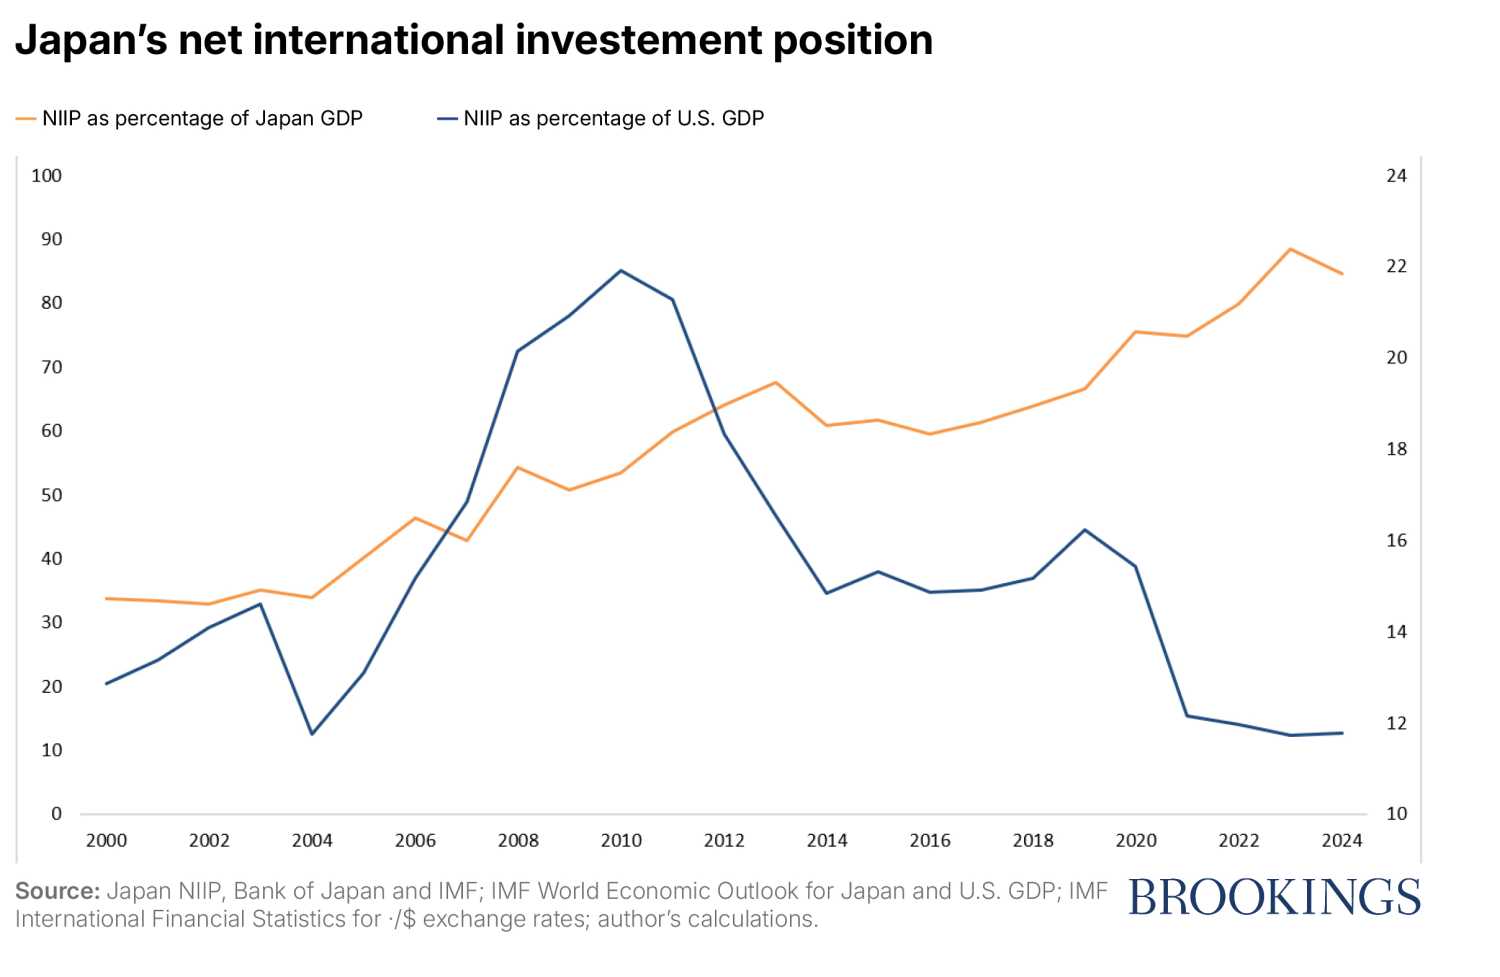
The decline in the global importance of Japan as a creditor nation is particularly relevant for the United States given that a sizable share of Japanese external assets are claims on U.S. entities. At the end of 2025, according to Japanese statistics about half of Japan’s portfolio investment (some $2.46 trillion) and about a third of its foreign direct investment ($828 billion) were in the United States. Furthermore, the vast majority of Japanese foreign exchange reserves, whose currency composition Japan does not disclose, is likely to be held in U.S. dollars, mostly in Treasury securities. Indeed, the U.S. intervention in support of the yen in July 2026 was widely interpreted as an attempt to prevent large sales of U.S. securities by Japanese authorities to support their currency at a time when long-term interest rates on Treasury securities are rising. Trade considerations, related to the weakness of Asian currencies, are also likely to have played a role.
But while these Japanese holdings are large in absolute terms and relative to the size of its economy, they are a declining share of foreign investment and of securities outstanding in the United States. For instance, the share of marketable U.S. Treasury securities held by Japan, which had reached 17% in 2004, fell below 4% in May 2026 following hefty sales of U.S. Treasury bills to support the yen. Large sales of U.S. Treasury securities by Japanese investors can still have a meaningful impact on financial markets, particularly at times of uncertainty and rising volatility, but their role has waned relative to other holders of U.S. Treasury securities, such as Cayman-based hedge funds.
Author

Global Currents
The Brookings Institution is committed to quality, independence, and impact.
We are supported by a diverse array of funders. In line with our values and policies, each Brookings publication represents the sole views of its author(s).
Commentary
Japan’s exchange rate and creditor status: A longer-term view
September 22, 2026