Executive summary
This paper analyzes whether China has been circumventing U.S. tariffs on Chinese products via three pathways: transshipments through Mexico and Canada, incorporation of Chinese products into North American supply chains, and investment into Canada and Mexico. This paper finds that there is evidence pointing to China circumventing U.S. tariffs and entering the U.S. market mainly via Mexico, with some evidence of circumvention via Canada. The paper also looks at whether Chinese goods have entered the U.S. market via Mexican or Canadian imports from Southeast Asia, and finds evidence consistent with this more extended form of circumvention. The paper also adjusts the trade data to take into account price increases to ensure that increases in trade were driven by more than just increases in prices. Once price increases are taken into account, there remains evidence consistent with circumvention, though the extent of circumvention was much reduced overall and, in some cases, evidence of circumvention largely disappears for some of the products analyzed in this paper.
Trade relations between the U.S., Canada, and Mexico on the one hand, and with China on the other, are the world’s most consequential. Trade within North America is valued at over $1.7 trillion and supports around 17 million jobs.1 The U.S. is the key destination for Mexican and Canadian exports, comprising over 80% of Mexican goods exports and over 75% of Canadian exports in 2024. Approximately 22% of U.S. exports in 2024 went to Canada and Mexico.2 China is also a major trading partner for the U.S., Mexico, and Canada. In 2024, China was the fourth-largest goods trading partner of the U.S. valued at $582.5 billion in total trade, the second-largest trading partner of Mexico, valued at approximately $139.94 billion in total goods trade, and the second-largest trading partner of Canada, valued at over $93 billion in goods trade.
Since 2018, the U.S. has imposed and ratcheted up tariffs on a broad range of Chinese imports. U.S. tariffs on China have created incentives for Chinese products to circumvent these tariffs by entering the U.S. via Canada and Mexico, paying either the United States-Mexico-Canada Agreement (USMCA) tariff rate of zero or the U.S. WTO Most-Favored-Nation (MFN) rate, which has been well below U.S. tariffs on China. Chinese circumvention of U.S. tariffs undermines the U.S. policy of reducing economic integration with China and addressing the impact of China’s imports on U.S. manufacturing. This paper analyzes the extent of Chinese circumvention of U.S. tariffs up until the end of 2024. Since President Donald Trump came into office in 2025, he has raised tariffs further on imports from China and (but to a lesser extent so far) on imports from Canada, Mexico, and other countries as well. At the time of writing, U.S. tariffs were in flux, but the end result will most likely be U.S. tariffs on imports from China that continue to be higher than U.S. tariffs on imports from Canada and Mexico, thereby maintaining the incentive for circumvention.
This paper analyzes three ways that Chinese products can circumvent U.S. tariffs:
- Transshipment, which occurs when an import from China passes through Mexico or Canada on its way to the U.S.
- Incorporation of Chinese products into North American supply chains. This includes manufacturing in Mexico and Canada to produce products that are then exported to the U.S.
- Chinese foreign direct investment (FDI) into Mexico and Canada to produce goods that are then exported to the U.S.
Transshipment of Chinese goods via Mexico or Canada into the U.S. that do not undergo sufficient transformation required to qualify under USMCA, yet claim the lower USMCA tariff, is illegal. However, other opportunities for Chinese circumvention of U.S. tariffs are often not in breach of USMCA. For instance, incorporation of Chinese inputs into manufacturing in Mexico or Canada, which produces goods, can be exported to the U.S. at zero tariffs where they comply with USMCA Rules of Origin (ROOs) or pay the WTO MFN tariff rate. Similarly, Chinese companies can invest in Mexico or Canada and export their product, made in Mexico or Canada, to the U.S. The point is that circumvention is often less about illegal activity than it is about a changed political tolerance for trade with China.
How to address the incentives for circumvention created by U.S. tariffs on China is therefore less about better enforcement of existing trade rules and instead about new approaches. For the U.S., the central policy choice is whether to apply the tariffs that it applies to China to imports from Canada and Mexico or to work directly with Canada and Mexico to align on China tariffs and restrictions on Chinese foreign investment. The latter approach is the better one for the U.S., Canada, and Mexico, given the integration of supply chains across North America. Developing a North American approach to China will also strengthen the U.S. position when it comes to competition with China.
The good news is that Mexico and Canada also see Chinese circumvention of U.S. tariffs via their markets as a serious issue. For example, Mexico and Canada have increased tariffs on a range of iron and steel imports, Mexico has removed tariff breaks on electric vehicles (EVs) from non-free trade agreement (FTA) countries and has said it will raise tariffs on automobiles from China to 50%. Canada has imposed 100% tariffs on imports of EVs, aligning with the U.S. tariffs. However, more will be needed. In part because the range of products that could be circumventing U.S. tariffs is broader, and because the means by which Chinese products can enter the U.S. extends beyond trade to include Chinese investment.
The upcoming review of USMCA by July 2026 presents an important opportunity for the three countries to address concerns about Chinese circumvention. The following are the key findings regarding Chinese circumvention of U.S. tariffs.
Transshipment
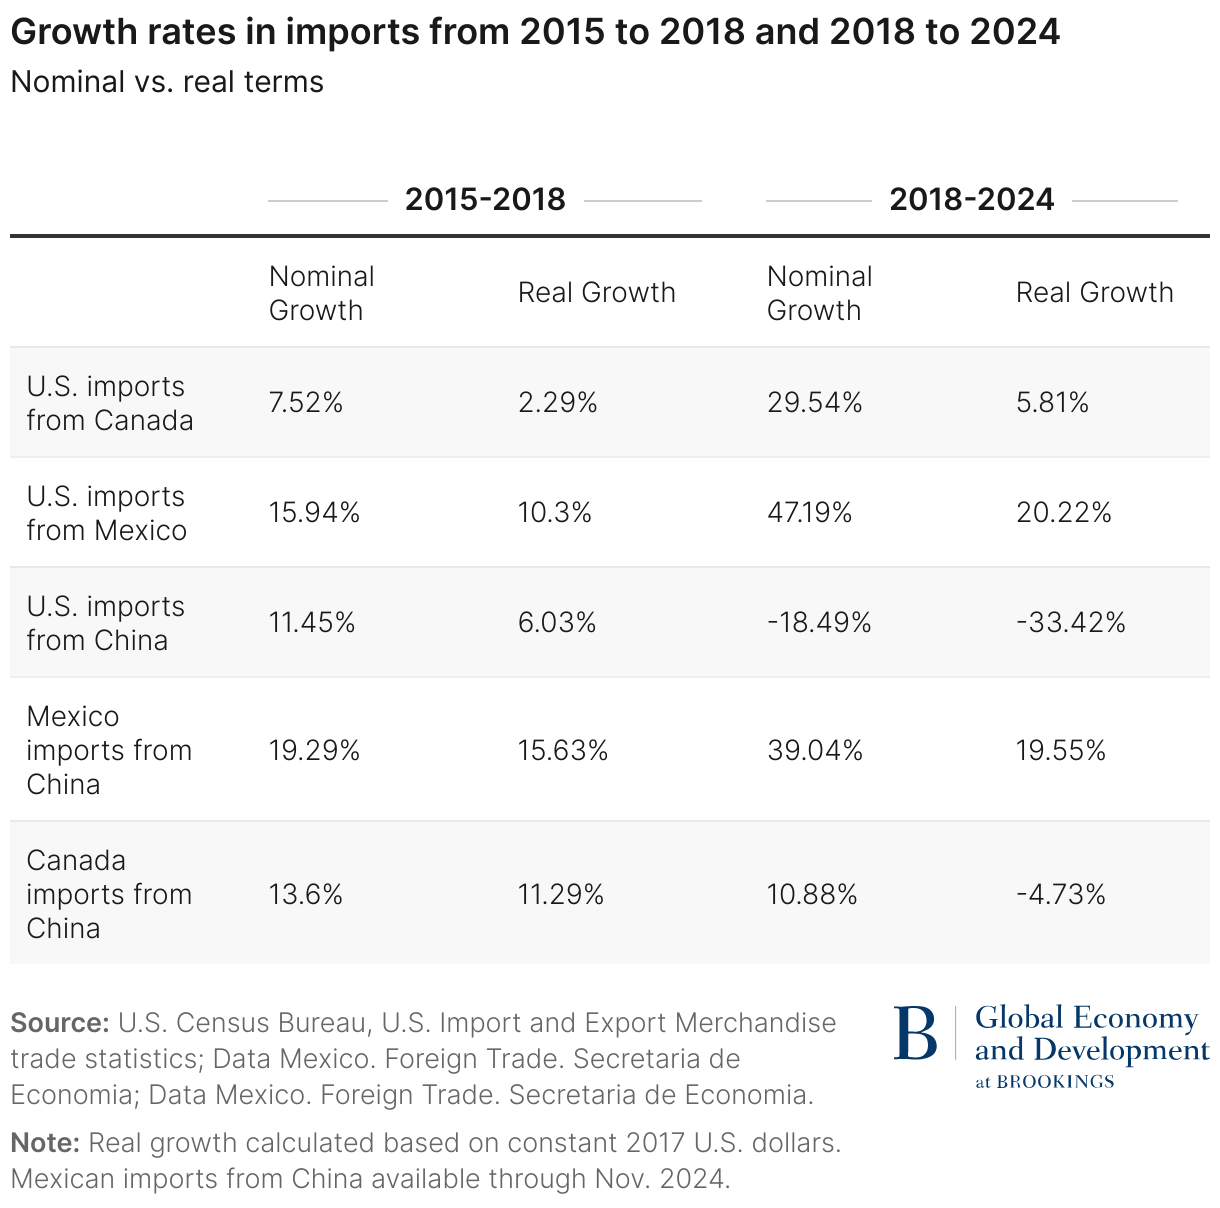
One way to assess transshipment is to look at changes in growth rates of imports pre- and post-U.S. tariffs on China. Table 1 compares nominal growth rates in imports pre- and post-tariffs, as well as growth rates adjusted for inflation. Based on this initial high-level comparison of changes in rates of imports pre- and post-U.S. tariffs, the data do point to transshipment of Chinese products via Mexico but suggests that there has been little to no transshipment happening via Canada.
This paper then explores whether there has been transshipment in three specific product categories that raise economic and national security concerns for the U.S., and which are subject to higher U.S. tariffs on imports from China.
- Power transformers, static converters, and inductors (HS 8504): This paper finds that since 2018 tariffs came into effect, higher growth rates of Mexican imports from China as well as U.S. imports of these products from Mexico point to transshipment. Recent declines in Mexican imports from China of these products could point to less transshipment, but this could also be caused by Chinese products entering Mexico via counties in Asia as China expands manufacturing in that region. There is no evidence of these products circumventing U.S. tariffs via Canada.
- Iron and steel (HS 7208-7212, 7225, and 7226): These data do point to Chinese steel circumventing U.S. tariffs and entering the U.S., primarily via Mexico. Yet, when adjusting for inflation, the level of transshipment was relatively low. In addition, Mexico’s imports of iron and steel from China have declined around 50% since 2023, which may reflect the impact of Mexico’s increased tariffs on these imports, underscoring how trade policy can be used to address Chinese circumvention of U.S. tariffs.
- Parts and accessories of motor vehicles of headings 8701-8705 (HS code 8708): The data are mixed but also points to potential transshipment and/or greater use of Chinese inputs in auto supply chains. Following the 2018 U.S. tariffs on China, there were growing U.S. imports of auto parts from Mexico and Canada as well as increased Mexican and Canadian imports of these products from China. However, when adjusting for inflation, there is little to no evidence of circumvention happening via Canada. Moreover, the growth in Canadian and Mexican imports from China was relatively small compared to U.S. imports of auto parts from Canada and Mexico.
Circumvention via supply chains
Chinese intermediate goods used in manufacturing can avoid the United States’ China tariffs by first being imported into Canada or Mexico and incorporated into manufacturing in those countries before being exported to the U.S. Imports that then undergo a substantial transformation and lead to the production of new goods are considered as made in that country when exported. Whether a product can enter the U.S. under USMCA zero tariffs or pay the WTO MFN tariff rate will depend on whether the export complies with USMCA ROOs.
The most recent data on intermediate goods imports for North America are only until 2022. From 2018 to2020, there were declining Canadian and Mexican imports of intermediate goods from China. However, from 2020 to 2022, Canada’s imports of intermediate goods from China grew by over 80%, and Mexico’s imports of intermediate goods grew by over 100%. Data on the use of Chinese intermediate goods for export show that in 2020 (latest data available) around one-third of Mexico’s exports comprised Chinese value added, and this percentage of Chinese value added grew from 2016 to 2018 and remained stable over 2018 to 2020 despite declining Mexican imports of intermediate goods from China. China’s value added in Canada’s exports also grew from 2016 to 2018 and then remained stable during 2018 to 2020, but at their peak comprised only around 10% of the value of Canada’s exports, whereas Chinese value added in Mexican exports was over 30%. In contrast, Chinese value added in U.S. exports declined from over 26% in 2018 to around 20% in 2020. Together, these data point to ongoing use by Canada and Mexico of intermediate goods from China in supply chains and for export.
Foreign direct investment
FDI is a third way through which Chinese companies can circumvent U.S. trade restrictions. Foreign companies that invest in the U.S., Mexico, or Canada are deemed as having the nationality of that country, and their products are deemed as made in that country. Data on Chinese FDI in Mexico are mixed. Some data show Chinese FDI into Mexico at around $1.5 billion to $2 billion annually. However, data compiled by Rhodium Group based on deals announced point to higher Chinese FDI into Mexico in 2023 with newly announced investment reaching $3.77 billion in 2023, most of it in greenfield investments. Rhodium Group’s China Cross-Border Monitor (CBM) also reported a similar trend in the first half of 2024. Despite the growth in Chinese FDI into Mexico, it remains relatively low at around 0.1% of GDP. In the case of Canada, Chinese FDI has decreased from approximately $1.6 billion in 2018 to approximately $0.4 billion in 2023 and remains below 0.02% of GDP. In contrast, the U.S. is Canada and Mexico’s top foreign investor.
1. Introduction
The U.S. and China are at the center of rising geopolitical tensions as China challenges U.S. power across the economic, military, and technology domains. These sources of U.S. power are interlinked, as leading in technology and innovation drives economic growth, which also underpins military capacity. The pandemic also highlighted the risks to the U.S. of relying on China for medical equipment, and the speed at which automobile supply chains buckled in response to shortages of semiconductors underscored the risks of too few suppliers of critical products.
The U.S. has responded to the need to reorder supply chains and reduce its economic exposure to China with tariffs on Chinese imports, export controls on critical technologies, stricter review of Chinese inbound investment by the Committee on Foreign Investment in the United States (CFIUS), and new regulations on outbound investments. Under Trump’s second administration, there have been higher tariffs, tighter export controls, and further restrictions on Chinese investment in the U.S. The focus of this paper is on the extent that Chinese products are circumventing U.S. tariffs by entering the U.S. market via Canada and Mexico, and what this means for the USMCA.
Since tariffs on imports from China were first implemented by Trump in 2018, imports from China decreased by almost 18.5% from approximately $538.5 billion to about $438.9 billion. Since coming into office, Trump has imposed a series of new tariffs on China and most of its other trading partners. While the ultimate U.S. tariff rates on imports from China, Mexico, Canada, and other countries are unclear at the time of writing, it is anticipated that the outcome will be that imports from Canada and Mexico under USMCA will retain their preferential access to the U.S. market, retaining the incentive for circumvention analyzed in this paper.
Chinese circumvention of U.S. tariffs can occur in three ways. One is transshipment—when Chinese goods enter Canada and Mexico and are then shipped to the U.S. The second is by incorporating Chinese products into North American supply chains. The third way is via Chinese investments in manufacturing facilities in either Mexico or Canada, which then export their products to the U.S.
The question of whether and to what extent China is circumventing U.S. tariffs via Mexico and Canada was a focus for the Biden administration and is a focus as well for the Trump administration.
Mexico and Canada have started working with the U.S. to address Chinese circumvention. For instance, in July 2024 President Joe Biden and former President Andrés Manuel López Obrador agreed to coordinate on tariffs on imports of steel and aluminum from China. In October 2024, Canada placed 100% tariffs on imports of EVs from China and 25% tariffs on imports of Chinese steel and aluminum, matching U.S. tariffs on these products at the time. These are important steps, but more will be needed to fully address circumvention concerns. The upcoming review of USMCA is an opportunity to do more.
While the issue of Chinese circumvention of U.S. tariffs on trade with China is receiving growing attention, there is little analytical work to understand the ways circumvention is happening, its extent, and the policy issues at stake. This report is a first step at answering these questions. Our analysis shows that Chinese products have likely circumvented U.S. tariffs and entered the U.S. market either via Mexico or Canada via all three channels. However, when adjusting for inflation, levels of circumvention are significantly lower, particularly when it comes to Canada. The rest of the paper is structured as follows: Section 2 provides the context in which the topic of discussion unfolds. Section 3 assesses the three ways through which circumvention can occur, including an analysis focused on products in three HS codes at the 4-digit level (subsection 3.1), supply chain integration (subsection 3.2), and FDI (subsection 3.3). Section 4 concludes.
2. Setting the scene
Trade relations between the U.S., Canada, and Mexico on the one hand, and with China on the other, are the world’s most consequential ones. Trade and investment across the U.S., Canada, and Mexico were first governed by the North American Free Trade Agreement (NAFTA), which came into effect in 1994, and by USMCA since July 2020. Trade within North America is valued at over $1.7 trillion and supports around 17 million jobs.3 The U.S. is the key destination for Mexican and Canadian exports, comprising over 80% of Mexican goods exports and over 75% of Canadian exports in 2024. Approximately 22% of U.S. exports in 2024 went to Canada and Mexico.4
China is also a major trading partner for the U.S., Mexico, and Canada. In 2024, China was the fourth-largest goods trading partner of the U.S. valued at $582.5 billion in total trade, the second-largest trading partner of Mexico, valued at approximately $139.94 billion in total goods trade, and the second-largest trading partner of Canada, valued at over $93 billion in goods trade in 2024.
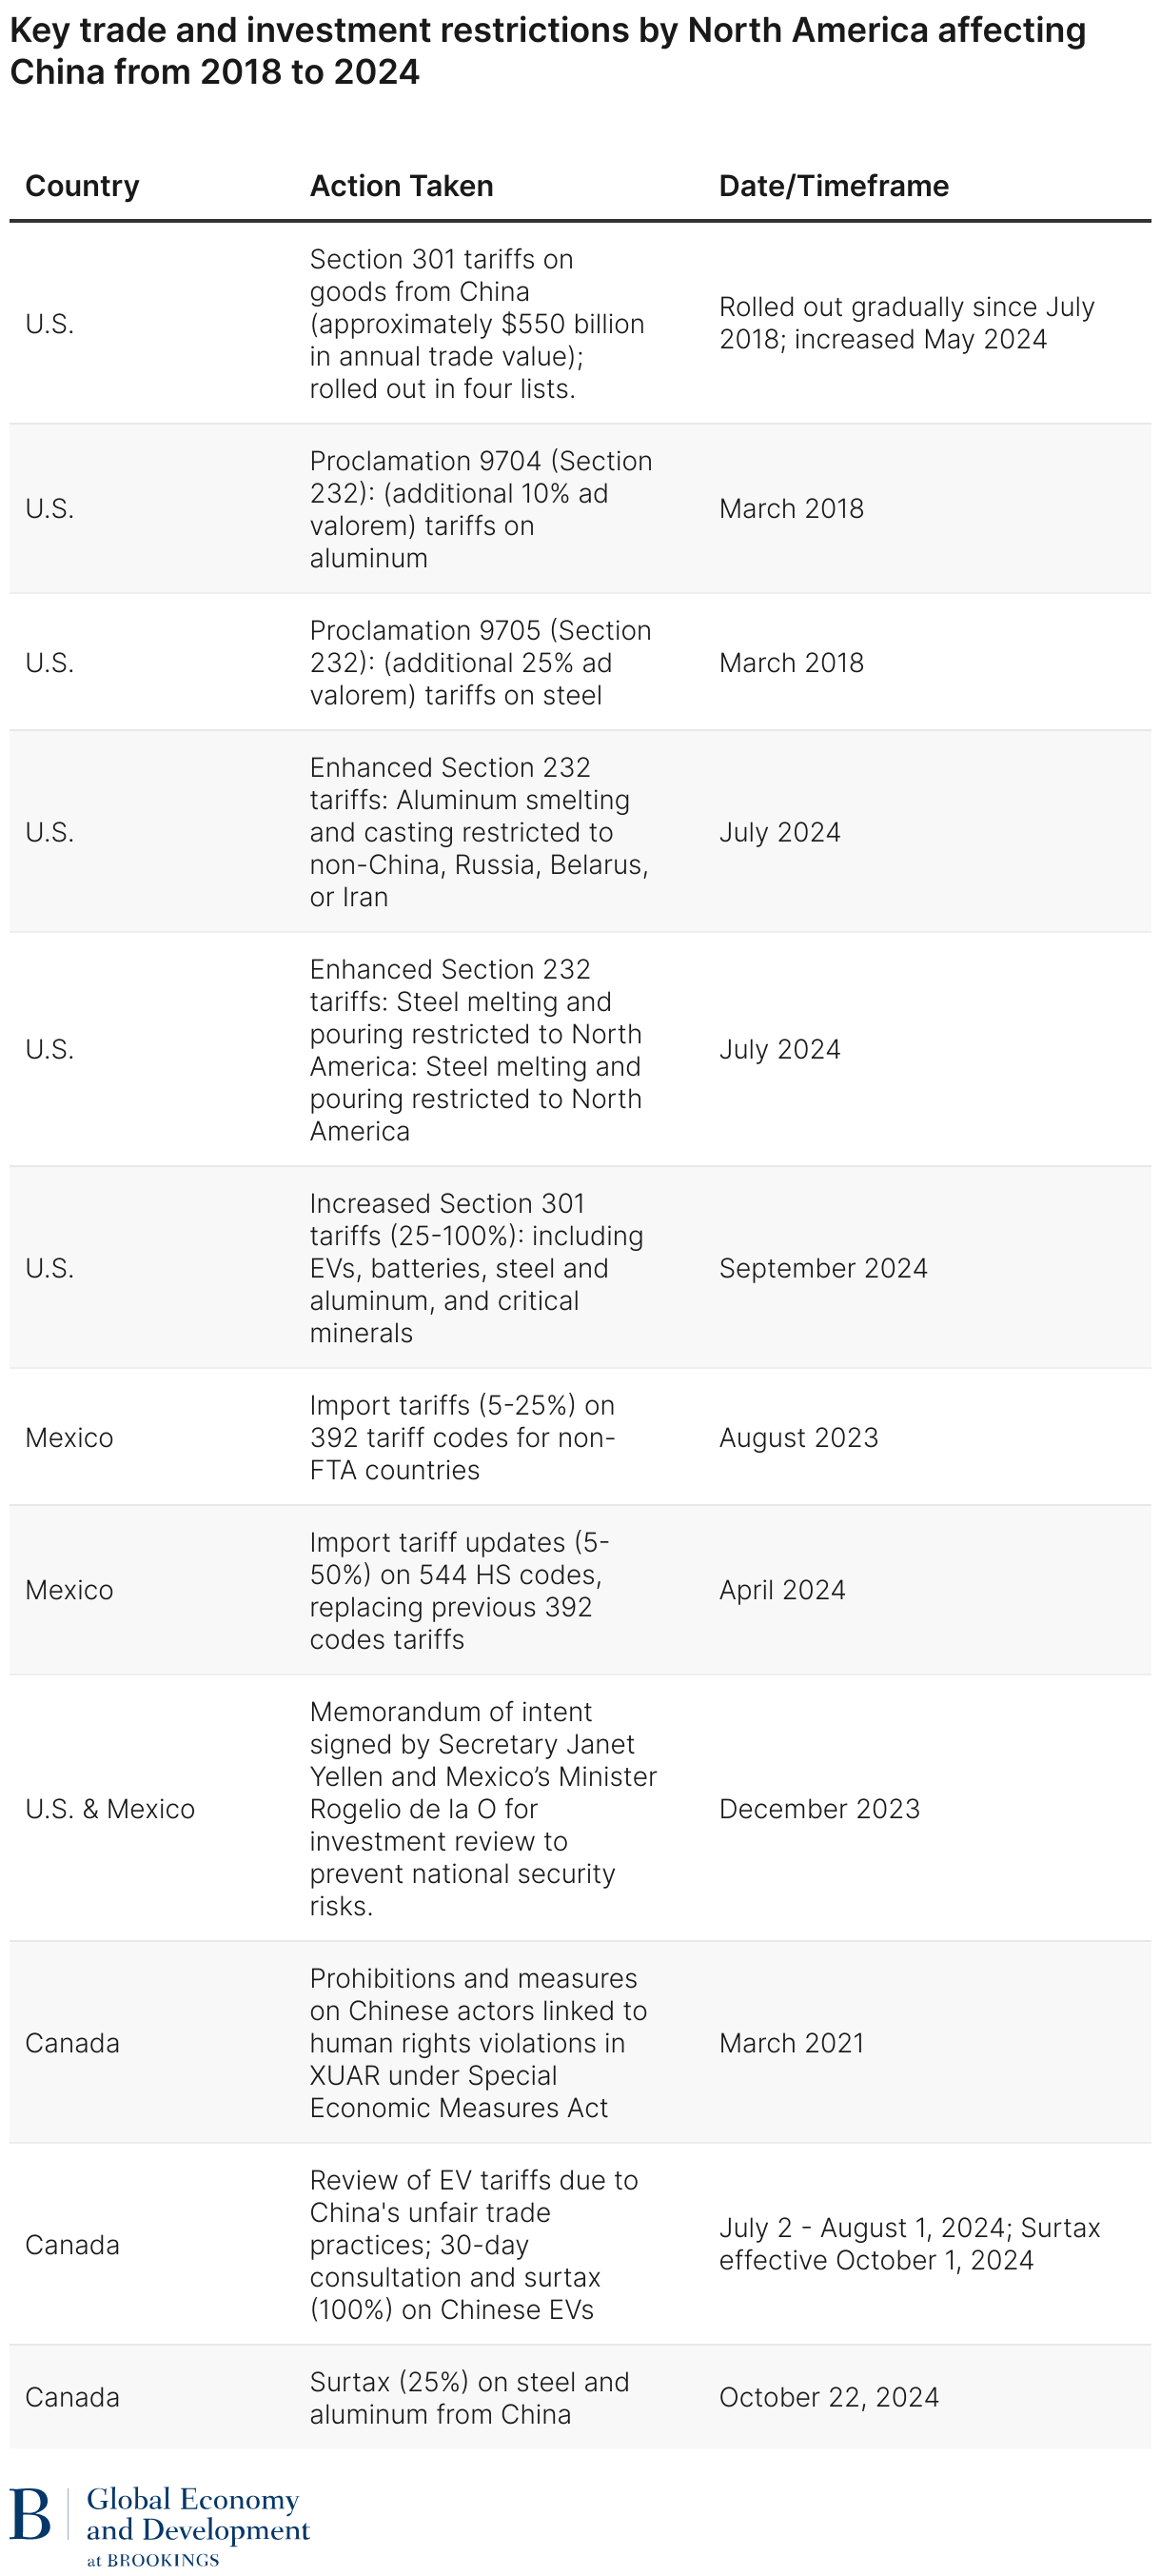
This paper focuses on circumvention that occurred up until the end of 2024. The following table outlines key trade and investment policies taken by each country toward imports from China. The first four months of Trump’s second term have included constant changes to the tariff regime with China and other trading partners. These tariff changes are being tracked by the USMCA initiative.
A combination of higher U.S. tariffs on China and the impact of COVID-19 has led to changes in U.S. trade relations with Mexico, Canada, and China as a share of U.S. GDP. Figure 1 shows a decline in imports from China following implementation of 2018 tariffs, and growth in trade with Mexico and Canada has led to Mexico overtaking China in 2023 as the United States’ largest source of imports.

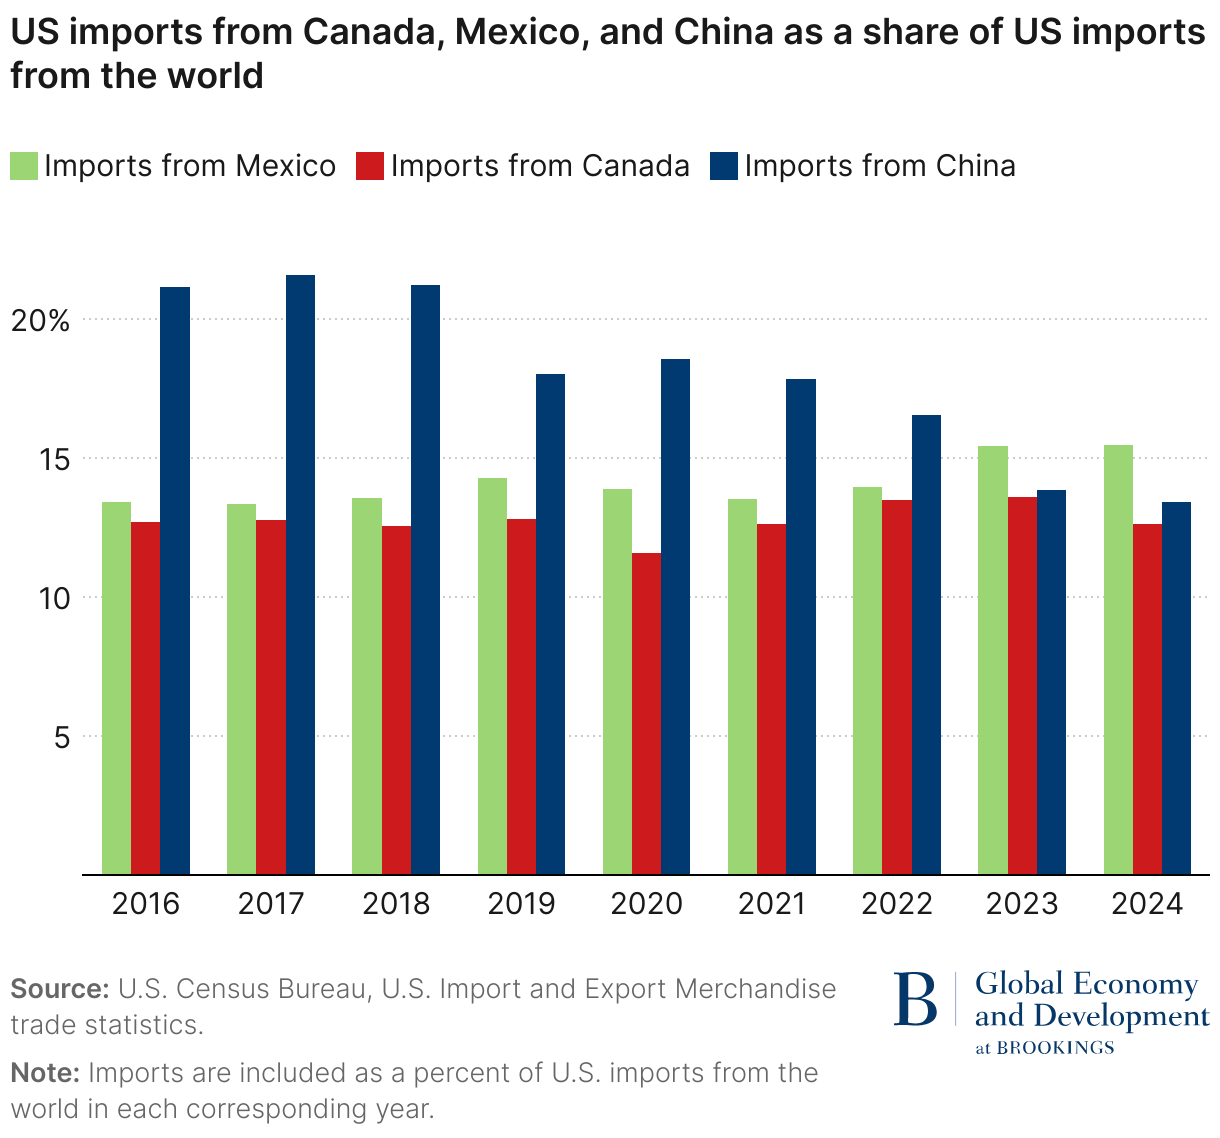
Figure 2 builds on this picture of the changing composition of U.S. trade and shows U.S. imports from Mexico, Canada, and China as a share of total U.S. imports. As can be seen, following tariffs, imports from China have been declining as a share of total U.S. imports, while U.S. imports from Canada and especially Mexico have been growing as a share of total U.S. imports. These trends could support the conclusion that tariffs are leading to diversification of supply chains away from China and increasing the reliance on Mexico in particular as an alternative source of imports. However, the reality is potentially more complicated and likely overstates the extent to which the U.S. has reduced its reliance on imports from China. To take one example, declining trade with China and growing imports from Mexico could also point to the issue of circumvention raised previously in this report, where a rise in imports from Mexico could mask some level of Chinese imports entering the U.S. via Mexico.
3. Assessing the extent to which Chinese products might enter the US via Mexico or Canada
Rising U.S. trade with and investment restrictions on China have created incentives for Chinese exporters to enter the U.S. market via third countries. Mexico and Canada have been natural entry points given zero tariffs on USMCA-compliant trade. Even where the goods cannot meet USMCA ROOs and receive the USMCA preferential tariff rate, the U.S. applied MFN rate relative to U.S. China tariffs has been low enough to continue to create incentives for circumvention.
There are three ways in which Chinese products might seek to avoid U.S. trade restrictions by entering the U.S. market via Mexico or Canada—transshipment, supply chain integration, and FDI. The following analyzes each in more detail.
3.1 Transshipment
Transshipment is defined by the World Customs Organization as the process by which “goods are transferred under Customs control from the importing means of transport to the exporting means of transport within the area of one Customs office.” Typically, in order for a Chinese import into Mexico to enter the U.S., be shipped to the U.S., and be classified as made in Mexico, the good would have to undergo a “substantial transformation,” which requires a change of the name, character, or use from the article prior to processing. The intuition here is that combining various different inputs to produce a new good should allow for the good to be considered as something new and made in that country. When there is substantial transformation, there is no longer transshipment. Instead, it is a matter of using Chinese inputs in supply chains to produce another product—a form of circumvention analyzed in the next section. Where products from China are imported into Mexico or Canada and after little or no transformation are reclassified as made in Mexico or made in Canada when exported to the U.S., then the transshipment is illegal, and the issue is one of enforcement. This paper analyzes changes in trade flows at the HS four-digit level for evidence of transshipment. Because a change at the four-digit HS level can under USMCA constitute sufficient transformation to change the goods originating status, data that point to transshipment at the HS 4-digit level could also be evidence of supply chain integration. Following the path of products at the six- or eight-digit level could be the next step in this analysis to better distinguish transshipment from supply chain integration.
Transshipment may also arise under the U.S. de minimis exception, which allows imports into the U.S. under $800 to avoid paying duties. Under USMCA, Mexico agreed to increase its de minimis threshold to ~$117 and ~$50 for customs duties and taxes, respectively, for USMCA partners as compared to $50 for the rest of the world. Canada agreed under USMCA to increase its de minimis threshold for the U.S. and Mexico to ~$110 and ~$30 for customs duties and taxes, respectively, compared to $15 for non-USMCA countries. In April 2025, Trump signed an executive order ending duty-free de minimis treatment for Chinese goods as well as ending de minimis for imports from Canada and Mexico. However, the removal of de minimis treatment for Mexico and Canada was suspended that same month. Depending on the ultimate outcome, Trump may have closed down the de minimis exception as an avenue for Chinese products to circumvent U.S. tariffs.
3.1.1 Changes in US trade flows before and after US tariffs on China
One way to assess transshipment is to look at changes in growth rates of imports before and after U.S. tariffs on China. Table 2 compares nominal growth rates in imports pre- and post-tariffs, as well as growth rates adjusted for inflation. In nominal terms, there was a decline of approximately 18% in U.S. imports from China post-tariffs, compared to about 11% growth pre-tariffs. Post-tariffs, Mexican imports from China grew almost 40%, double the growth rate of Mexican imports from China pre-tariffs. And post-tariffs, U.S. imports from Mexico grew by almost 50%, compared to about 16% import growth pre-tariff. Adjusting for prices, the rate of growth in Mexican imports from China is lower, but there is still growth pre- and post-tariffs, from approximately 16% pre-tariffs to almost 20% post-tariffs. The result is that these data do point to circumvention of U.S. tariffs by China via Mexico.
U.S. growth rates in imports from Canada post-tariffs were up almost 30% compared with growth rates pre-tariffs of around 8%. Adjusting for prices, the growth rate post-tariffs was about 6% compared with 2.3% pre-tariffs. Moreover, almost 90% of this growth in U.S. imports from Canada was in energy and electricity—products that are produced in Canada. In addition, the growth rate of Canada’s imports from China was lower post-tariffs in nominal and real terms. The result is that import growth rates are inconclusive as to whether the imports have been circumvented by China via Canada.
The following section looks more closely at the extent of Chinese circumvention of U.S. tariffs with a focus on three specific categories of products: power transformers, static converters, and inductors (HS code 8504); parts and accessories of motor vehicles (HS code 8708); and iron and steel products under HS codes 7208-7212, 7225, and 7226. These products were chosen due to their substantial role in U.S. trade with China, Mexico, and Canada, the inclusion of goods under these product categories in U.S. tariffs on goods from China, and their importance for U.S. national and economic security. Some of these products have also been recently subject to additional tariffs by Mexico and Canada (Table 1).
3.1.2 Was there circumvention of US tariffs on power transformers, static converters, and inductors (HS Code 8504)?
Electric machinery and related products (HS code 85) were the United States’ third-largest exports in 2024, worth over $320 billion.5 The electronic products sector was the second-largest U.S. import in 2024, comprising around 10% of goods imports.6 These products are also important imports for Mexico, with electrical machinery and equipment imports of approximately $117.3 billion in 2024 making up over 19% of Mexican imports. Canada’s imports of electronic and electrical equipment reached over $52 billion in 2024, comprising approximately 9.4% of total import.
In 2018, the Trump administration applied tariffs of 25% to a list of products under Section 301 including some goods under HS code 8504 (power transformers, static converters, and inductors). Some products under Chapter 85 were included in the four critical products in the Biden administration’s 100-day supply chain review. Various electrical machinery and parts are also important inputs for covered national security technologies and products outlined in Biden‘s Executive Order 14105 on “Addressing United States Investments in Certain National Security Technologies and Products in Countries of Concern.”
Table 3 shows tariff rates applied by the U.S., Canada, and Mexico on imports from China, as well as U.S. tariffs on imports from its USMCA partners as of December 2024. The relatively lower Mexico-China, Canada-China, and U.S.-Mexico/Canada tariffs compared to the U.S.-China tariffs created an incentive for transshipment. When it comes to U.S. trade with China,7 the net result is that importing products from China through Mexico or Canada into the U.S. meant the difference between tariff rates of 2.9% to 3.7%, depending on whether the goods entered under USMCA, versus a tariff rate of about 25.8% when directly imported into the U.S.
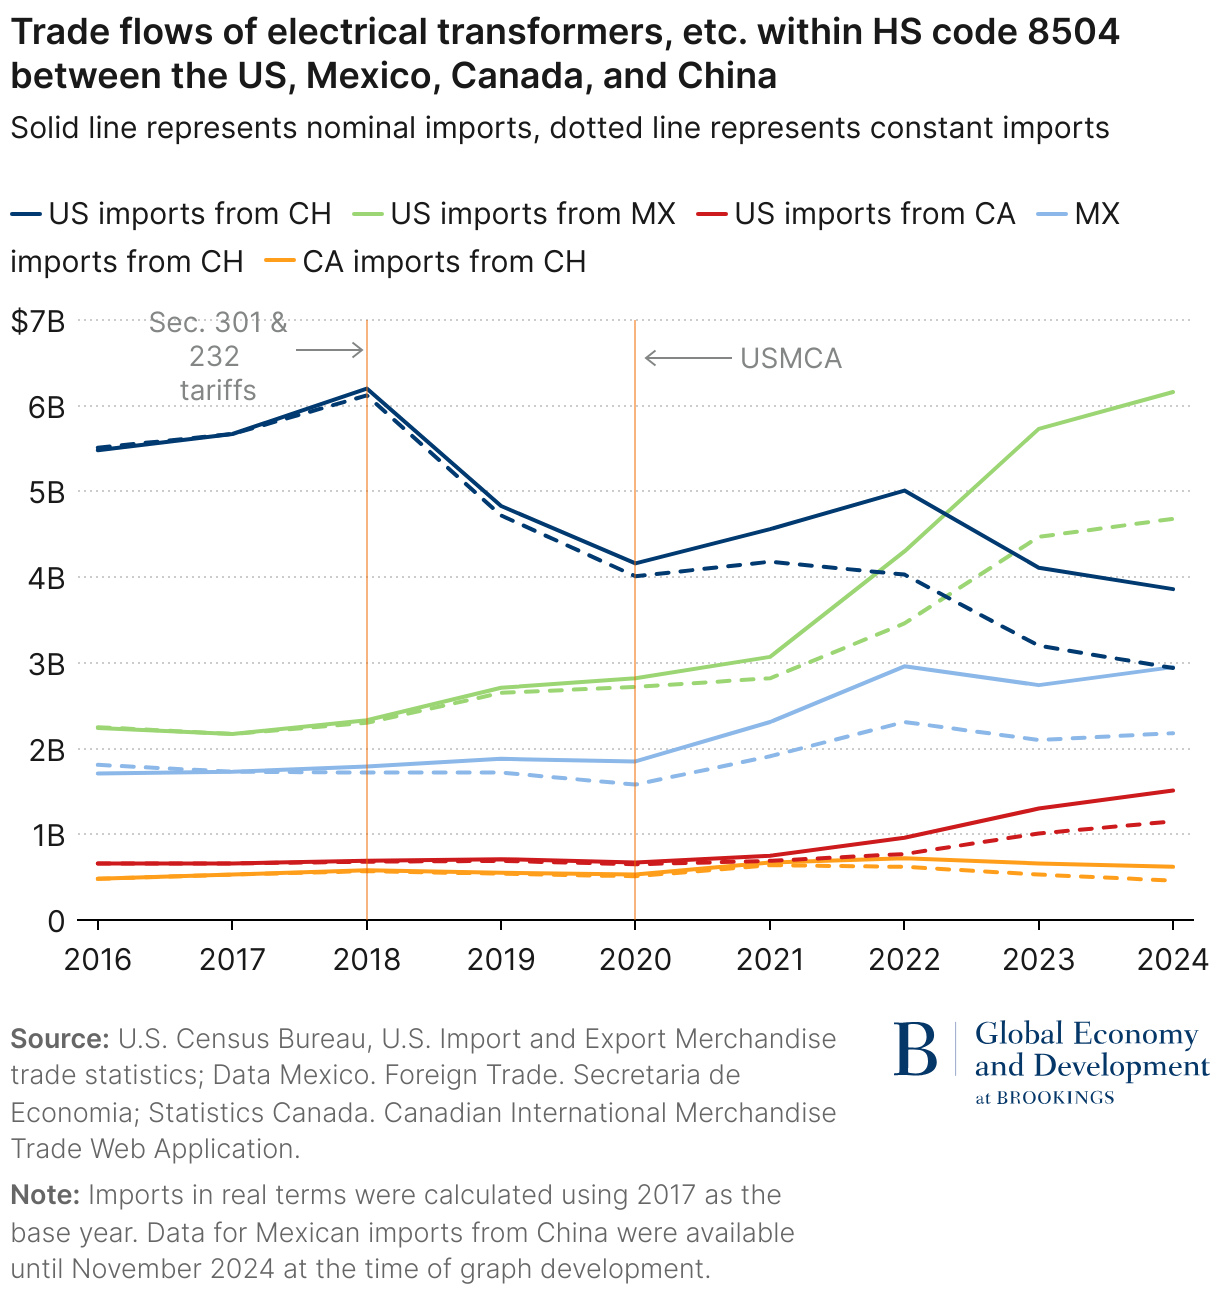
Figure 3 shows trade flows in nominal terms and adjusted for inflation. The inflation-adjusted data use price series from the U.S. Bureau of Labor Statistics, Statistics Canada, and National Institute of Statistics and Geography (INEGI). Since U.S. tariffs on these products from China in 2018, U.S. imports from China were down around 37.6% by 2024. When it comes to Canada, U.S. imports of these products more than doubled post-2018 tariffs. In contrast to Mexico, however, from 2018 to 2024 Canadian imports from China increased by about 8% in nominal terms and show a decrease of approximately 19% when adjusting for inflation. The conclusion being that at this four-digital level, the data do not show circumvention of Chinese power transformers, static converters, and inductors entering the U.S. market via Canada.
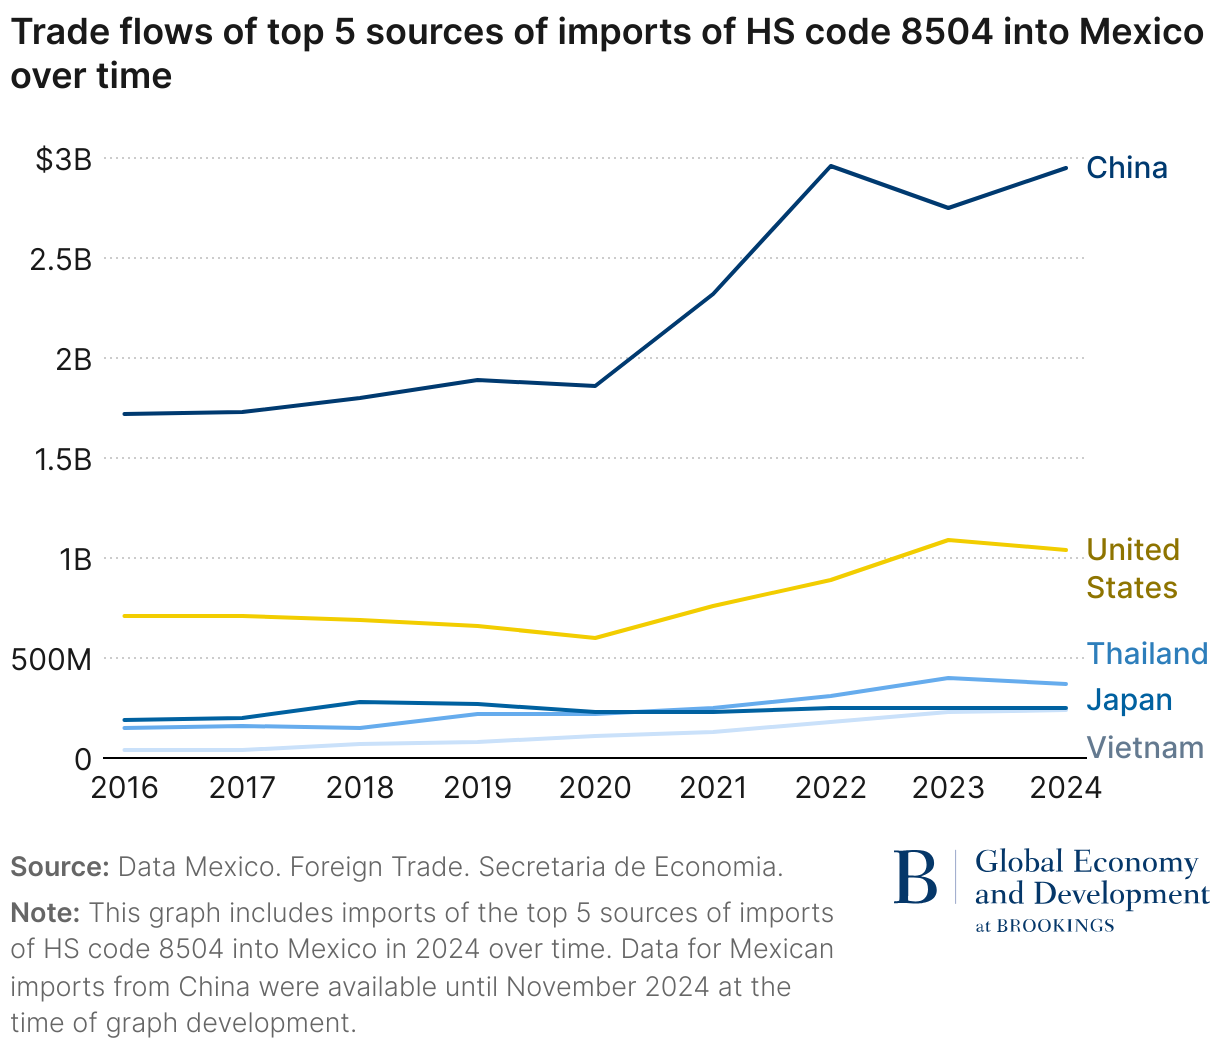
With respect to Mexico, U.S. imports of these goods were approximately two and a half times larger in 2024 than in 2018, with Mexico replacing China as the United States’ largest source of imports in 2023. Since 2018, there was also about 65% growth in Mexican imports from China of transformers, static convertors, and inductors, particularly post-2020. However, since 2022, Mexican imports of these products from China have been flat, suggesting at least that direct imports from China are not the drivers of the more recent growth in U.S. imports of these products from Mexico. The inflation-adjusted data show similar trends though at lower levels with the growth of Mexican imports from China at approximately 27%, less than half the growth rate. Taken together, these data do point to products entering the U.S. market via Mexico. In addition, declining Mexican imports from China might not necessarily mean that fewer Chinese products have been entering Mexico, but that Chinese goods were entering Mexico via third countries. Figure 4 shows Mexico’s top five import sources. As can be seen, the decline in Mexican imports from China of these products of approximately $216 million between 2022 to 2023 was partly offset by growth in imports of these same goods from Vietnam and Thailand, totaling approximately $150 million, as Chinese companies shifted manufacturing and supply chains into these countries and exported from there.
3.1.3 Was there circumvention of tariffs in iron and steel (HS Codes 7208-7212, 7225, and 7226)?
Retaining domestic steel production capacity is considered an issue of U.S. national security. In the face of excess steel production and declining U.S. utilization of production capacity, the U.S. has imposed tariffs on imports of steel and aluminum in 2018 and expanded these tariffs in the years that followed. U.S. imports of iron and steel have also been subject to a range of anti-dumping and countervailing duties over the years. In 2018, Trump applied tariffs of 25% on imports of iron and steel from China. On July 10, 2024, concern about Chinese circumvention of U.S. tariffs on iron and steel imports led Biden to announce a new 25% tariff on steel that is not melted or poured in North America as well as a 10% tariff on aluminum cast or smelt in China, Russia, Iran, or Belarus entering the U.S. through Mexico. On March 12, 2025, Trump implemented a global 25% tariff on imports of steel and aluminum, including from Canada and Mexico. Mexico also increased tariffs on a range of iron and steel imports. In October 2024, Canada imposed a 25% surtax on steel and aluminum from China.
These HS codes cover a range of iron and steel products, the main ones being flat-rolled steel products. Table 4 shows the different tariffs on these products when it comes to U.S. imports from China, Mexican imports from China, Canadian imports from China, and U.S. imports from Mexico and Canada before the start of Trump’s second term.
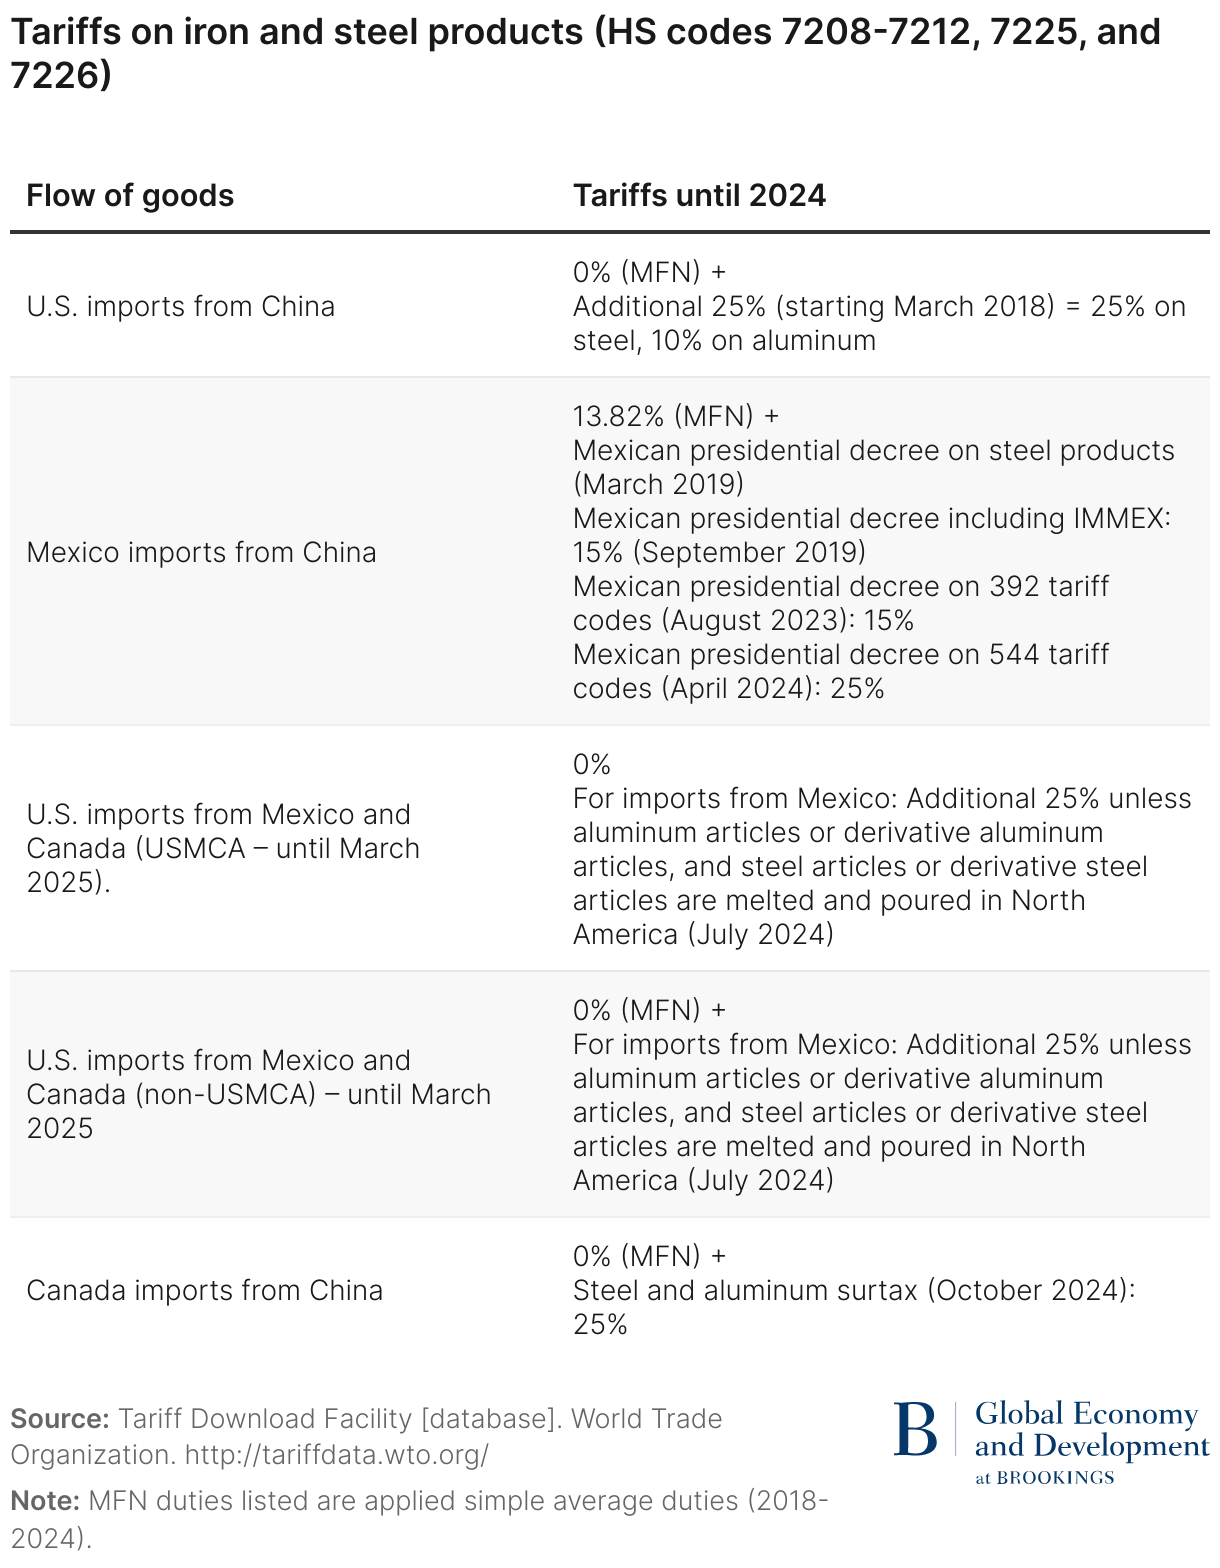
Figure 5 shows trade flows of these products between the U.S, Canada, Mexico, and China.
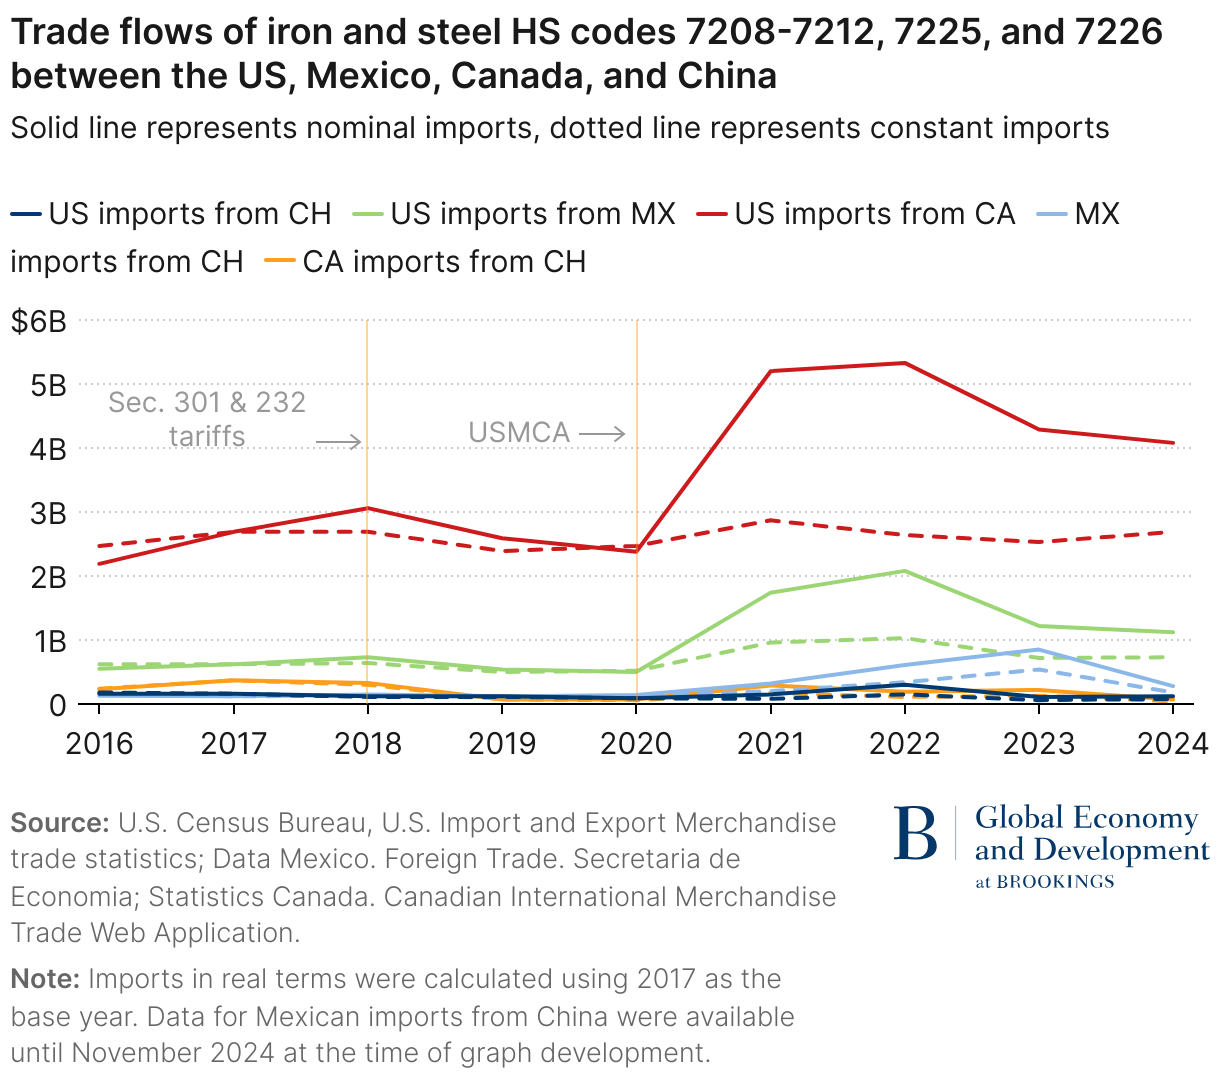
Pre-tariffs, U.S. imports of iron and steel from China were already declining, while imports of these products from Canada and Mexico were growing. Following the application by the U.S. in 2018 of additional tariffs on iron and steel and products from China, U.S. imports of steel products from China continued to fall until 2021. They rebounded in 2022, and since then, U.S. imports from China have been on a downward trajectory. When adjusting for inflation, the trend is similar.
When it comes to U.S. imports from Canada, between 2018 to 2024, U.S. imports of these products from Canada grew by over 30% with imports almost doubling between 2021 to 2022 from approximately $2.4 billion to around $5.2 billion. However, when adjusted for inflation, U.S. import growth from Canada over the period 2018 to 2024 was largely flat with lower growth rates than was the case pre-tariffs. Moreover, post-tariffs, Canada’s imports from China between 2018 to 2024 were negative, compared with around 50% growth rates in imports from China pre-tariffs. Taken together the data do not point to Chinese steel and iron entering the U.S. via Canada as a response to U.S. China tariffs in 2018.
In contrast, Mexico’s growth rate of imports from China pre-tariffs was around 19%, but imports from China grew at over 80% per annum in the post-tariff period. Moreover, U.S. imports of iron and steel from Mexico were also significantly higher from 2018 to 2024 compared with 2016 to 2018 as shown in Figure 5. Taken together, these data point to circumvention of Chinese iron and steel into the U.S. via Mexico. However, since 2022, Mexico’s imports from China of these iron and steel products has declined at around 80%, and in 2024, imports were back to around 2018 levels.
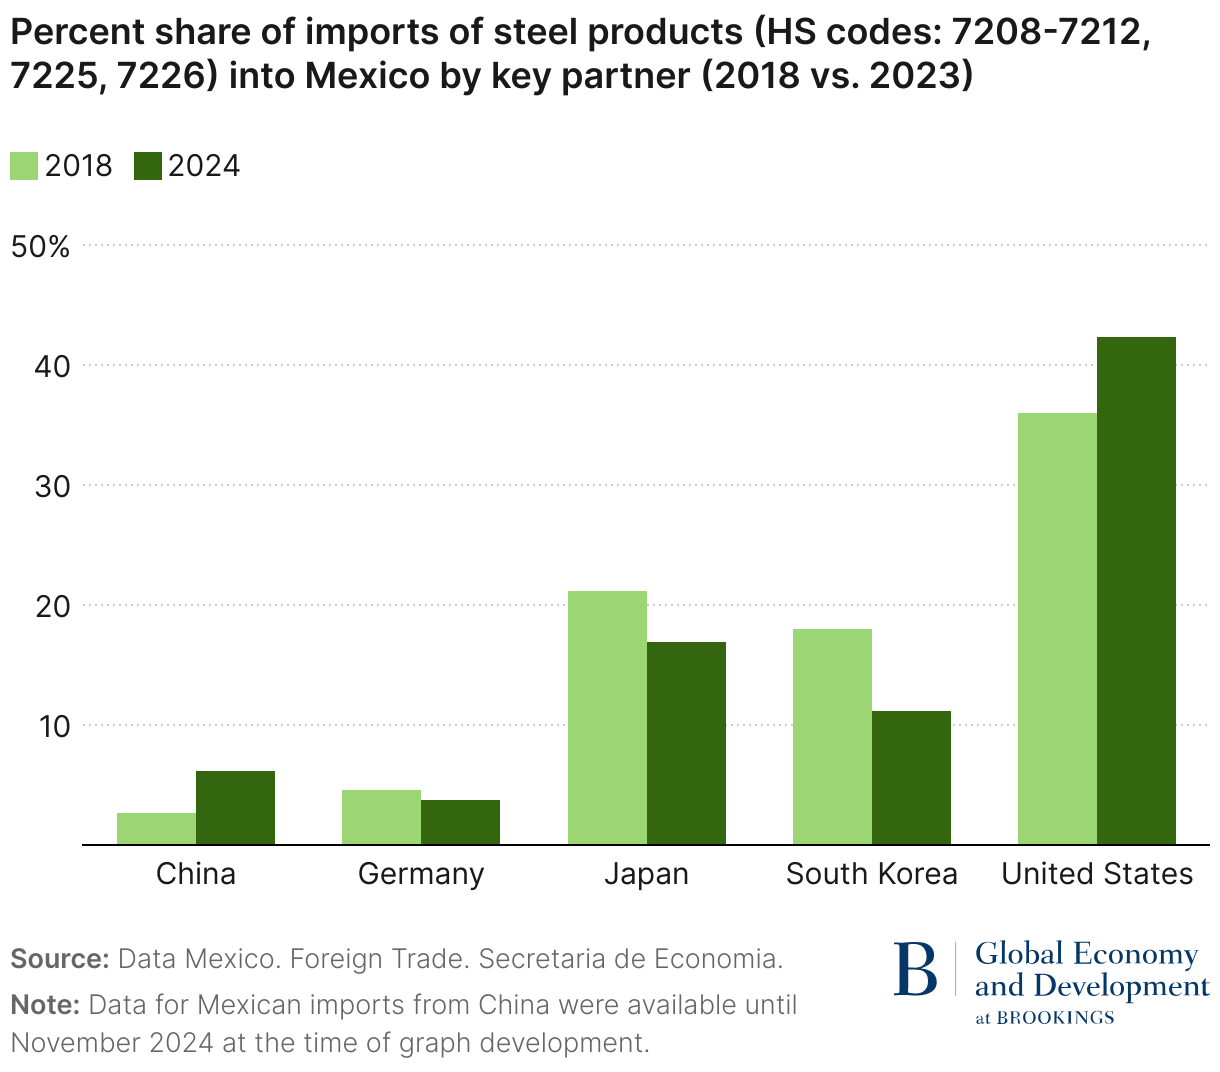
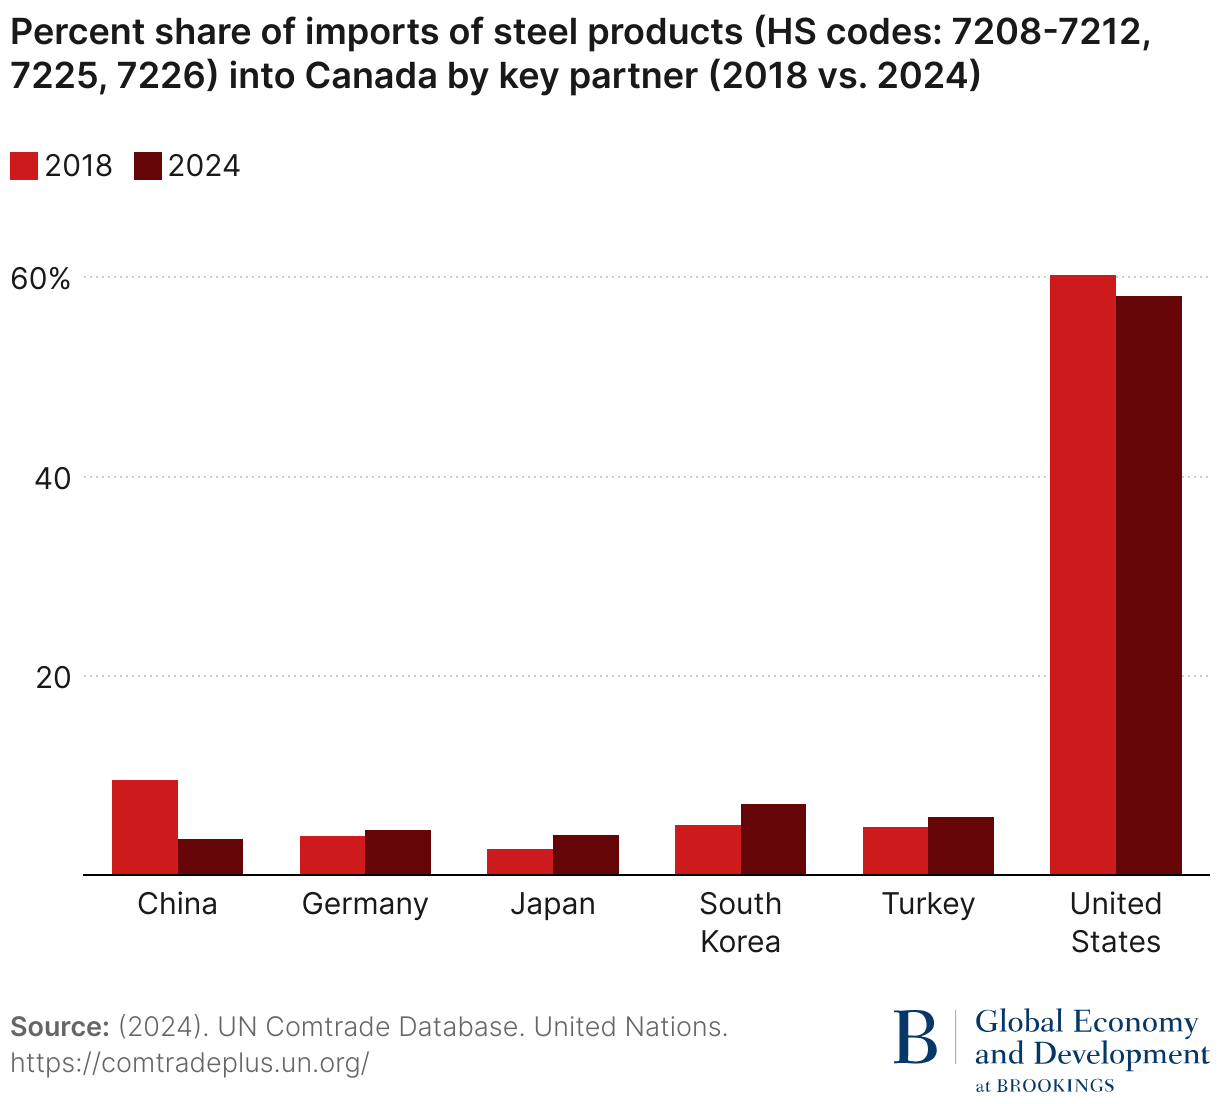
It is also the case that Chinese steel imports have been capturing greater market share in Mexico, underscoring the surge in imports from China. Figure 6 shows that between 2018 and 2024, China’s share of Mexican imports of these products increased by over 130%, the U.S. share of Mexico’s imports increased by approximately 18%, while the share of Mexico’s imports of these products from other major iron and steel suppliers such as Japan, South Korea, and Germany, all declined. In contrast, during the same period, China’s share of Canada’s imports of these products declined by over 60% whereas import shares from South Korea, Japan, Germany, and Turkey increased. These data underscore growth in Mexican imports of steel and iron from China and supports concerns that some these products have entered the U.S. In contrast, decreasing Canadian imports of these products from China suggests that there was little to no transshipment via Canada.
Steel products are also inputs into various manufacturing processes. In this case, the growth in imports from China might not be for transshipment to the U.S., but instead for use in various manufacturing processes such as for autos, which as outlined, could be another way that Chinese products can circumvent U.S. tariffs and enter the U.S. market. Section 4 below looks more closely at the extent Chinese products are entering the U.S. by being incorporated into other products manufactured in Mexico and Canada.
3.1.4 Is there circumvention by China of trade in parts and accessories of motor vehicles (HS code 8708—parts and accessories of the motor vehicles of headings 8701 to 8705)?
The automobile sector is a key driver of trade across North America. In 2024, the region is estimated to have produced approximately 16 million vehicles representing over 18% of global production. In 2024, transportation equipment and vehicles were the United States’ fourth-largest imported items and fourth-largest exported items.
Various products in HS code 8708 have been subject to U.S. tariffs, and Mexico has also raised tariffs on goods in this HS code. Table 5 shows the tariffs on imports by the U.S., Mexico, and Canada on these products. As can be seen, given U.S. tariffs on imports from China, there has been an incentive to circumvent these tariffs and enter the U.S. via Mexico and Canada, thereby paying either the USMCA rate of 0% or the WTO MFN rate of around 1.4%. However, since April 2024, the increased Mexican tariff on these products should decrease the incentive for transshipment.
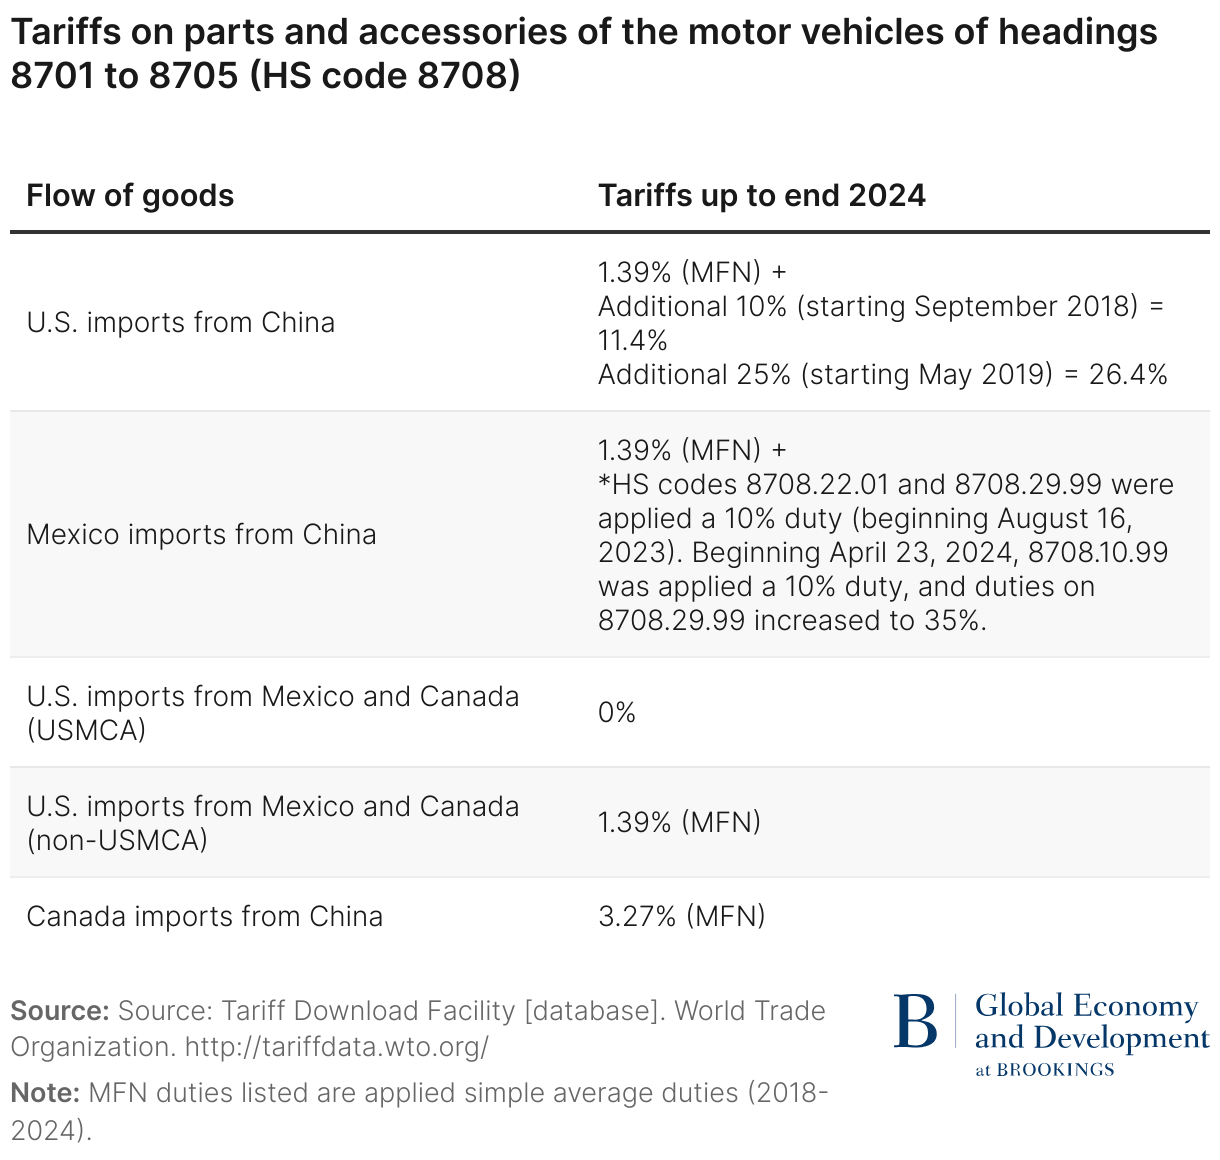
Figure 8 shows trade flows of motor vehicle parts. Following U.S. tariffs, U.S. imports of motor vehicle parts from China peaked in 2018, declined over 30% by 2020, then grew about 40% by 2022, with a more recent decline of approximately 10% from 2022 to 2024. However, when adjusting for inflation, U.S. imports from China in the period 2018 to 2024 remained below 2018 levels.
Starting with Canada, post-tariffs, there was some growth in Canada’s imports from China as well as growth in U.S. imports of these products from Canada. U.S. imports from Canada increased by about 21.5% from approximately $9.3 billion in 2018 to over $11 billion in 2024. In the same period, Canada’s imports from China of these goods increased by about 20% compared to around 3% growth in the period pre-tariffs. However, when adjusting for inflation, U.S. imports from Canada in these products was flat, as was growth in Canadian imports from China. Taken together these data suggest limited to no transshipment of motor vehicle parts from China into the U.S. via Canada.
When it comes to Mexico, U.S. imports of these products from Mexico were already growing pre-tariffs. Since 2018, U.S. imports of these products grew by almost 50%, while Mexico’s imports from China of these goods increased by about 93.5%. When adjusting for inflation, growth in U.S. imports from Mexico was under 20%, and growth in Mexican imports from China was around 50%. Taken together these data do point to transshipment of these Chinese products via Mexico.
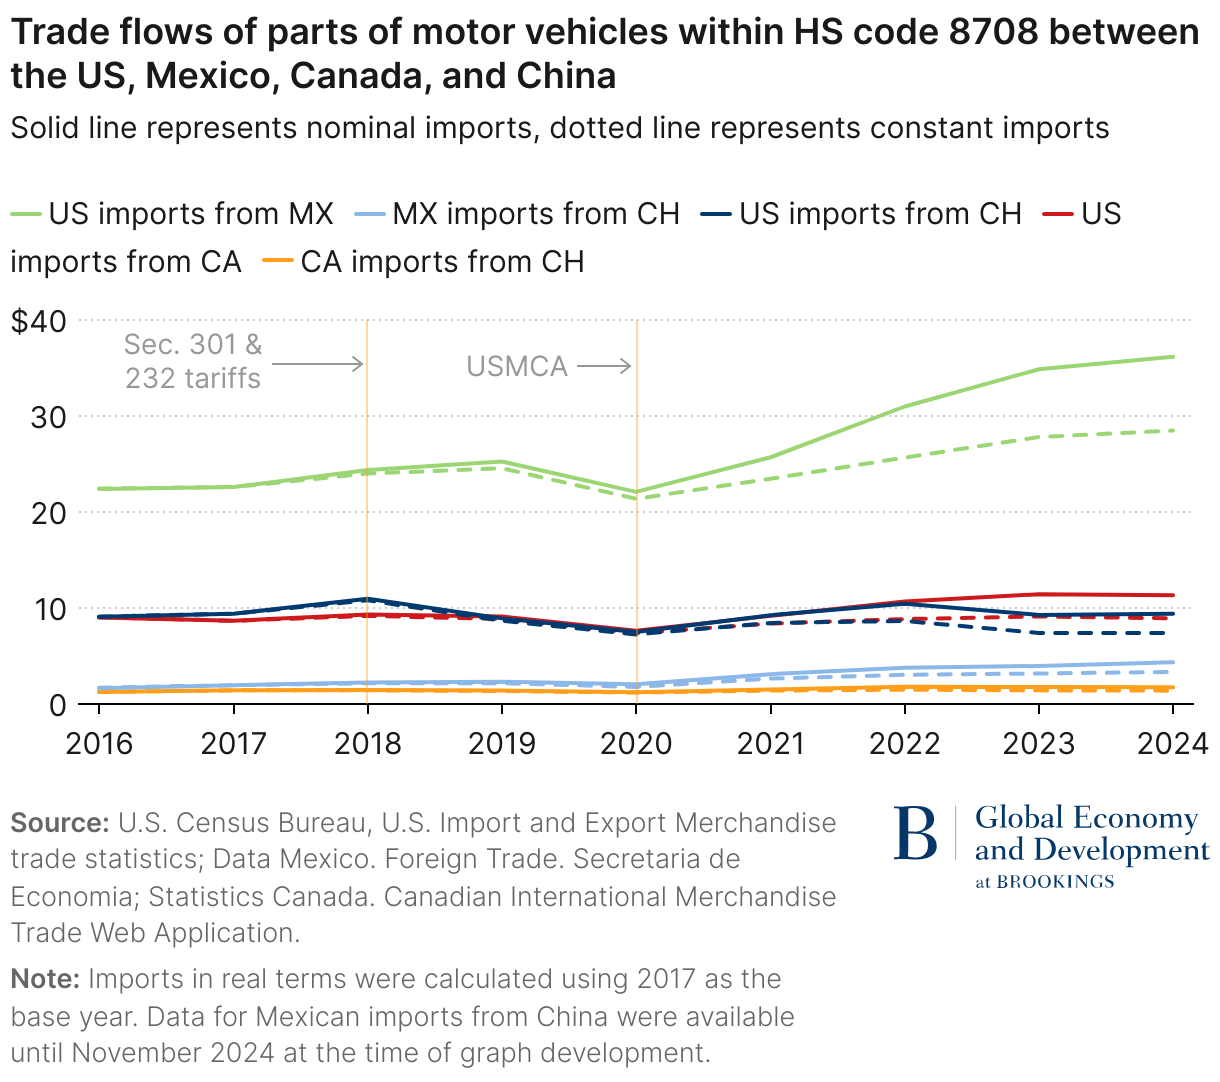
As noted above, given the role of supply chains across North America—when it comes to auto parts and vehicles—imports from China are also likely used as inputs into auto supply chains, which are analyzed in the following section. In addition, these data do not get at which companies are importing from China. For example, General Motors in Mexico is a major importer of Chinese-assembled vehicles. This example highlights that companies continue to expand sourcing from outside North America—presumably to reduce costs and improve competitiveness despite tighter USMCA ROOs for autos compared to NAFTA. As companies sought to remain competitive, they chose to pay the higher WTO MFN tariff rate of 2.5% than comply with USMCA ROOs, with the share of auto imports that paid the 2.5% MFN duty increasing from 0.5% pre-USMCA to 8.2% in 2023. Mexico’s decision to remove the tariff exemption for EV imports sourced from non-FTA countries, in addition to Canada’s 100% surtax on EVs from China, both starting in October 2024, should reduce the incentive for circumvention caused by U.S. tariffs on Chinese imports.
3.2 Supply chain integration
A second route for Chinese goods to enter the U.S. market is by incorporating intermediate goods from China into North American supply chains. Approximately 50% of trade within North America comprises intermediate products. As noted, goods that undergo a substantial transformation sufficient to change the country of origin are considered as made in that country when exported to the U.S. This means that Chinese products used in Canadian or Mexican supply chains to produce another product for export to the U.S. will enter the U.S. as a product made in either Canada or Mexico. Whether such products can then qualify for the USMCA zero tariff rates will depend on meeting the agreement’s ROOs. USMCA ROOs in the automobile sector were tightened under USMCA compared to NAFTA, and now include a combination of regional value content, labor value content, and steel and aluminum purchasing requirements. The 2024 U.S. requirement that steel imports from Mexico be melted and poured in North America should also reduce use of imported Chinese steel in North American auto supply chains.
Incorporating Chinese origin content into supply chains is not in violation of USMCA. The issue instead is one of reduced tolerance in the U.S. in particular (but increasingly in Mexico and Canada as well) for using Chinese products in sectors that might pose a threat to national security and that are at odds with the broader goals of reducing trade with China.
Figures 9 and 10 show Mexican and Canadian imports of intermediate products from China. Data are limited but show growth in imports of intermediate products from China until 2018 when U.S. tariffs on Chinese products began to be applied. In both Mexico and Canada, imports of intermediate goods from China declined in 2020, followed by large increases in imports of intermediate products from China in 2021 and 2022. The outcome is that imports of Chinese intermediate goods into Mexico and Canada surged. In fact, in 2022, Mexican use of Chinese intermediate products was up almost 100% from 2018, and Canadian use of Chinese intermediate goods was up almost 80%.
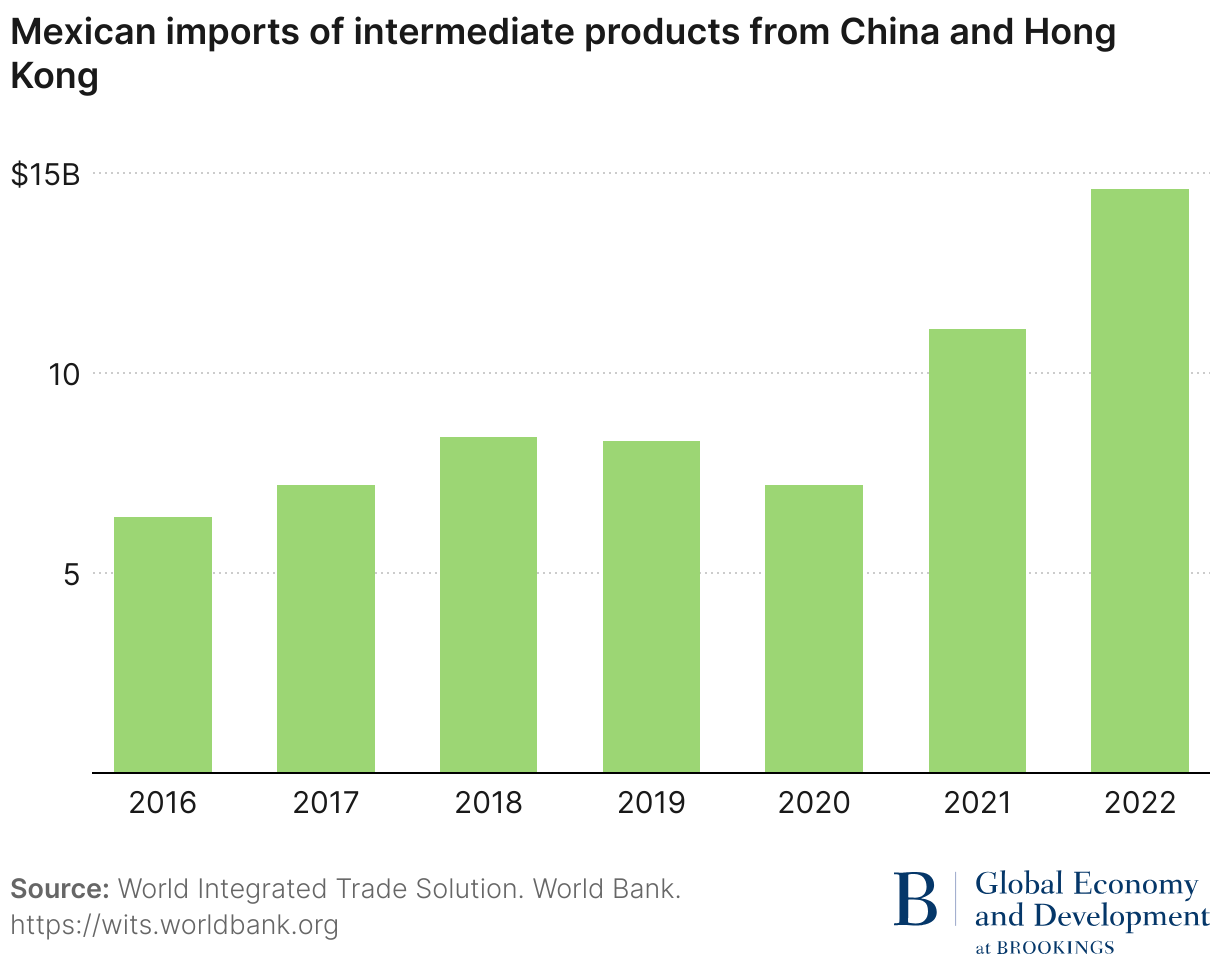
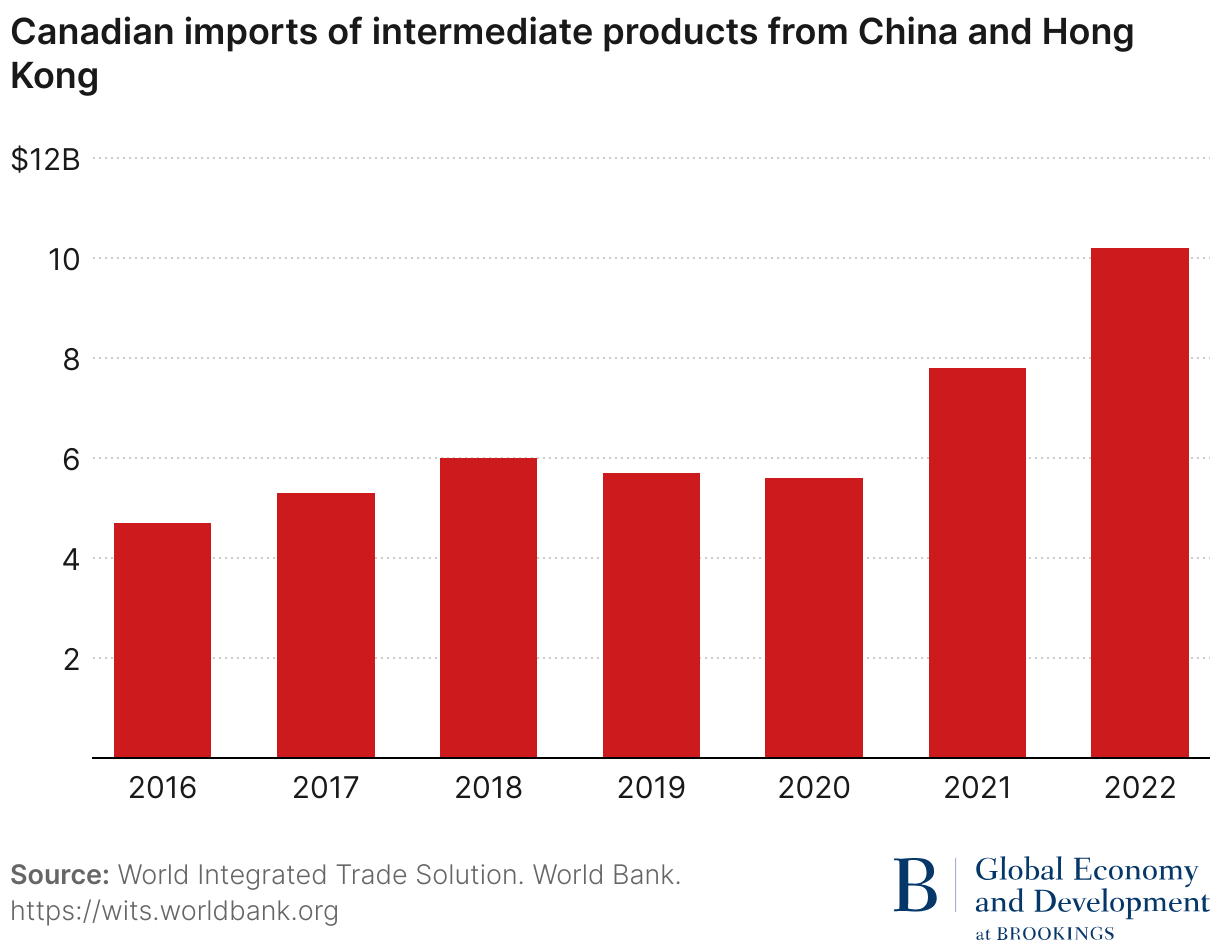
Figure 11 builds on the above data and shows the value of Chinese intermediate goods used to produce goods for export from the U.S., Mexico, and Canada. The data show that Chinese value added in U.S. exports declined since 2018 tariffs on Chinese products. In contrast, Chinese value added in Mexican exports was both larger in absolute terms than for the U.S. and remained stable at around $32 billion to $33 billion. For Canada, Chinese value added in exports also remained stable over the period 2018 to 2020 but was only worth around $10 billion. These data on Chinese intermediate imports and value added in exports suggest that there has been continued growth in the use of Chinese inputs in manufacturing and for export in both Mexico and Canada. However, more up-to-date data are needed to better assess trends.
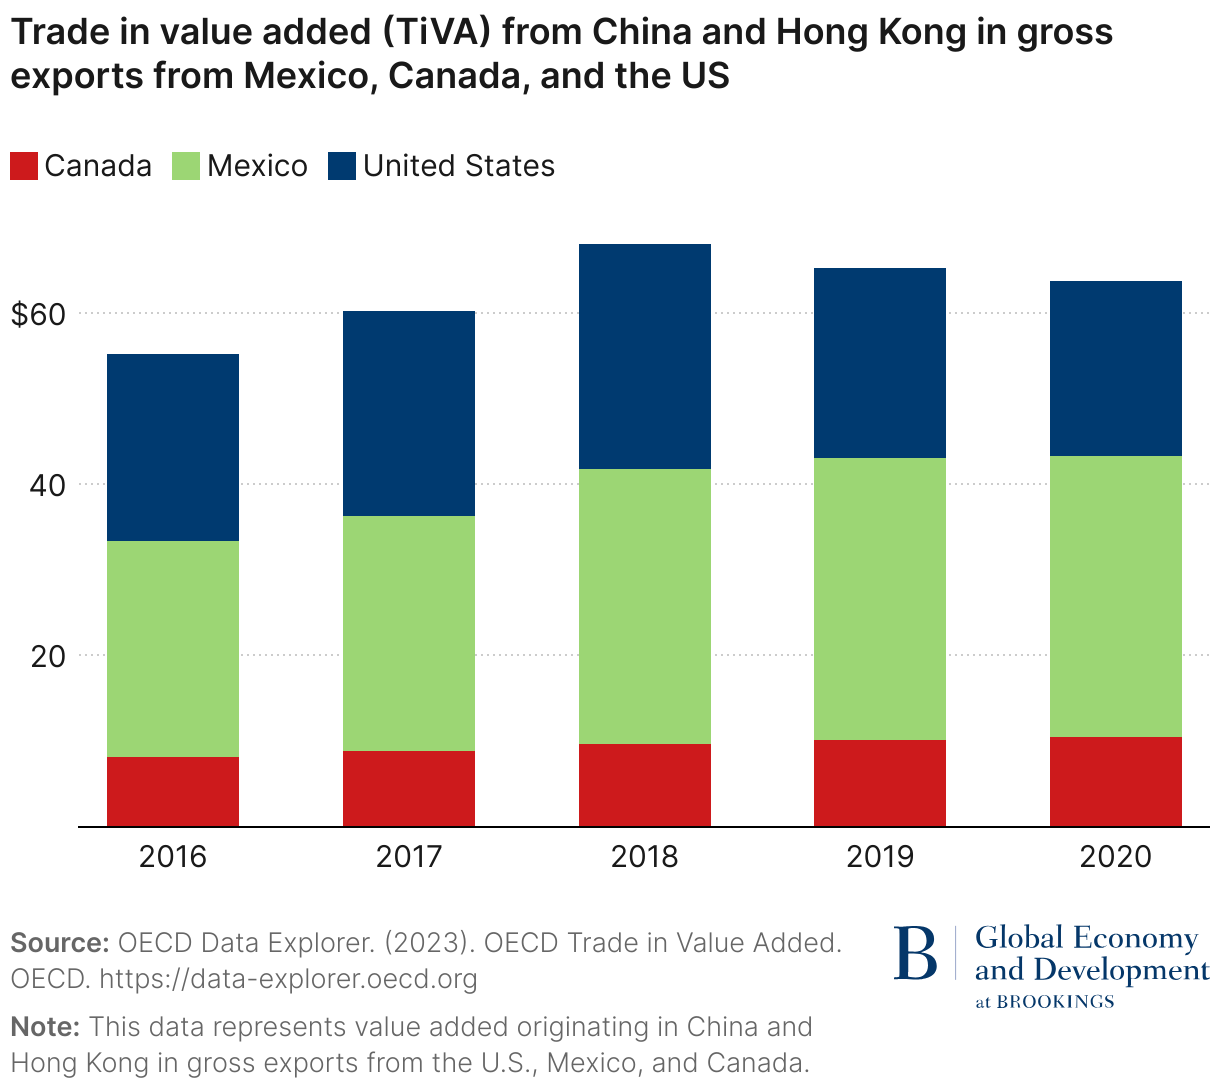
Figure 12 refines this data with a focus on trade within North America. The results are similar given the large share of Mexican and Canadian exports that go to the U.S.
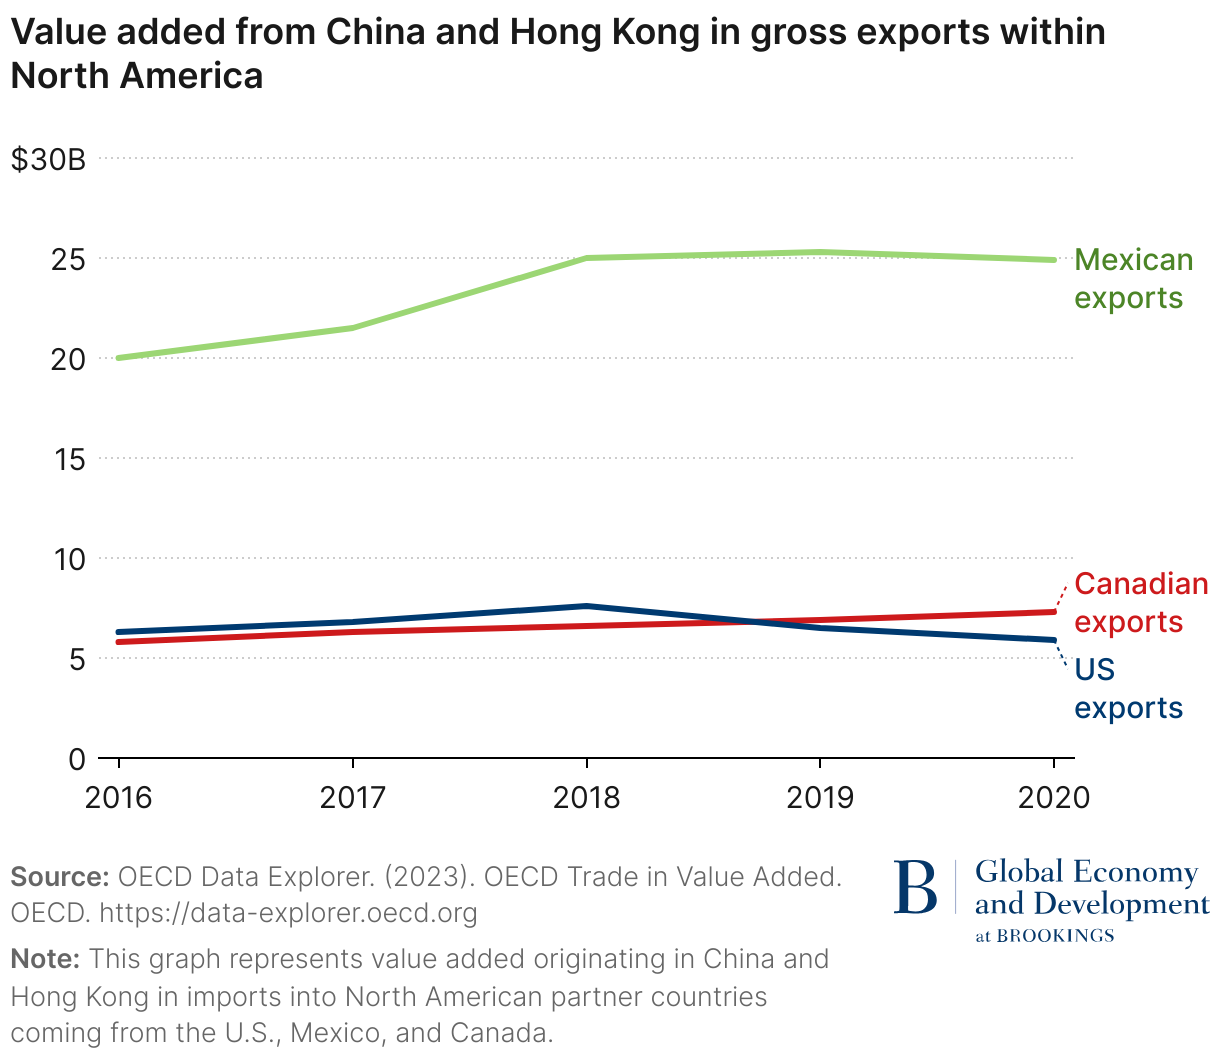
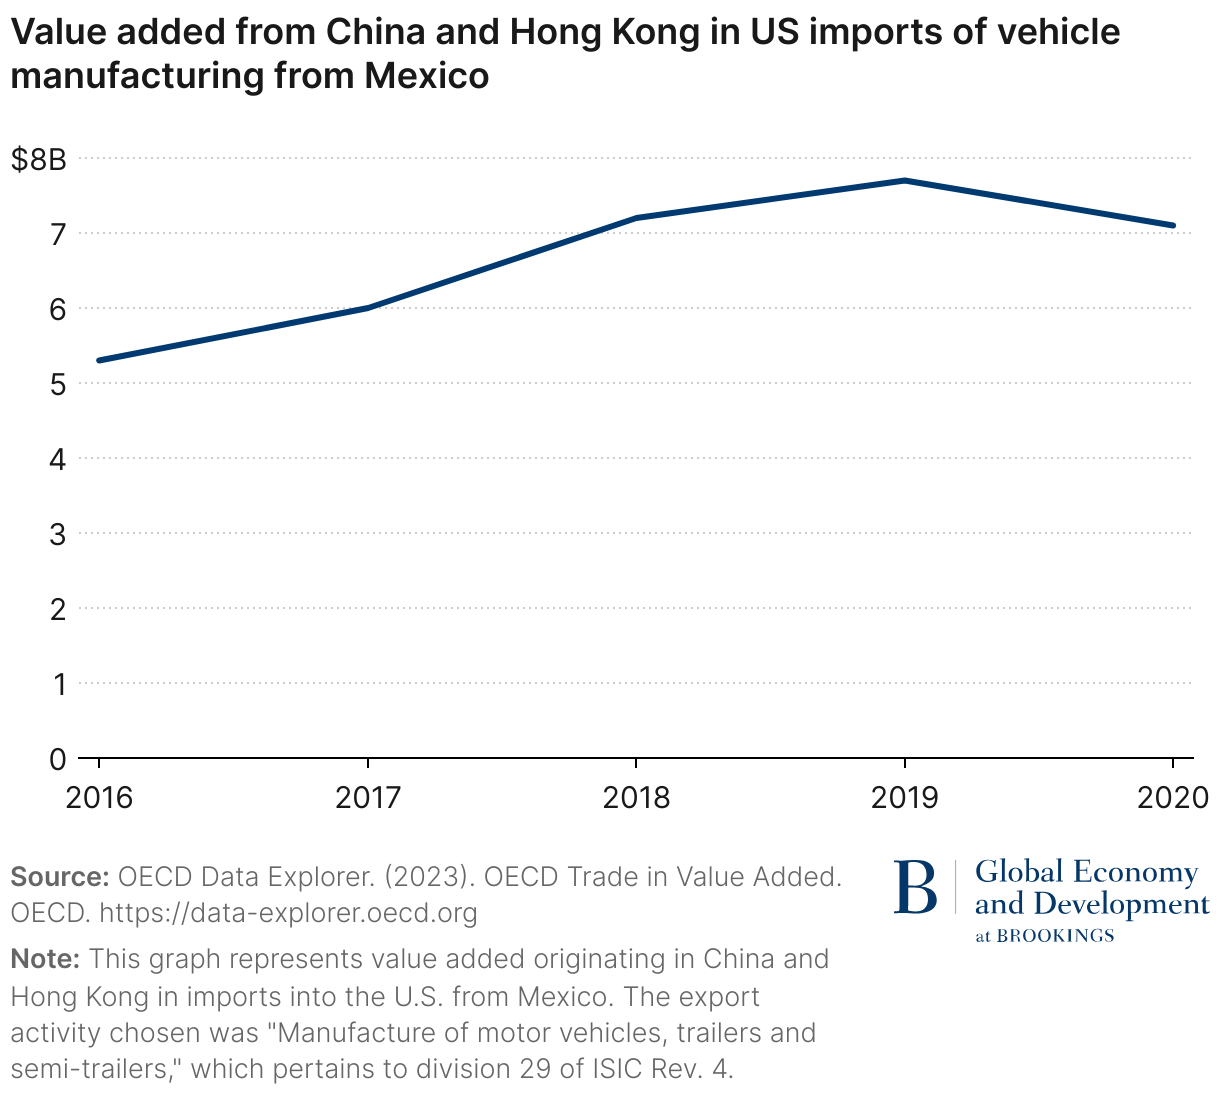
Figure 13 drills down further into the role of Chinese value added in Mexican exports of auto parts. It shows rising Chinese value added in U.S. imports from Mexico of vehicle manufacturing until 2019. This rise in Chinese value added is also mirrored in increased Mexican imports from China of products in HS code 8708. U.S. imports from Mexico of auto parts have increased at a faster pace since 2020, however, we do not have value added data post-2020. Since then, further trade restrictions have been placed by the U.S., Mexico, and Canada on auto-sector imports from China, which could reduce use of intermediate products from China in auto supply chains.
3.3 Foreign direct investment
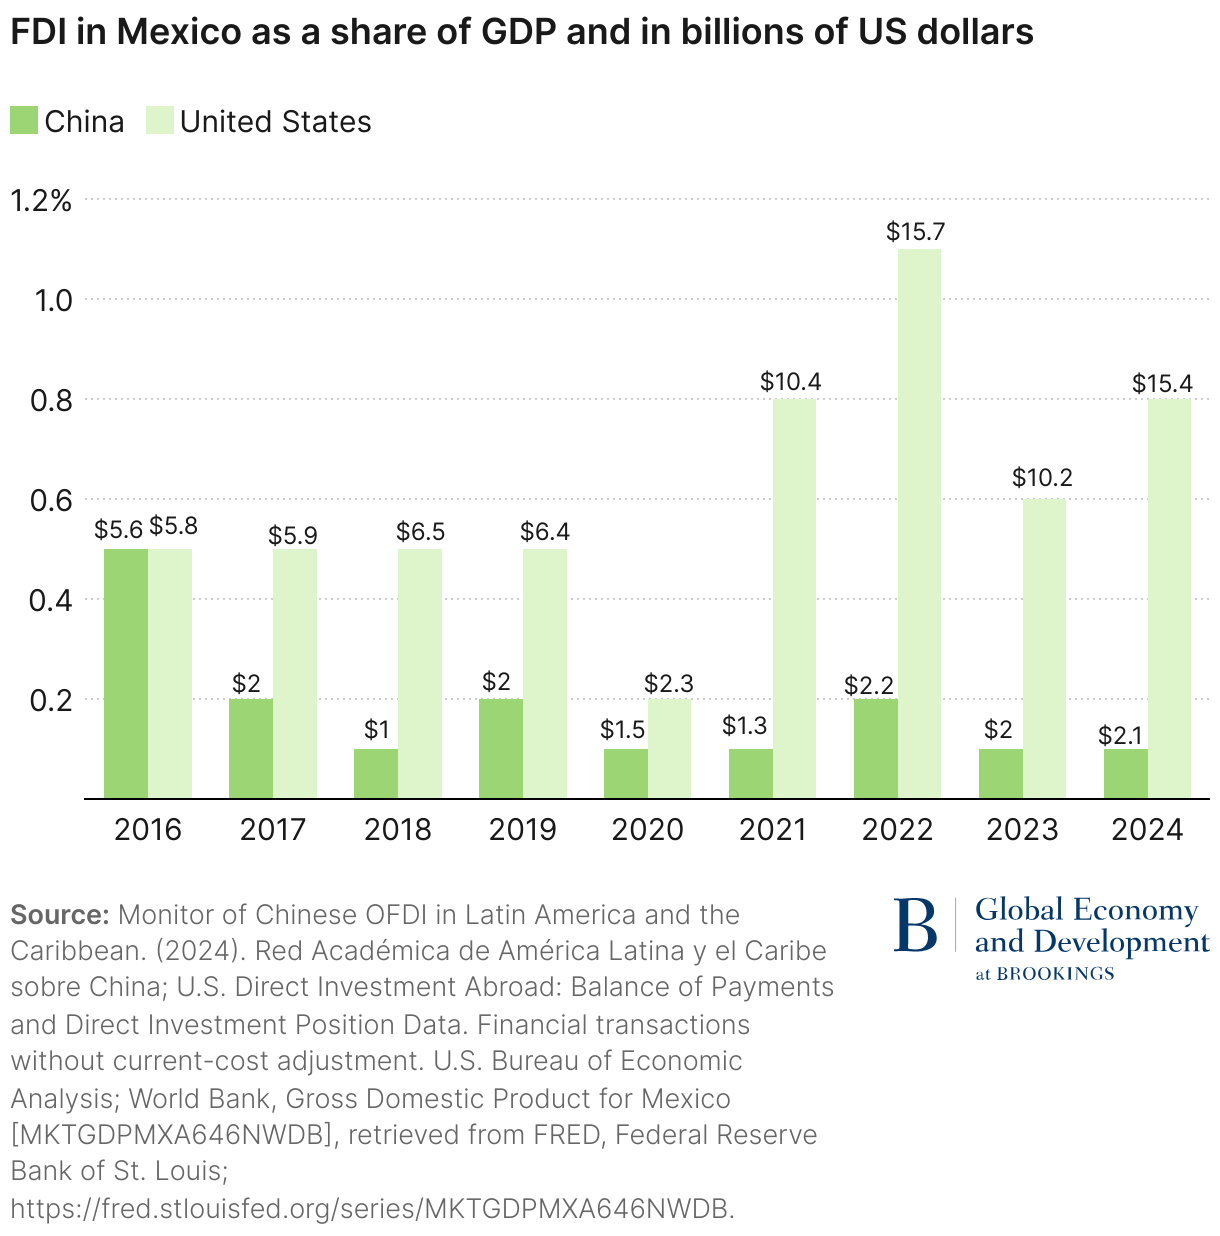
FDI is a third way through which Chinese companies can circumvent U.S. trade restrictions. Chinese firms that move production to Mexico or Canada can then take advantage of USMCA preferential tariffs when exporting to the U.S. Figure 14 shows Chinese investment at around $1 billion to $2.2 billion annually since 2017. However, data compiled by Rhodium Group based on deals announced point to significant growth in Chinese FDI into Mexico in 2023, primarily through greenfield investments. Rhodium Group data report newly announced investment in 2023 at approximately $3.77 billion with its China CBM reporting a similar trend in the first half of 2024.
This Chinese investment into Mexico remains relatively small compared with U.S. investment, estimated at $16 billion in 2022, well above the $2.2 billion from China. When measuring FDI as a share of GDP, in 2024, China’s FDI in Mexico comprised less than 0.2% of GDP. In 2024, the U.S. remained the top investor into Mexico, accounting for approximately 45% of total FDI, followed by Japan, Germany, Canada, and the Netherlands. Together, these top five investors account for a notable 81% of total FDI flows into Mexico last year.
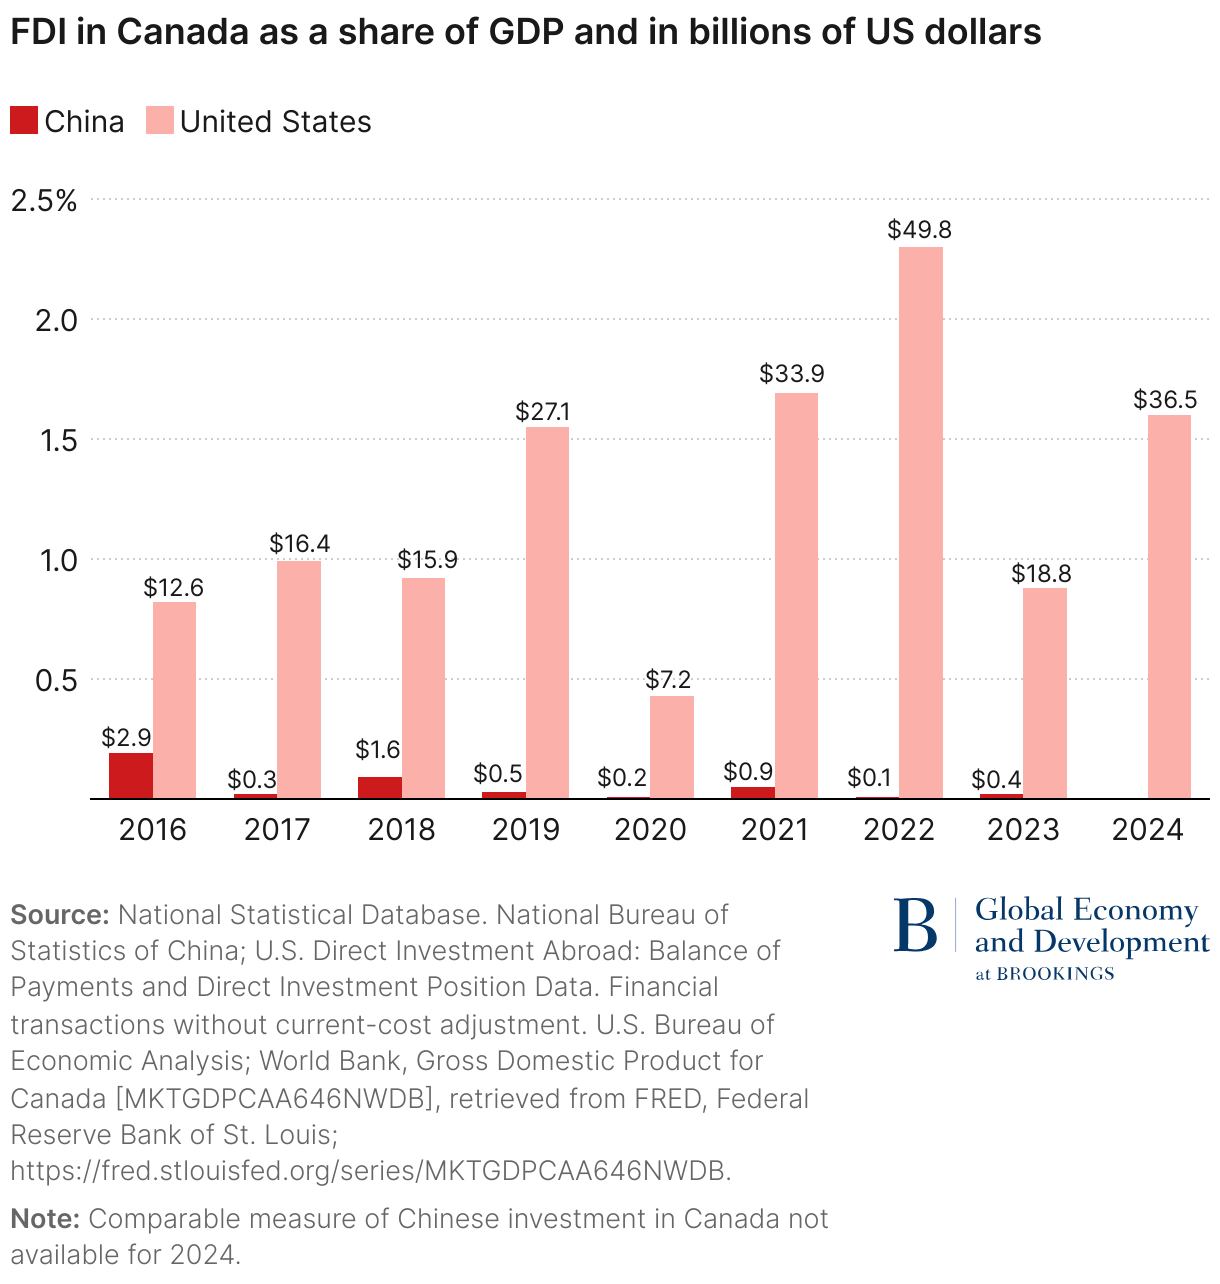
Chinese FDI into Canada is even less than Mexico and appears to be declining, with China investing $400 million in 2023, down from $900 million in 2021. In the case of Canada, the U.S. is also the major investor reaching approximately $36.5 billion in FDI in 2024.
In the same way in which concerns about rising Chinese products in North American supply chains can be a form of circumvention even if not illegal, circumvention of U.S. trade and investment restrictions via investment into Mexico or Canada is not a matter of legality, but rather one of changing political tolerance of economic integration with China and concerns about the economic and national security impacts it might have. Furthermore, concerns with FDI as a means of circumvention raise different issues than those pertaining to trade. Foreign companies that invest in the U.S., Mexico, or Canada are deemed as having the nationality of that country, and their products exported to the U.S. and globally are deemed as made in that country. Indeed, previous U.S. administrations raised tariffs in part to encourage more FDI, such as was the case with the U.S. Twenty-five percent of light truck tariffs that began under the “Chicken War” in 1962 led to increased investment by foreign automotive companies in the U.S. Yet, when it comes to Chinese investment, the fact that higher tariffs create an incentive for Chinese companies to instead manufacture in North America makes this outcome less appealing due to the national and economic security concerns.
How to address circumvention via FDI raises various policy challenges. One approach is to screen out Chinese FDI before it happens. The U.S. has taken this approach under CFIUS. In Canada, foreign investment screening is done under the Foreign Investment Review and Security (FIRES), which was amended in 2024 to require mandatory notification to the government of various investments by foreign entities as well as new powers to review investments by state-owned enterprises. In addition, Canada uses its National Security Review of Investments to review FDI for potential harm to national security and in 2025 added Canada’s Sensitive Technology List to these guidelines. Mexico regulates foreign investment under its Foreign Investment Act (FIA) but does not generally require pre-investment notification and limits review to a list of restricted investments or others that exceed the cap established by the FIA. Mexico’s weaker foreign investment screening regime creates an opportunity for Chinese investment into Mexico that would not be allowed to happen in the U.S. and Canada. In December of 2023, the U.S. and Mexico signed a memorandum of intent to establish a bilateral working group to coordinate an investment screening strategy. According to the U.S. Department of Treasury, “the MOI recognizes the importance of the U.S.-Mexico economic relationship, the benefits of maintaining an open investment climate, and the critical role of effective investment review mechanisms in addressing national security risks that can arise from certain foreign investment, particularly in certain technologies, critical infrastructure, and sensitive data.” Although China is not a major player in North American FDI, the countries can work together to be strategic in avoiding national security risks. These types of coordination among the U.S., Mexico, and Canada that target Chinese investment at the source appear the best way forward in addressing concerns about circumvention from Chinese FDI.
4. Conclusion
This paper finds that it is likely that Chinese products are circumventing U.S. tariffs and entering the U.S. via Mexico and Canada. The key question is what can be done to address this. Doing nothing is not an option, and as outlined, Mexico and Canada have taken important steps to align various tariffs with the U.S. tariffs on China and to strengthen the security of their supply chains and protect their national security.
As one of the authors has argued elsewhere, the best-case outcome and one that would have the least impact on trade and investment flows within North America would be closer alignment by Mexico and Canada with U.S. trade and investment policies with respect to China.
The upcoming review of USMCA presents a key opportunity for the three countries to address concerns about Chinese circumvention. While Mexico and Canada have already taken steps to address Chinese circumvention by aligning some tariffs on China with U.S. tariffs, more will be needed as the range of Chinese products that could be circumventing U.S. tariffs is much broader, and because Chinese products can also enter the U.S. market through investments in Mexico and Canada.
The U.S., Mexico, and Canada should work together, along with industry and other stakeholders, to review their trade and investment policies toward China, identify where differences create risks of Chinese goods entering each of their markets through one of the other partner markets, and then align their approaches to plug these gaps. Progress here would strengthen North America as an economic unit and underscore that U.S. strategic goals with respect to China are best achieved by working within North America rather than going it alone.
Authors


-
Footnotes
- Own calculations using data from U.S. Census Bureau, the Bureau of Economic Analysis, Data Mexico, and the World Bank World Integrated Trade Solution (WITS); https://www.brookings.edu/collection/usmca-forward-2024/
- Calculated from the figures in https://www.pewresearch.org/short-reads/2025/04/08/how-americans-view-trade-between-the-us-and-china-canada-and-mexico/.
- Author’s own calculations from U.S. Census Bureau: Economic Indicators Division USA Trade Online. Source: U.S. Import and Export Merchandise trade statistics.
- https://www.usitc.gov/research_and_analysis/trade_shifts_2018/us.htm and author calculations from U.S. Census Bureau: Economic Indicators Division USA Trade Online. Source: U.S. Import and Export Merchandise trade statistics.
- List 1: https://ustr.gov/sites/default/files/2018-13248.pdf, list 3: https://ustr.gov/sites/default/files/enforcement/301Investigations/83 FR 47974.pdf, and list 4: https://ustr.gov/sites/default/files/enforcement/301Investigations/Notice_of_Modification_%28List_4A_and_List_4B%29.pdf
The Brookings Institution is committed to quality, independence, and impact.
We are supported by a diverse array of funders. In line with our values and policies, each Brookings publication represents the sole views of its author(s).