I. The critical decision facing European regulators on Russia
As Russia’s invasion of Ukraine grinds past the three-year mark, and as the Trump administration creates distance from historical allies while threatening to withdraw American support for Ukraine, policymakers in Europe and the U.S. Congress face increased pressure to slow Russia’s ability to wage war. Last month, the European Union (EU) advanced its 17th sanctions package against Russia, which included a combination of export restrictions and newly sanctioned oil tankers. And just last week, U.S. Senators Richard Blumenthal (D-CT) and Lindsay Graham (R-SC) visited Ukraine to discuss additional punitive measures against Russia, which would build on an already historic set of sanctions levied since the invasion—including unprecedented moves to freeze Russia’s foreign exchange reserves, impose a price cap on Russian oil, and sanction hundreds of ships across multiple jurisdictions.1
As Western leaders grow impatient with the prolonged war and despite Ukraine’s success in holding off Russian advances on the battlefield, attention is increasingly focused on disrupting Russia’s oil trade. Notwithstanding the price cap on Russian oil exports, over time Russia has mitigated the cap’s impact by amassing a vast “shadow fleet” of oil tankers whose ownership and provenance are murky. By carrying Russian oil through European waters, shadow fleet ships not only enable the circumvention of sanctions and the perpetuation of Russia’s war in Ukraine but also present substantial environmental and fiscal risks to EU member states.
The hundreds of tankers comprising Russia’s shadow fleet are often old, poorly maintained, and protected by unreliable insurers. In the worst case, these tankers could cause a major oil spill without an insurer willing to pay out. Such a disaster could disrupt trade and force nearby countries to fund multibillion-dollar cleanup efforts. The danger these ships pose to Europe is only likely to grow, as the United States’ latest sanctions have increased pressure on oil shipping capacity out of Russia’s Pacific ports, potentially driving Russia to intensify shipping in the Black and Baltic Seas or to procure even older, more dangerous tankers.
While existing sanctions have had an effect, a program of incremental escalation may allow Russia time to further develop countermeasures and restructure its economy to reduce vulnerability to Western sanctions. The situation is therefore pressing, as EU countries that fail to seize the moment may soon face an ascendant Russia against which traditional levers of economic power are less effective. Should they choose to act, European policymakers have several options at their disposal, including collaborating with G7 counterparts to lower the level of the various price caps on Russian oil exports, banning the sale of ships to opaque buyers, more aggressively using vessel blocking orders and designations, and intensifying the enforcement of tanker insurance requirements. An ideal strategy—one that combines these approaches—would head off the problems created by uninsured vessels while striking a blow against Russia’s ability to evade the price cap and fund its war in Ukraine. In this essay, we lay out the decision facing European regulators and propose meaningful expansions in their approach to Russian sanctions.
II. Economic dependence on oil exports
The Russian economy has an outsized dependence on energy exports. Despite the country’s aim to diversify its economy, John McCain’s famous quip in 2014 characterizing Russia as a “gas station masquerading as a country” still holds some degree of accuracy. In 2021, before Russia’s major escalation of the war in Ukraine and the imposition of most sanctions, 14% of the country’s gross domestic product was derived from its energy exports. Out of this total, 6 percentage points were from crude oil and 4 percentage points were refined products such as gasoline, jet fuel, and lubricants. The export of natural gas, liquid natural gas, and coal made up the remaining 4 percentage points. Combined, these energy exports totaled approximately €205 billion in 20212; in January 2022, sales to Europe accounted for over half of Russia’s fossil fuel revenues.
The centrality of oil exports to Russia’s economy means that fossil fuels are a vital source of funding for the Russian government. From 2011 to 2021, taxes on the Russian oil and gas industry made up 44% of total Russian federal budget revenues. At the same time, while Russia has decidedly shifted toward a war-time economy since it invaded Ukraine, it remains heavily reliant on oil exports. In 2023 and 2024, the Russian federal government derived 30% of annual revenues from the oil and gas industries. This trend appears to be holding steady in 2025, as 29% of budget revenues were derived from oil and gas in Q1 2025.3

On the other side of the ledger, Western economies depend on Russia oil exports—but the dependence has shifted from direct exposure to indirect through Russia’s role as a global supplier. In the wake of the invasion, Europe quickly moved to reduce its purchases of Russian fossil fuels. The EU’s fifth sanctions package against Russia (out of a current total of 17) banned the import of Russian solid fossil fuels like coal. Its sixth package banned import of most seaborne crude oil and refined oil products, and its 12th package blocked imports of liquefied petroleum gas. The impact of the fifth sanctions package ban was acute: In 2021 the EU imported an average of 3.5 million barrels of oil per day from Russia, while in 2024 it imported only 0.4 million barrels per day—in other words, European imports of Russian oil fell by nearly 90%. In contrast to Europe, the U.S. and U.K. produce large amounts of oil domestically and were never directly dependent on Russian oil.
While the EU, U.K., and U.S. import little to no Russian oil, these economies remain exposed to Russian production due to its role in the global oil market. Russia has accounted for at least 10% of global crude oil production for over two decades, producing 12% of the world’s crude oil in 2024. If Russia were to suspend oil exports, global oil prices could rise by around 80%4—a shock sufficient to immediately weaken the global economy. Yet, relative to the post-invasion period, global prices are more protected from the threat of a Russian production shock for three reasons. One, Russia has revealed its preference for sustained production, acquiescing to the Western sanctions and maintaining production—even as some officials pledged to shut in exports rather than cooperate with the price cap on Russian oil implemented by the G7 (and described in the next section). Two, the Russian economy is markedly weaker today than it was in 2022, given years of sweeping sanctions, flight of human and financial capital, and the exit of Western companies. This weakened economy—coupled with a freeze on Russian central bank assets—has sharply eroded Russia’s fiscal position and thus increased Western policymakers’ leverage to impose strong sanctions without fear of Russia shutting in production. And three, as Eric Von Nostrand argues in the Wall Street Journal, relative to 2022 global demand is growing more slowly while supply is expanding—diminishing the price impact of any potential shut-in of Russian production.
In sum, Russia is more exposed to Western sanctions than it was at the start of its invasion of Ukraine and Western nations have generally more leverage to levy sanctions on Russia due to its economic vulnerability (somewhat offset by Russia’s countermeasures, again described in the following section). At the conclusion of this essay, we describe strategies to both limit Russian countermeasures and take advantage of Russia’s economic and fiscal vulnerability to strengthen the Western sanctions regime.
III. The price cap on Russian oil
In the wake of Russia’s invasion of Ukraine, Russia’s outsized dependence on oil exports presented this revenue source as a natural target for the G7 and other sanctioning countries seeking to stem the flow of funds that could be used for military operations. However, the rising cost of energy made sanctioning nations apprehensive that limits on Russian exports could kick off a global downturn. Following the invasion, the spot price of crude oil in the Urals market rose by about 27%—from around $73 per barrel in December 2021 to around $93 per barrel in March 2022—while Russia’s withdrawal from the European natural gas market elevated prices in Europe by over 350% between August 2021 and August 2022. Any sanctions regime against Russia would have to weigh reduced Russian revenue against the risk of sparking a global recession.
The “sanctioning coalition,” composed of the EU, the G7, and Australia, balanced these competing objectives by imposing a price cap on Russian crude oil and refined products. Technically, the price cap was not a single cap but rather three separate caps applied to crude oil, high-value refined products, and low-value refined products. The price cap on crude oil was set at $60 per barrel and went into force in December 2022, while the low- and high-value price caps, set at $45 and $100 per barrel, respectively, went into force in February 2023. Importantly, the caps only applied to transactions in which coalition service providers, such as insurers or financing banks, participated; any transaction using exclusively non-Western services was not subject to the various caps. (Most members of the sanctioning coalition, including the U.S., the EU, and Australia, also embargoed seaborne Russian oil.5)
The sanctioning coalition’s position was strengthened by the power of the “petrodollar,” that is, by the fact that oil-exporting countries exchange their resources for dollars. This practice dates back to agreements struck between the United States and Saudi Arabia in the 1970s and has made American dollars the de facto currency of the global oil trade. Petrodollars give the U.S. a degree of power over oil exporters like Russia since exporters depend on access to Western financial services to facilitate trade. As a result, the U.S. has the means to credibly disrupt the oil trade by blocking individuals or organizations from transacting in dollars and freezing assets held in the U.S.
Besides leveraging the petrodollar, sanctioning coalition countries also attempted to enforce compliance by capitalizing on their near monopoly over services historically required for large-scale shipping. The price cap was therefore accompanied by a sanctioning coalition ban on the provision of services such as financing, insurance, flagging, and customs brokering to ships that could not demonstrate cap compliance. Among these services, insurance is particularly important—in large part due to the historical monopoly on these services. Typically, all tankers have protection and indemnity (P&I) insurance, which covers liabilities (including fines) for problems like lost cargo, damage from collisions, and pollution from oil spills. The vast majority of oceangoing ships obtain their P&I insurance from the International Group (IG) of P&I Clubs; none of the IG’s constituent clubs are Russian.
The $60 price cap on crude oil was a substantial discount from the approximately $86 per barrel that Russia was receiving for its Urals oil in January 2022. However, since Russia (like most oil producers) charged more for its oil than the oil cost to extract, a cap below world oil prices but above Russia’s marginal costs of production preserved Russia’s incentive to export. The only question was whether Russia would comply with the price caps on its products or deliberately curtail production, though the latter would prove difficult given the country’s relatively primitive oil infrastructure and the associated challenges with quickly adjusting down supply.
Russia opted to maintain production, but global oil trading patterns quickly shifted in the aftermath of the caps’ implementation and the EU embargo on seaborn oil. Europe rapidly began sourcing its oil from Norway and the U.S., while Russia exports increasingly traveled farther distances to markets in Asia.6 These non-coalition importers, such as China and India, exerted relatively greater market power than they had previously, armed with the knowledge that Russia could not take its product to ask for a better price elsewhere. This drove a wedge between the price of Russian Urals crude oil and other exporters’ Brent crude. While the two types of oil had historically tracked closely, the discount on Urals crude spiked after the cap and has since persisted despite shrinking substantially (likely as a result of increased price cap evasion).

The preserved spread between Russian exports and comparable grade oil from other sources led to a general acknowledgment that the price cap initially worked in achieving its dual objectives of steady export volume and reduced prices. The stability of Russia’s export volume is well-documented, as average Russian crude oil export volumes have generally remained between four million and five million barrels per day—with similar stability in refined product shipments. Estimates of the price impact, though more difficult to document, were also favorable. Although the discount on Russian Urals crude now sits around $10, the discount once reached a previously unimaginable $30 per barrel.
Over time, however, the efficacy of the price cap began to wane as Russia amassed a massive shadow fleet and propped up an illegitimate shipping insurance industry. (We document the growing shadow fleet in Section IV and the rising prevalence of Russian insurance in Section VI.) A shadow fleet covered by dubious insurance meant that Russia could increasingly “trade around” the price cap, closing the wedge between Russian-sourced oil and products from other oil producers. At the same time, macroeconomic concerns related to the sharp rise in tariffs applied by the U.S. helped to drive down the price of oil to sub-cap levels, with Urals oil trading slightly below $60 per barrel in mid-May 2025 and refined products, including diesel, trading near their respective cap levels. Ultimately, these conditions meant that the price cap was weakly binding—or not binding at all—several years after its initial imposition. In Section VIII, we discuss options for strengthening the price cap, including stricter enforcement of insurance provisions and lowering the various caps on Russian oil.
IV. Russia’s massive shadow fleet buildup
The combination of embargoes on Russian energy and the imposition of the price cap by the sanctioning coalition intensified Russian attempts to evade sanctions. Russia’s most prominent strategy has been to accumulate a “shadow” or “dark fleet” of tanker ships. These ships often have obscure ownership structures, lack industry-standard insurance, and are older and in worse repair compared to other tankers. Amassing a shadow fleet has allowed Russia to trade around Western sanctions since these ships are not owned, insured, or financed by Western companies subject to G7 regulations. However, an upside to Russia’s acquisition of ships has been the cost: Since the escalation of the war, Russia has allocated around $10 billion to the purchase of these tankers, modestly depleting its funds available for military activity.
There is no singular definition of “shadow fleet,” and the characteristics of the fleet are fluid and have evolved over time. Some sources count ships with unknown beneficial owners as part of the shadow fleet, while others reserve the title for ships caught actively using deceptive methods to obfuscate their origins, cargo, and intentions.7 Yet others require that a ship meet both those requirements and additional conditions to be counted as part of the dark fleet. Recently, it has become increasingly common to use the more inclusive definition of any ship lacking IG P&I insurance and owned by a company outside of the EU or G7. For the purposes of this piece, we define the shadow fleet by drawing from external sources, including the Ukrainian government’s War and Sanctions website, a Kyiv School of Economics publication, and the U.S. Treasury’s list of shadow fleet ships hit by its January 2025 sanctions.
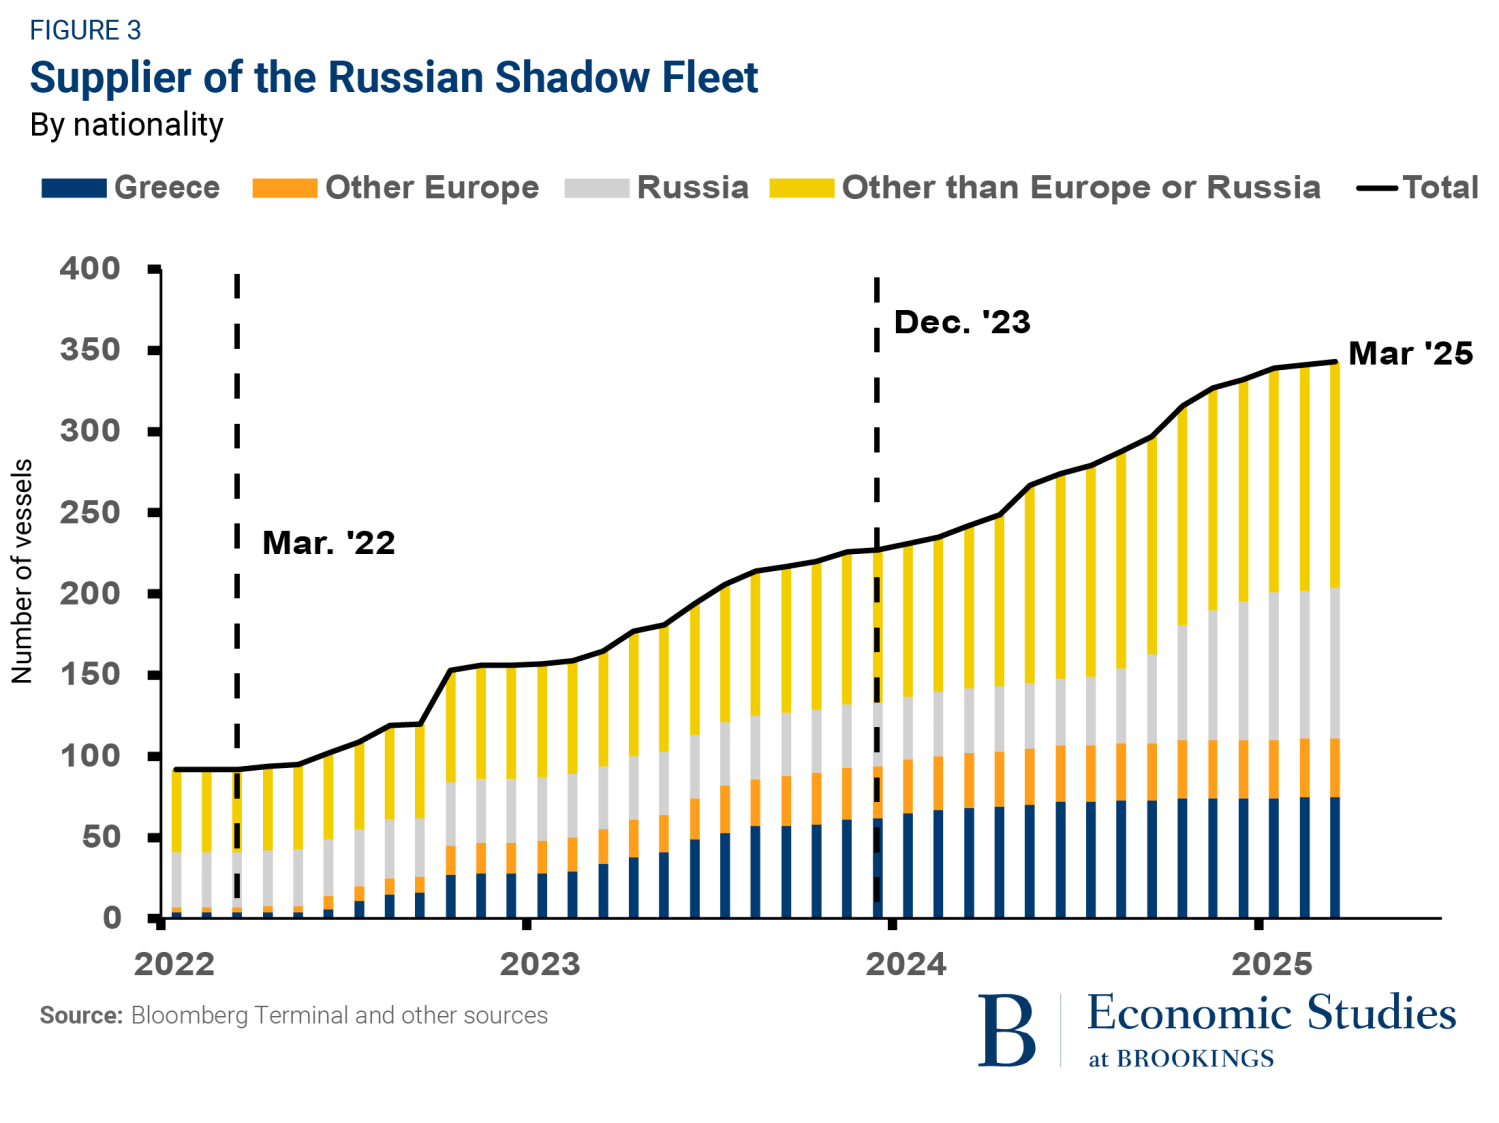
Using this definition, we estimate that the overall fleet increased from less than 100 ships before 2022 to nearly 350 today.8 As shown in Figure 3, this growth has been continuous and steady, with the shadow fleet expanding by approximately seven ships per month since early 2022 (a portion of the fleet was assembled before Russia invaded Ukraine because Russia has long needed a means of covertly moving limited quantities of oil). All told, the total shipping capacity of Russia’s shadow fleet has increased from 76 million barrels in February 2022 to 263 million barrels in March 2025—an increase of 246%.
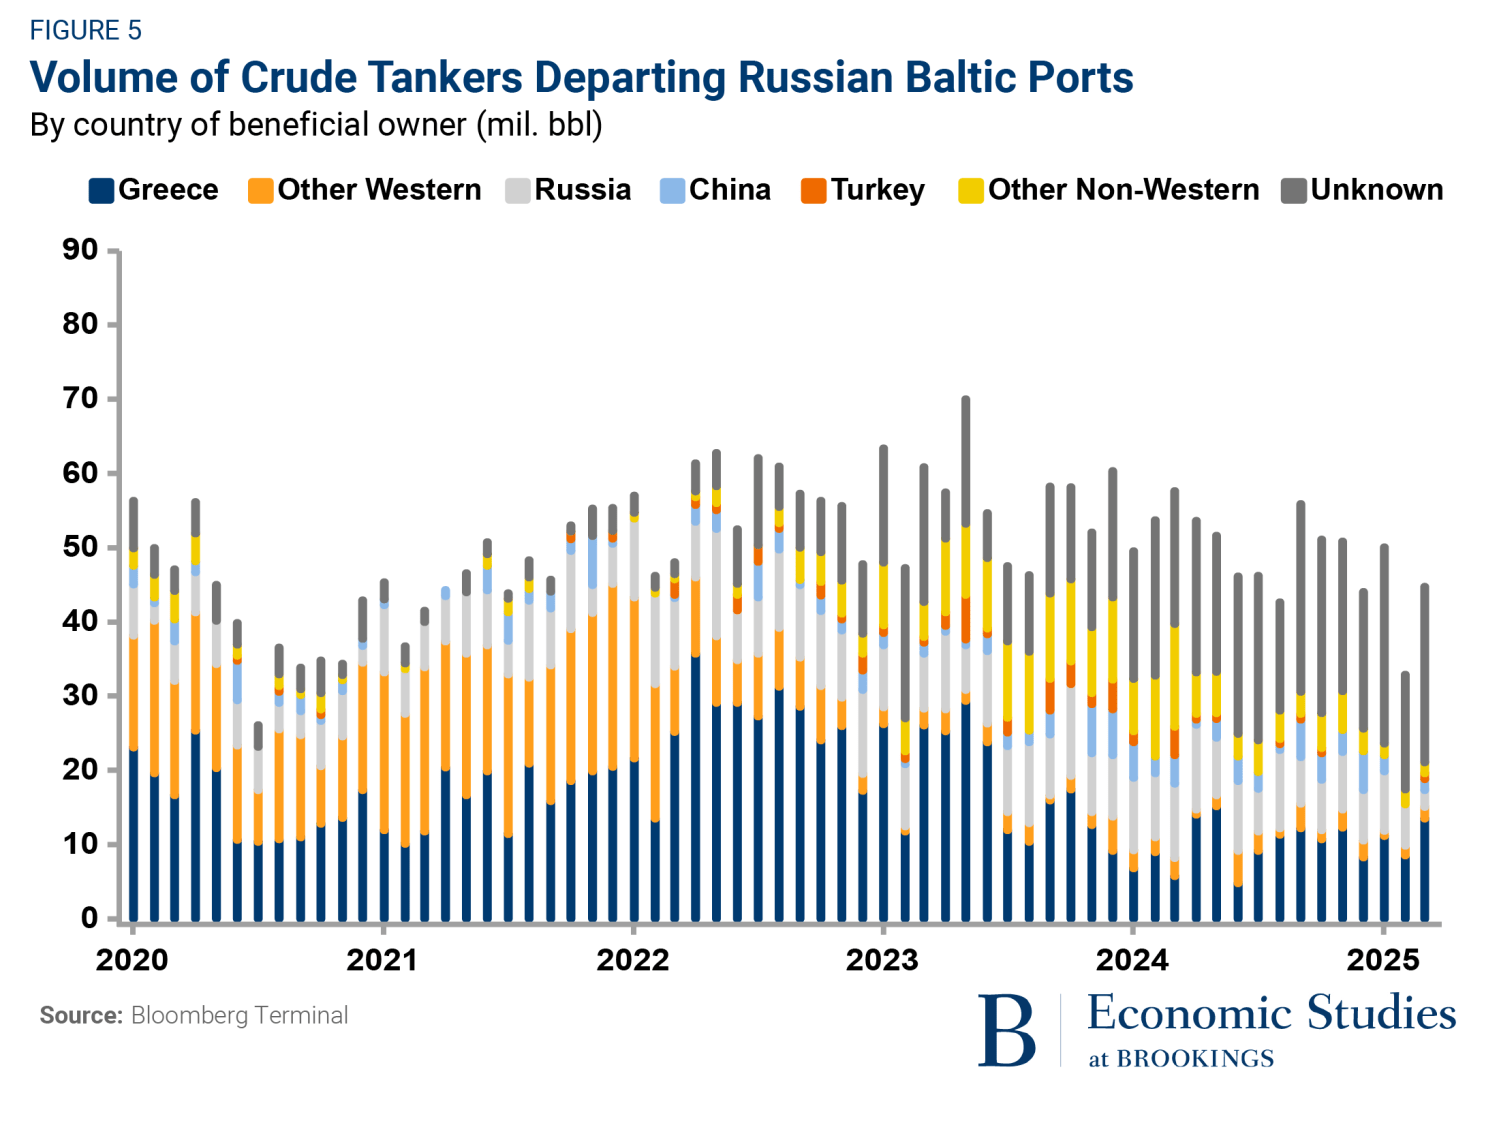
The shadow fleet now constitutes roughly half of Russia’s oil export capacity out of its Baltic ports, which are the single biggest exit point for Russian seaborne oil. Figure 5 illustrates this point, showing seaborne export volumes out of Russia’s Baltic ports by the nationality of beneficial owner of the transporting tanker.9 The gray bars, in which the owner is unknown, represent a crude proxy for the shadow fleet and show that Russia’s dependence on the shadow fleet has grown massively since February 2022.
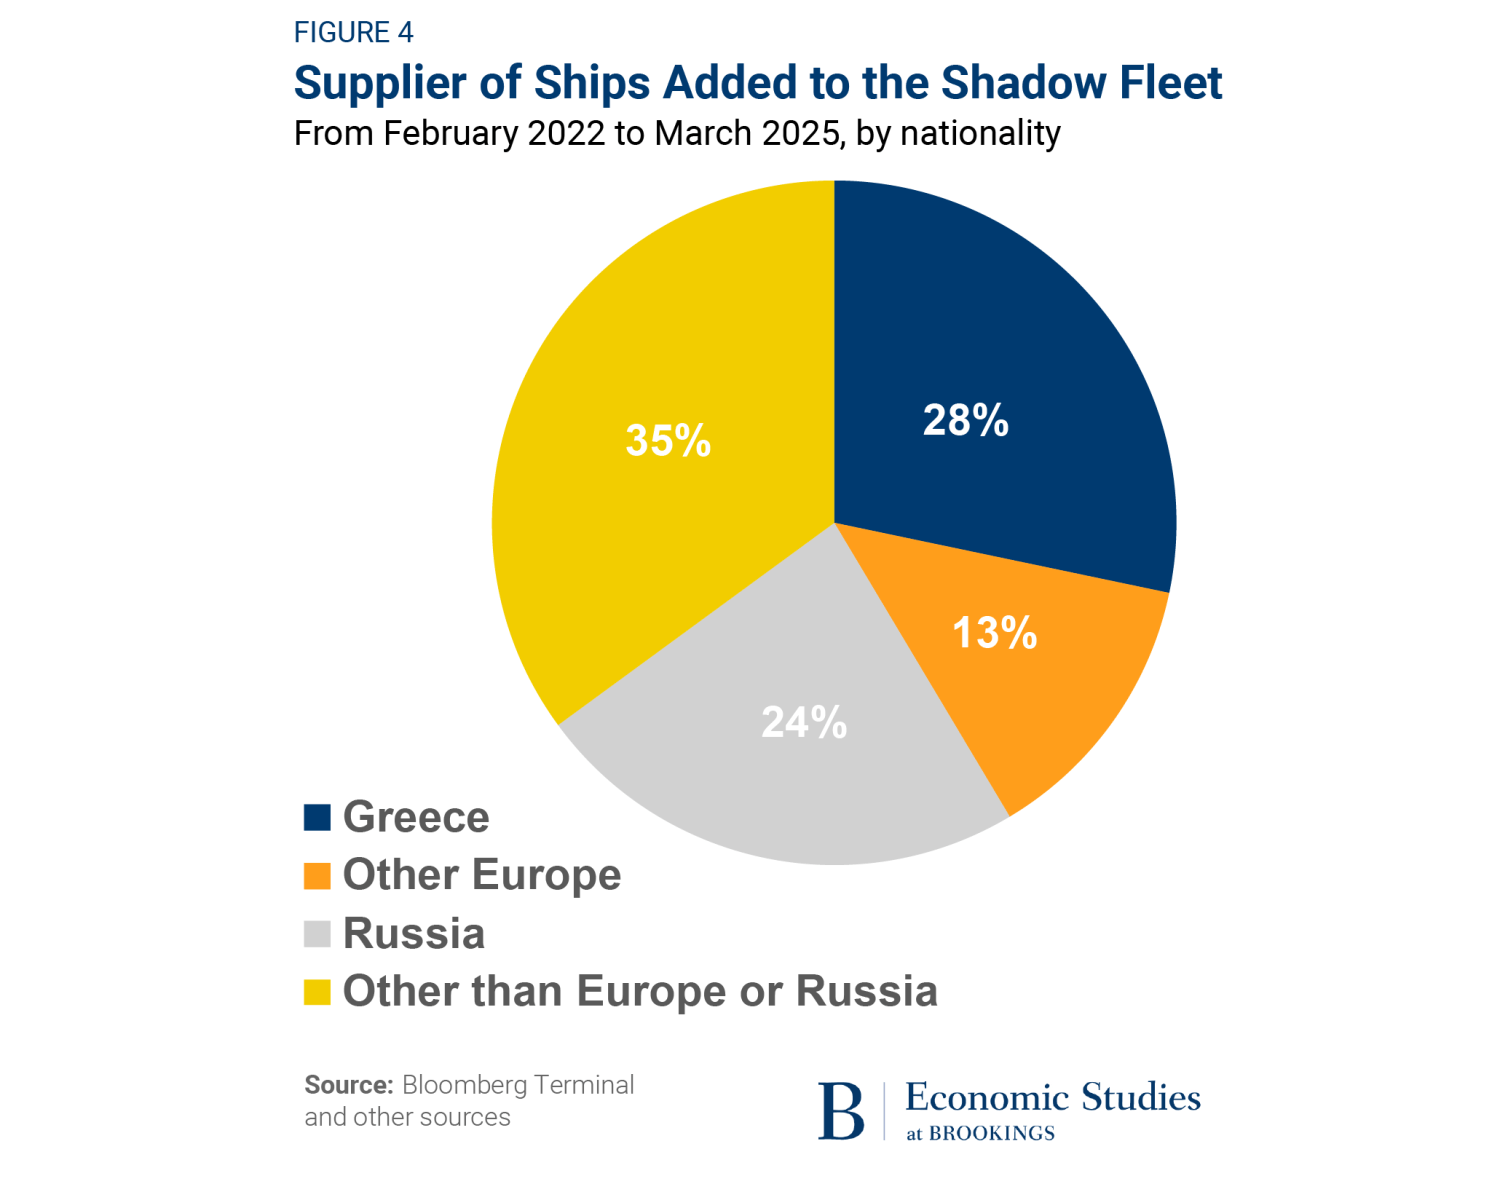
The acquisition of these 250 ships has largely been enabled by Western shippers’ willingness to sell to Russia, either directly or indirectly through industry middlemen. (These Western ships are often passed through third parties on their way to Russia, making it unclear how much the European sellers knew about their eventual destination.) Still, Russia’s expansion of the shadow fleet has been a boon to countries with strong shipping industries, such as Greece, because it has created a market for older, secondhand oil tankers—and these European sellers proved eager to sell aging ships to Russia at elevated prices. As shown in Figures 3 and 4, a substantial percentage of these ships were initially purchased from European companies. Formerly Greek-owned ships were particularly central to the growth of the shadow fleet. Between February 2022 and March 2025, 71 formerly Greek vessels entered the fleet, making up 28% of its 251 ship expansion over that period. This was more than double the contribution from the rest of Europe, which added only 33 ships, or 13% of new vessels.
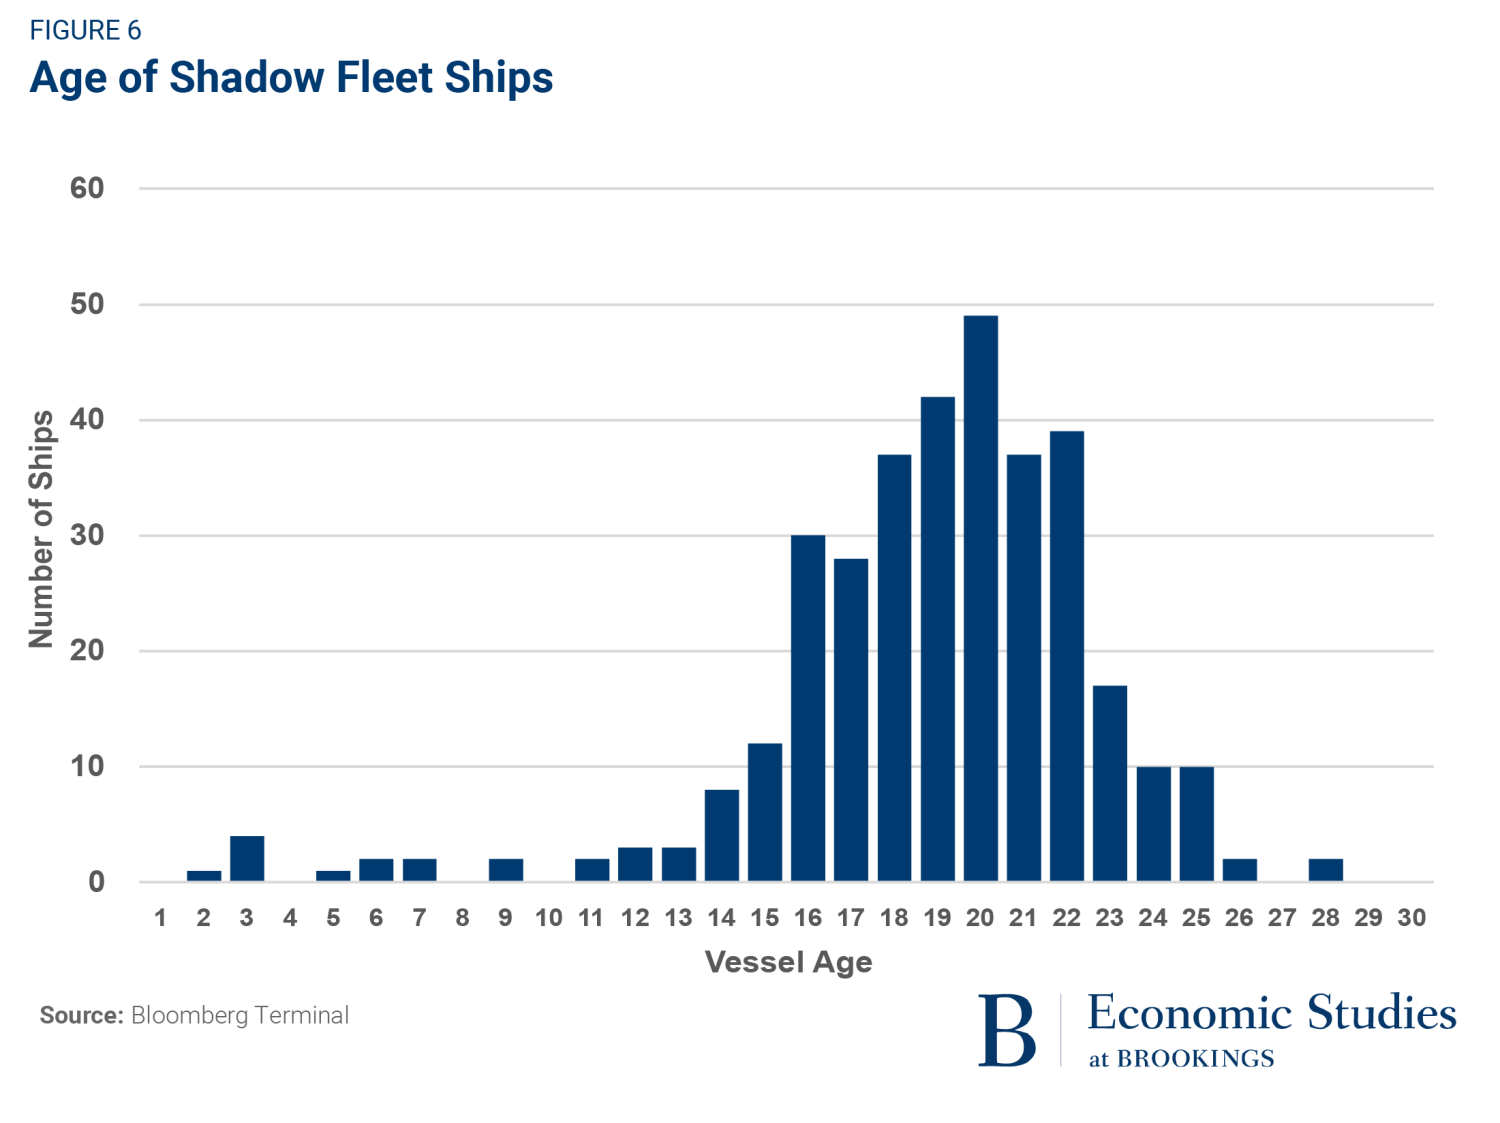
The vintage nature of the acquired ships presented Russia with a few unique advantages. First, and most importantly, older ships are cheaper and easier to obtain, as countries with large tanker fleets were eager to offload their aging stock of tankers rather than scrapping them. Second, since the duration of the coalition’s sanctions is unclear, investing in ships with shorter remaining operational lives is more cost-effective than buying or building new ships.10 Third, since these ships are nearing the end of their useful lives and are thus expendable, the consequences of overuse or insufficient maintenance are limited for Russia. All of these factors led the average age of ships in the shadow fleet to be substantially higher than that of tankers in general, currently standing at 18.9 years compared to the 2024 industrywide average of 13.2 years.
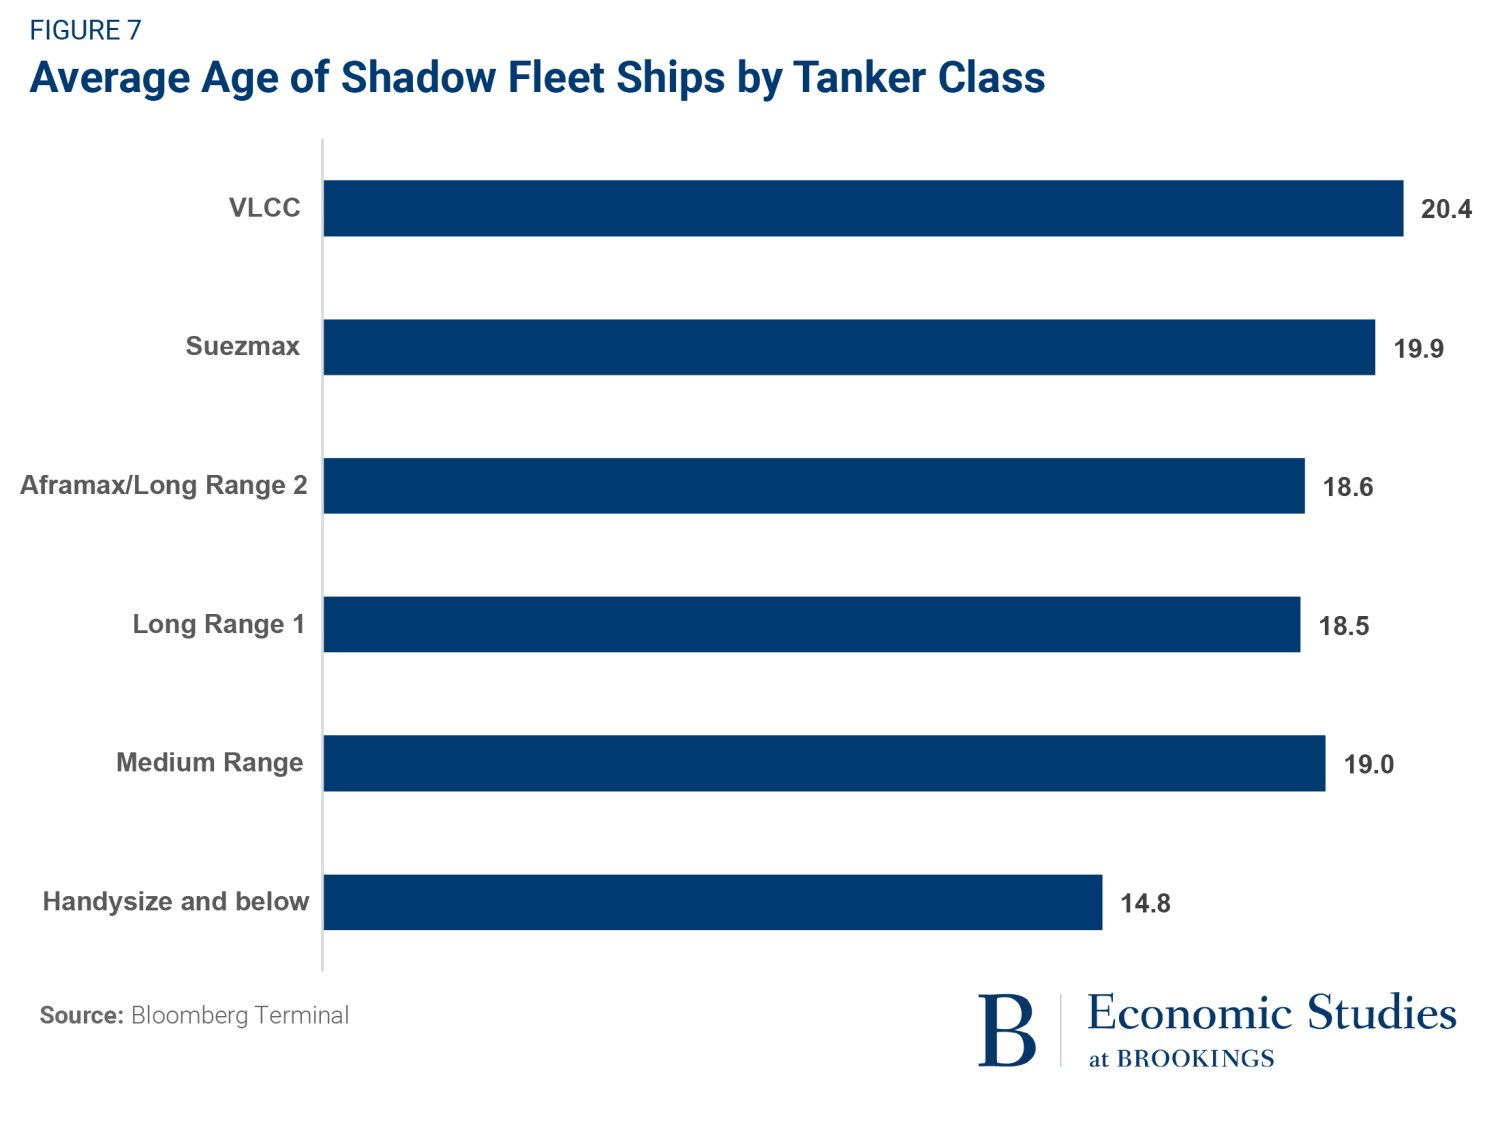
Figure 6 below presents a distribution of the age of shadow fleet tankers. The fleet is remarkably old, with over 90% of its constituent ships aged 15 years or older, and roughly half aged 20 years or older. This is concerning because larger tankers, which comprise the majority of the shadow fleet, experience structural failures with elevated frequency past 15 years. Comparing the different classes of tankers in the fleet, we see that the average ages of most classes are clustered around 18 to 20 years old. The largest classes in the fleet, the Suezmax and VLCC (very large crude carrier) ships, tend to be on the higher end of that spectrum, with average ages of 19.9 years and 20.4 years, respectively. The exception appears to be the fleet’s handful of smaller tankers (25,000 deadweight tonnage [DWT] or less), which have an average age closer to that of typical tankers—possibly because they demand a less substantial investment.
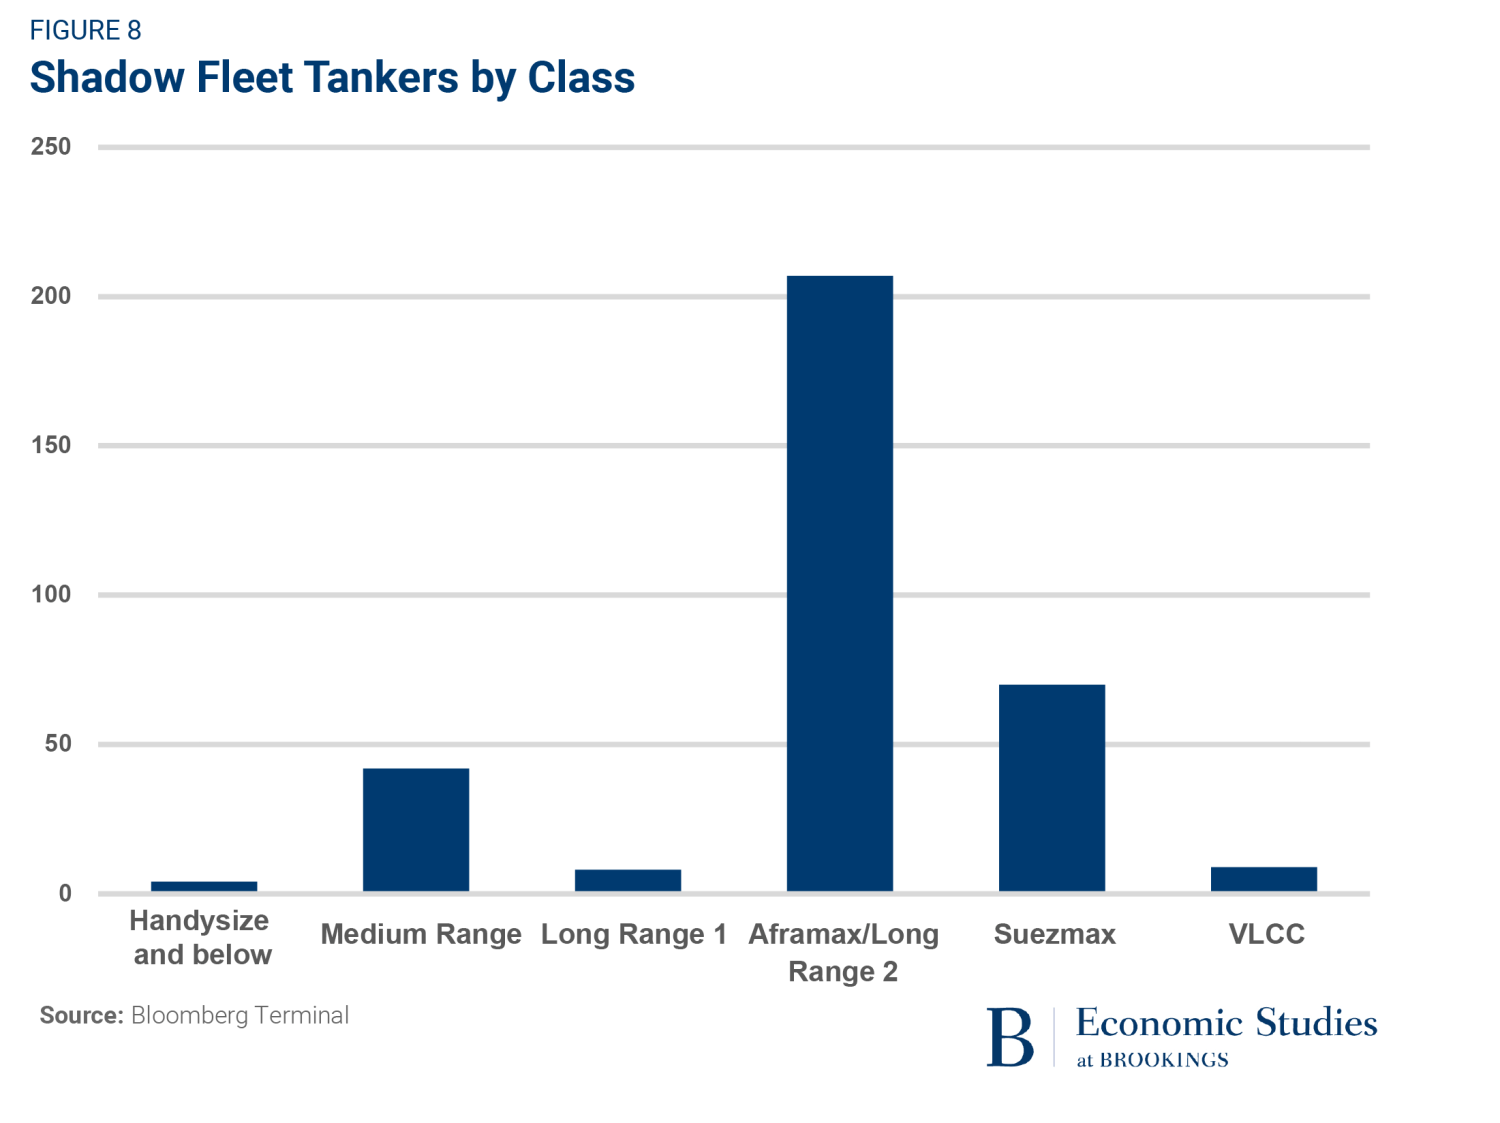
In addition to buying older ships, Russia also concentrated on certain classes of tankers when collecting its shadow fleet. As illustrated in Figure 8, a majority of vessels in our shadow fleet dataset (207 of 343 tankers, or 61%) belong to the Aframax/long range 2 (LR2) class.11 All but one of those Aframax/LR2 ships had capacities between 100,000 DWT and 125,000 DWT, accounting for the large bar for that range in Figure 9. Notably, our dataset also reveals that the vast majority of the shadow fleet is composed of tanker ships of long range 1 class tankers or larger—a combined 294 out of 343 ships (86%). Suezmax tankers, with a capacity between 125,000 DWT and 200,000 DWT, were the second most common class with a count of 70 ships.12 Medium range class tankers with capacities between 25,000 DWT and around 50,000 DWT are the third most common in our dataset, with a count of 42.

In sum, Russia has roughly tripled the capacity of its shadow fleet since its invasion of Ukraine, often using aging tankers that are around five years older than the global average. Despite the threats inherent in Russia’s acquisition of these vessels, the sanctioning coalition has not banned the sale of tanker ships to third parties who might transfer them into the shadow fleet. While EU policymakers considered such a ban for their 12th sanctioned package, they decided to drop it in favor of only obligating sellers from member states to notify “competent authorities”—meaning a seller’s national government—of “the sale of tankers to any third country.” That said, direct sales to “Russian persons and entities, or for use in Russia” are banned by default, though they can proceed if a national government provides a “derogation” (exemption) from this rule. Importantly, the continued flow of Western-origin tankers to Russia presents an opportunity for G7 regulators to introduce obstacles to this transfer; we address opportunities for such a development in Section VII.
As Russia’s shadow fleet has expanded, so too have Western efforts to sanction vessels attempting to evade the price cap. In particular, the sanctioning coalition undertook aggressive campaigns in early 2025 to sanction a large share of the shadow fleet. The most prominent of these efforts was the January 10 action by the U.S. Treasury that designated 183 vessels for sanctions, 75 of which belonged to the shadow fleet; the Treasury also targeted Russian energy companies Gazprom Neft and Surgutneftegas with sanctions. Additionally, it issued a determination authorizing (though not necessarily imposing) sanctions against anyone determined to have operated in Russia’s energy sector. Finally, the Treasury forbade Americans from facilitating the extraction of crude oil or the production of oil products for entities in the Russian Federation. Since the U.S. actions in January, the U.K. has also announced significant sanctions, sanctioning 101 vessels on May 9, 2025, and an additional 18 ships on May 20, 2025. The EU sanctioned 189 ships as part of its 17th sanctions package on May 20, 2025. The race to sanction Russia’s shadow fleet is therefore very much active and, if anything, accelerating in Europe.
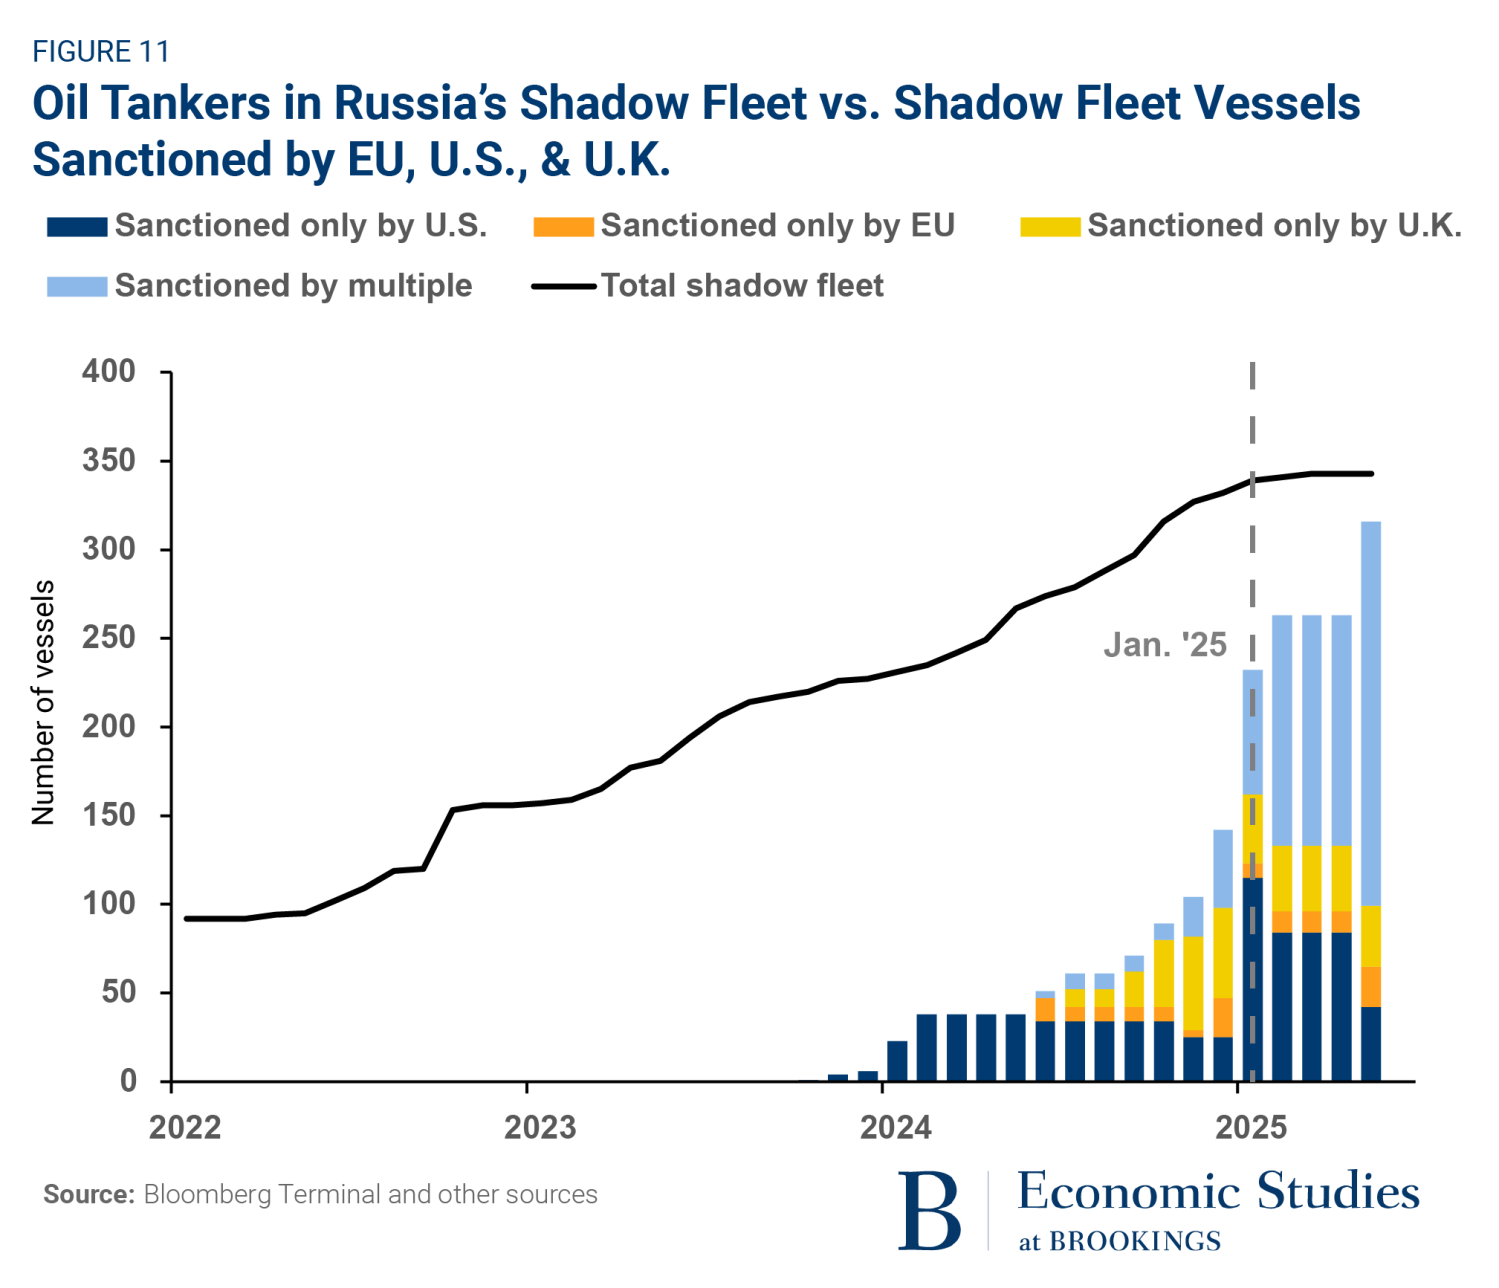
To quantify the race between Western sanctions and Russian evasion, we combine the data presented above on the shadow fleet’s size with information on the imposition of Western sanctions. This allows for the comparison of the aggregate size of the shadow fleet to the population of sanctioned vessels. As of May 2025 (i.e., including the recent wave of sanctions by the U.K. and EU), we find that 316 of the 343 Russian tankers in our shadow fleet dataset have been sanctioned under the authority of one or more of the EU, U.K., and U.S. Figure 11 illustrates how the wave of sanctions implemented so far in 2025 raised the share of sanctioned ships to 92% as of May.
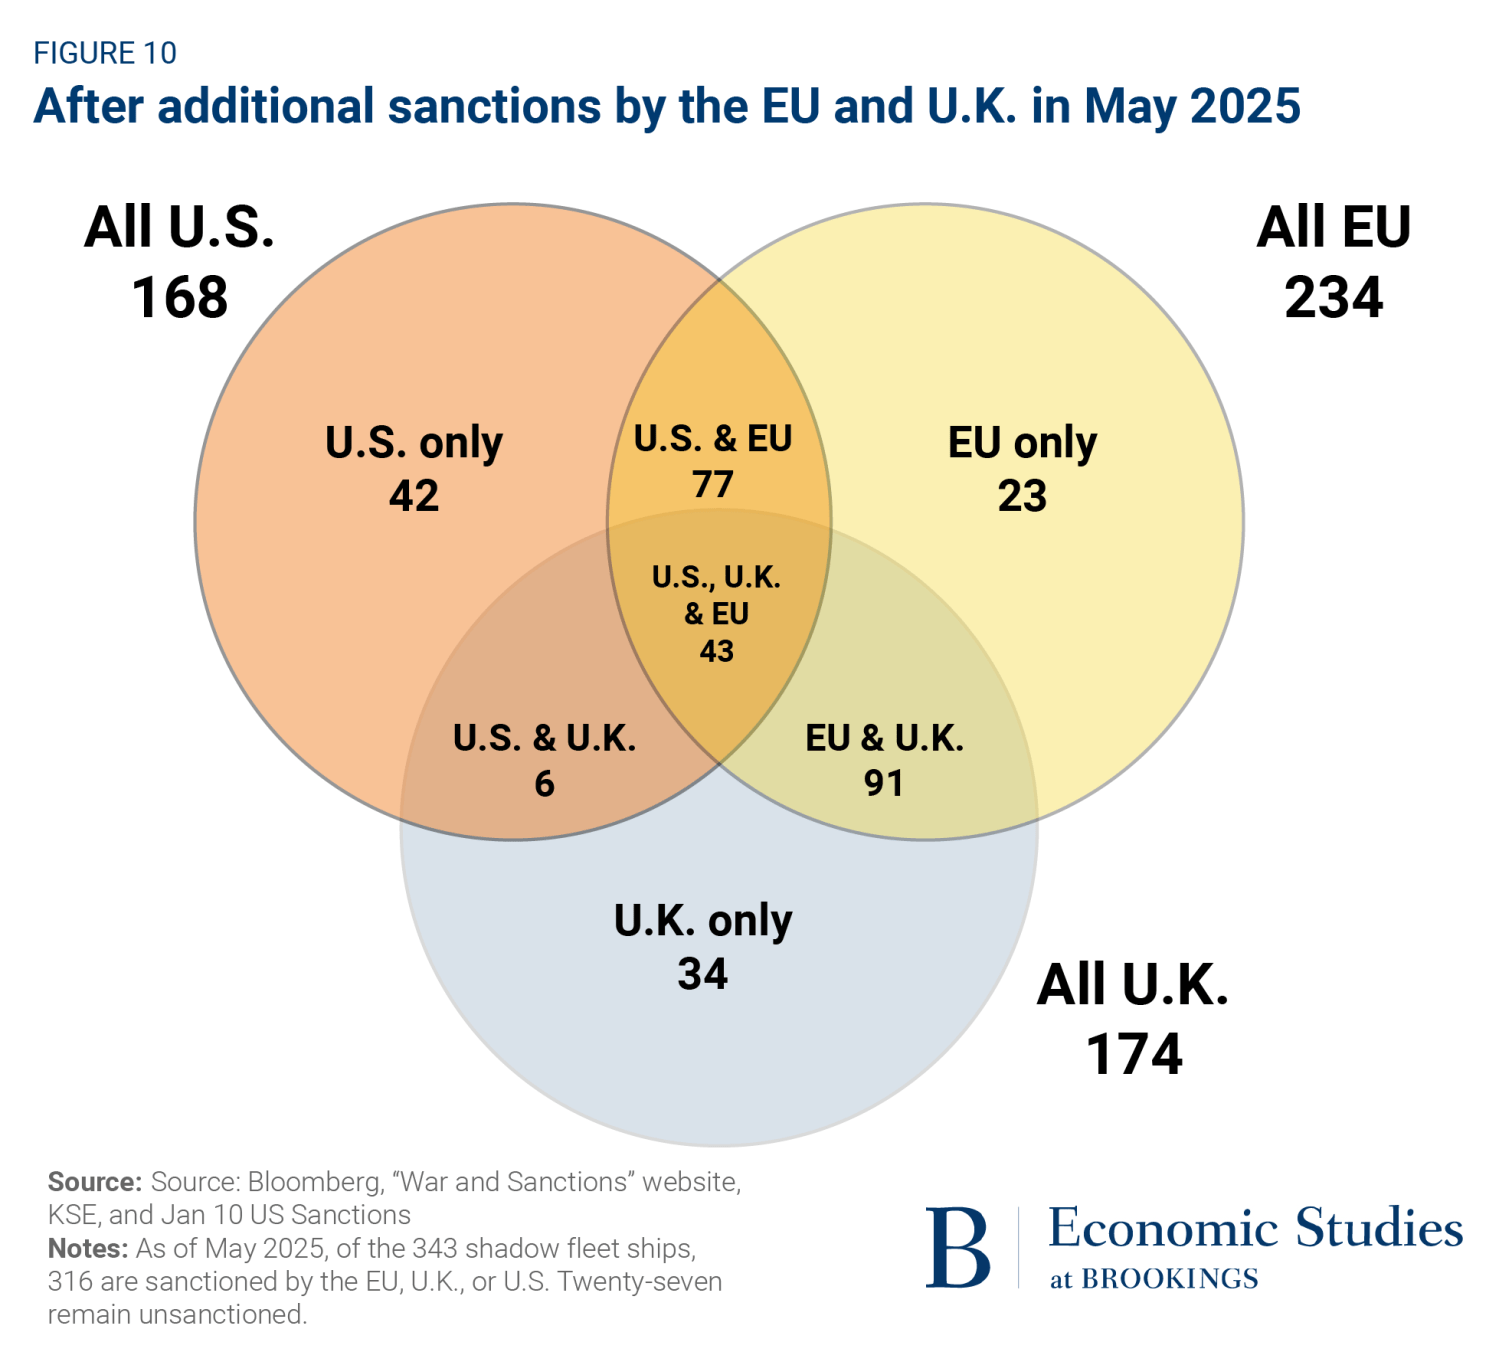
As more ships have been sanctioned, the overlap between U.S., EU, and U.K. sanctions has increased. As shown in Figure 12, over two-thirds (217 out of 318, or 68%) of shadow fleet ships sanctioned as of May 2025 were targeted by more than one sanctioning authority. Of these ships, only 43 were sanctioned by all three entities. In contrast, 99 tankers were sanctioned by just one entity. As of May 2025, 27 ships in our dataset remained entirely unsanctioned.

Our data also allow us to make observations about the relative effectiveness of Western sanctions in impacting the activity of shadow fleet ships. We construct seven baskets of sanctioned ships, which correspond to the seven distinct areas in Figure 10. We then track volumes transported by ships in the various baskets around the pivotal month of January 2025, when the U.S., U.K., and EU unleashed a wave of sanctions on the shadow fleet. (These baskets contain different numbers of ships and may also differ in terms of the characteristics of their constituent vessels.) While the output presented below cannot be considered causal, to our knowledge, it is the first evidence on how sanctions by different jurisdictions perform.

For the seven baskets of sanctioned shadow fleet ships, Figure 13 shows the year-over-year change in volumes from the four months immediately after the January 2025 sanctions wave (February through May 2024 to February through May 2025) but does not yet incorporate the recent wave of EU and U.K. sanctions as it is too early to discern their impact. The fall in activity is largest for the 34 ships sanctioned jointly by the U.S., U.K., and EU, while U.S.-only, joint U.S. and U.K., and joint U.S. and EU sanctions are also correlated with notable declines. U.K.-only sanctions—in isolation—appear to have limited impact on ship activity, but volumes do register a material fall for joint EU and U.K. sanctions, as well as EU-only sanctions. All told, this analysis suggests that tanker-specific sanctions are more effective when a tanker is sanctioned by multiple entities and, especially, when sanctioned by the U.S. in conjunction with another jurisdiction.
The shadow fleet expansion is just one evasion tactic used by Russia. It has also adopted myriad strategies to frustrate regulators in sanctioning countries. For example, shadow fleet ships have taken to meddling with their automatic identification systems (AIS), blacking out their location, or “spoofing” data to mislead observers about their identity or position. Spoofing has allowed tankers carrying Russia oil to make sales over the price cap while maintaining coalition-provided insurance. Unfortunately, enforcing AIS regulations is generally left to a ship’s flag state, which presents a problem since shadow fleet ships intentionally adopt “flags of convenience” from countries that are unlikely to punish them for deceptive behaviors and regulatory violations. Another common strategy is to engage in ship-to-ship transfers of crude oil, potentially multiple times in one voyage. Such transfers can blend oil from multiple countries, confusing the original source of Russian oil and making oversight less consistent.
Many of these deceptive tactics are only necessary because Russian exporters still care to maintain their access to coalition service providers to some degree. Another avenue by which Russia evades the price cap is by forgoing coalition-provided services altogether. In a future section, we discuss opportunities for Western authorities to subject already-sanctioned shadow fleet ships to additional layers of sanctions, while also increasing the share of the fleet subject to any level of sanctions, both of which would limit Russia’s opportunities to forego Western services in the oil trade.
VI. The looming risk of an environmental disaster
Recent events justify concerns about oil spills from Russian vessels. On December 15, 2024, two Russian tankers ran aground in the Kerch Strait of the Black Sea, which separates Russia from Crimea, a region of Ukraine that Russia seized more than a decade ago. The ensuing oil spill led Russia to declare a state of emergency in occupied Crimea, with a senior scientist in the Russian Academy of Sciences describing it as “the most serious environmental catastrophe in Russia since the beginning of the 21st century.” Chillingly, the tankers were only carrying around 8,600 tons of crude oil between them, and only 5,000 tons were spilled at most—less than 5% of the capacity of the typical Aframax/LR2 shadow tanker.
Recent Black Sea disasters aside, shadow tankers’ Baltic Sea routes should be particularly concerning to EU countries. Even before the recent sanctions, the Baltic transported approximately 40% of Russia’s seaborne crude oil exports (as of 2024). Tankers departing Russia through the Baltic pass near the coasts of Finland, Estonia, Sweden, Germany, and Denmark—at times coming within 30 miles of cities like Helsinki. Furthermore, while sailing to markets that have not adopted the price cap—mainly China and India—shadow fleet vessels from the Baltic also threaten the coastal waters of the United Kingdom, France, Spain, and Portugal, among others. A full-scale oil spill at any point on this journey would be an unprecedented environmental and economic disaster, particularly if it occurred at “chokepoints” such as the Danish straits or between Finland and Estonia in the Viro Strait. There have already been close calls: In 2023 the midsize tanker Canis Power lost power and nearly ran aground in the Danish straits. The ship was carrying 340,000 barrels of Russian oil, and the crisis was only averted because the ship managed to drift into deeper waters.
This scenario is bound to repeat itself—but may not always end so well. At 18 years old, Canis Power was nearing the end of the normal operational life of a tanker, which generally lasts around 20 years. However, the ship was roughly the same age as the average tanker in the shadow fleet. After 20 years, decades of constant wear and abuse make ships increasingly vulnerable to catastrophic hull or propulsion system failures. The risks of a shadow fleet spill may be exacerbated by sanctions designed to weaken Russia’s Sovcomflot fleet (Russia’s largest state-owned shipping company). As sanctions have expanded to cover progressively more of Russia’s officially owned tankers, a greater percentage of oil exports are being pushed toward the shadow fleet, increasing strain on the already rickety ships. To make matters worse, shadow fleet tankers navigating the challenging Danish straits are progressively foregoing the assistance of experienced Danish pilots. These factors combine to make spills increasingly likely.
A back-of-the-envelope calculation puts the total volume of oil aboard an average shadow fleet tanker at approximately 700,000 barrels, which is roughly one-fifth of the volume released in the Deepwater Horizon oil spill in 2010. Whether through mechanical failure or pilot error, a spill of this magnitude would have severe and long-lasting ecological consequences, as oil destroys the habitats of native fish, birds, and marine mammals. Additionally, exposure to toxic chemicals in the oil can cause smaller, more susceptible prey animals to die off, leading to cascading effects throughout the food web. In the Baltic, already under environmental stress from centuries of high ship traffic and heavy fishing, a spill could push critically endangered species such as the Baltic harbour porpoise over the brink into extinction. Even for species that do recover, local populations could take more than 20 years to return to pre-spill levels, as was the case for sea otters following the 1989 Exxon Valdez spill. Finally, cleaning up an oil spill can be an environmentally fraught endeavor in its own right, producing a great deal of waste depending on the cleanup strategies used.
A large spill would also inflict serious economic costs. Besides the straightforward expense of the cleanup, a spill could cripple regional industries and stymie international trade. Naturally, the time and money required to clean an oil spill can vary greatly depending on factors such as the quantity of oil spilled, its location, and the rate of spillage. Past episodes like the Exxon Valdez spill have shown that cleanup can run up to roughly $5 billion to $10 billion in inflation-adjusted terms—and it is worth noting that the aforementioned spill saw “only” 261,905 barrels of crude oil spilled, a fraction (one-fifth) of the Valdez’s 1.3 million barrel cargo and far less than what is carried by most shadow fleet ships.13 A spill in the Baltic Sea could also harm important industries such as coastal recreation, which is estimated to provide nearly $30 billion in value to countries along the Baltic annually, without even accounting for cross-border tourism. Possibly the most serious consequence of an oil spill in the Baltic Sea—particularly in the Danish straits or the Viro Strait—would be an obstruction of shipping lanes. The Danish straits, for example, saw 2.7 million barrels of crude oil and condensate pass through per day in 2023, or about $220 million per day at average prices for Brent crude oil that year—and even more if other types of petroleum products are taken into account, to say nothing of the value of all shipped products. A disaster that prevents safe passage through the straits for even a few days could therefore freeze billions of dollars of goods, causing supply chain problems that persist long after the blockage is cleared.
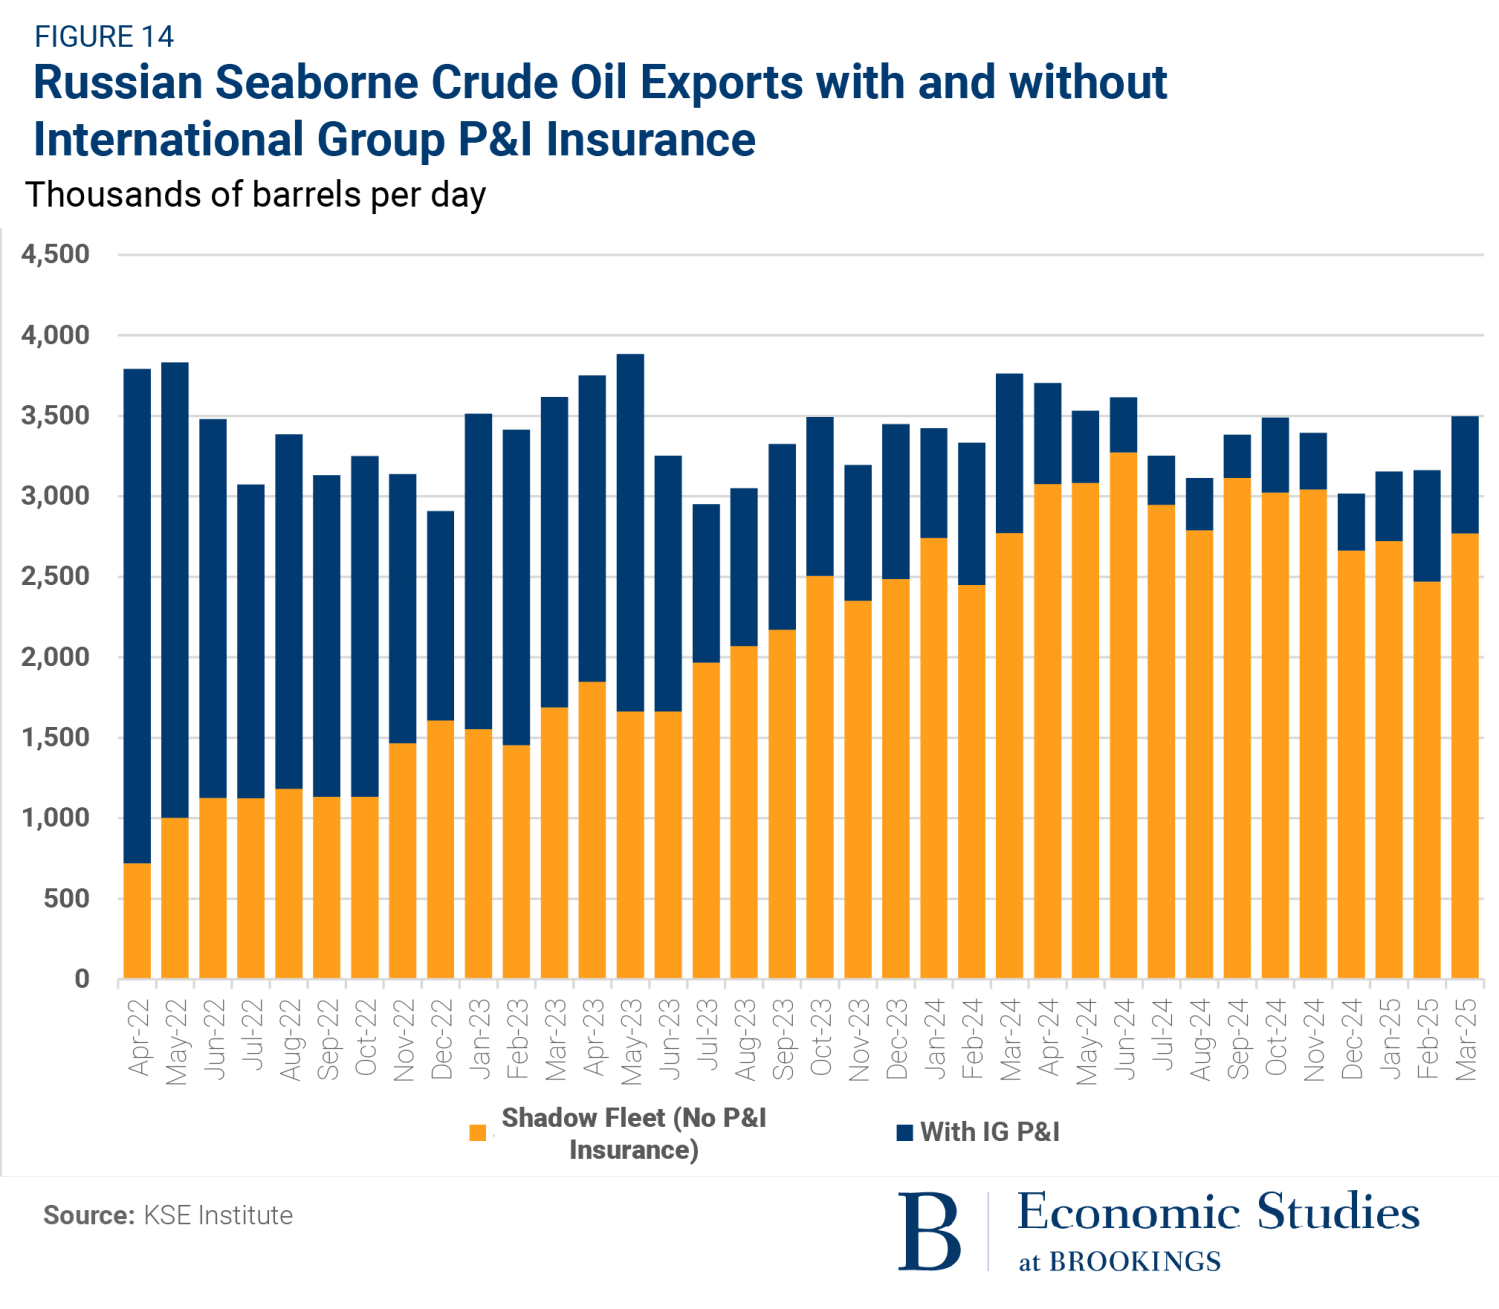
Shadow tankers’ high risk of spills, and the consequent environmental devastation and economic disruption, are unfortunately only half the problem. The other half is that, should such a disaster occur, the lack of standard insurance and reinsurance for a growing number of Russian tankers means that Russian shipping and insurance companies are unlikely to contribute financially. As shown in Figure 14 below, smaller and smaller volumes of Russian crude exports are moved by ships with IG-provided P&I insurance, falling from over 80% of total crude exports in April 2022 to only around 20% in March 2024. Russian tankers have either completely forgone insurance or turned to less-reputable insurance providers such as the Russian company Ingosstrakh, which has been targeted for sanctions by the U.K. and the U.S. As a result of these sanctions, Liberia, which flags 16% of global shipping capacity, no longer permits Ingosstrakh to provide proof of insurance to Liberian-flagged vessels.
The dearth of reputable insurance is compounded by uncertainty regarding the capacity of smaller (relative to the IG) insurers like Ingosstrakh to pay claims in the event of a significant disaster. Ingosstrakh is simply not equipped to pay for a major oil spill on its own—in 2023 its combined policy liabilities were only $2.4 billion, less than the potential cost of a single large spill. It also has less access to one of the main benefits of the IG: the ability of member P&I Clubs to pool their risks through “reinsurance.” Reinsurance, which refers to layered policies purchased by insurance companies to protect themselves in case they ever have to pay particularly large claims, was one of the services banned as part of the price cap. Although Russia has its own reinsurance industry, it is dominated by the central-bank-owned Russian National Reinsurance Company (RNRC), which could present systemic risks to the country’s economy. The RNRC has low levels of capitalization relative to its responsibilities, creating concerns that it would quickly exhaust its resources in an emergency. In the next section, we describe options for European regulators to demand more reputable insurance for tankers traveling in their waterways as a strategy for increasing frictions in the Russian oil trade and better protecting against an environmental disaster.
VII. Potential extensions of Western sanctions
The oil-related sanctions regime is at an inflection point, especially with respect to choices faced by EU policymakers. The early success of the price cap on Russian oil is threatened by Russia’s ability to amass a massive shadow fleet of oil tankers, which—coupled with porous enforcement efforts—has allowed Russia to close the gap between the price charged for its oil and that charged by other producers. At the same time, the advanced age of Russia’s shadow fleet presents an environmental risk to EU waterways, while Russia’s utilization of substandard insurance may present fiscal risks to EU nations in the event of a spill. Last, recent drops in the market price of oil presents an opportunity to revisit the price cap levels established by the sanctioning coalition several years ago. To help ratchet up pressure on Russia and limit its ability to continue raising funds for its military efforts, we present four options for new sanctions measures. This list is not exhaustive; other sources of possible sanctions extensions include nine proposals for additional sanction policies presented at a May 2024 event at the Brookings Institution, extensions to U.S. sanctions policy outlined in a May 2025 letter from Senators Jeanne Shaheen (D-NH) and Elizabeth Warren (D-Mass.), a series of proposals released by Sen. Sheldon Whitehouse (D-RI, and, perhaps most prominent, a Senate bill, the Sanctioning Russia Act of 2025, that would levy embargo-level tariffs on any country that purchases Russian fossil fuels. That bill has 80 co-sponsors in the Senate.
It is imperative that the sanctioning coalition address Russian oil trades that happen both within and outside the price cap’s purview. To help close opportunities for “trading around” the price cap, the coalition should aim to arrest the flow of tankers to Russia, aggressively sanction the whole shadow fleet, and disallow the use of subpar Russian insurance in EU waterways. To strengthen the impact of trades that occur under the price cap’s purview, the sanctioning coalition should consider lowering the levels of the price caps. We elaborate below.
Subject the shadow fleet to comprehensive sanctions. Of the 343 tankers in Russia’s shadow fleet, only 43 (12.5%) are sanctioned jointly by the EU, U.K., and U.S., while 27 (7.9%) are unsanctioned by any of the three entities. The path forward is simple: The three sanctioning bodies should strive for comprehensive coverage across the shadow fleet, as the impact of sanctions on vessel traffic out of Russia appears to increase with the number of entities imposing sanctions. To reach comprehensive coverage across the sanctioning coalition, the U.K. would need to sanction an additional 169 tankers, the EU an additional 109 tankers, and the U.S. an additional 175 tankers. In an appendix, we provide a list of the tankers to sanction for each entity with corresponding IMO (International Maritime Organization) codes for each.
Prohibit the sale of tankers to Russia. As mentioned above, the 12th sanctions package by the EU imposed monitoring on the sale of EU-owned vessels to third parties and essentially prohibited the direct sale to Russia. Unfortunately, vessels joining the shadow fleet continue to show previous EU ownership, especially Greek ownership. Avoiding this requires full transparency and accountability on the ownership chain of EU-owned vessels when they are sold. This means that an oil tanker sold to a third party cannot be on-sold without proof that the next buyer is well identified and not allied with Russia or Russian interests. While this would cut the provenance of Western-owned ships to the shadow fleet to zero, it would not stop the fleet’s growth entirely since many vessels join from non-coalition countries. However, given the finite size of the global shipping fleet, this would be sufficient to make a serious dent in the shadow fleet’s future growth.
Demand sufficient insurance for tankers passing through EU waterways. A straightforward strategy to handcuff Russia’s shadow fleet is to condition passage through EU coastal waters on proof of sufficient P&I insurance. This proposal has been advanced previously, most notably by Craig Kennedy in a Brookings policy brief and by Benjamin Hilgenstock, Anatoliy Kravtsev, Yuliia Pavytska, and Anna Vlaysuk in a report published by the Kiev School of Economics. It dictates that if Russia attempts to ignore insurance disclosure requirements, the sanctioning coalition should enact blocking orders on noncompliant vessels, effectively prohibiting these tankers from transacting with Western service providers and preventing sanctioned entities from transacting in dollars. While there have been reports that the U.K. and an array of maritime nations in the EU are beginning to demand sufficient insurance, efforts remain scattered and inconsistent, enabling shadow fleet vessels to satisfy requirements with phony insurance documents. To address this issue, the navies and coast guards of European states should partner with industry regulators to ensure that documents come from licensed providers. If enforced rigorously, an insurance requirement policy would require tankers carrying Russian oil to either obtain standard insurance, necessitating compliance with the price cap and driving up auxiliary costs for the shadow fleet, or cease its above-price-cap operations.
Lower the levels of the price caps. The initial price cap levels of $60 per barrel on crude oil, $100 per barrel on high-value refined product, and $45 per barrel on low-value refined product were established to account for both policy uncertainty and political realities—coupled with the desire to limit Russia’s gains from the oil trade. Regarding policy uncertainty, the levels were designed to incentivize continued Russian production, with the assumption that the likelihood of intentional shut-in would increase as price caps approached the marginal cost of production. With respect to political realities, the sanctioning coalition required unanimous consent across not only the G7 but also the EU (itself requiring all 27 member states to agree to a particular cap level). Put differently, the caps were the lowest possible levels that could achieve approval across more than 30 nations while likely preserving Russian incentives to produce.
With the benefit of several years of hindsight, it is time to consider a downward adjustment for three key reasons. First, despite some early statements by senior officials on the contrary, Russia has shown a proclivity for continued production—and is in an even more desperate fiscal position than it was when the price cap levels were established. Second, concerns over a global recession owing to an escalating trade war have helped push down global energy prices, with the price of Urals oil hovering just under the price cap on crude oil as of this writing. And third, Russian countermeasures have matured, heightening the need for more aggressive actions by the sanctioning coalition.
Our suggested criteria for establishing new cap levels include setting the level substantially below the current and future market price so as to formalize the discount on Russia oil, providing clear forward guidance for any possible future changes to the price cap levels, maintaining the inaugural framework of three distinct price caps covering the vast bulk of Russian exports, and revising downward the probability of a Russian shut-in given the recent experience of continued production. With these criteria in mind, a downward adjustment in the price cap to around $50 per barrel for crude, and similar downward adjustments to refined products, would be prudent.
In summary, Russian countermeasures to sanctions efforts have confronted U.K., EU, and U.S. policymakers with a choice: either ramp up enforcement or allow Russia to proceed unchecked. Since the latter option risks environmental disaster and permits the Russian economy to continue limping along, we recommend a stronger sanctions approach.
Related Content
Authors


-
Acknowledgements and disclosures
The authors thank David Wessel and Eric Von Nostrand for helpful comments.
-
Footnotes
- While the consequences of being sanctioned vary across jurisdictions, in practice sanctioned ships face markedly higher barriers to trade, including losing access to financial and insurance services and potentially being denied access to certain ports.
- “The Russian economy and world trade in energy: Dependence of Russia larger than dependence on Russia, Oesterreichische Nationalbank”
- Despite the consistent importance of fossil fuel revenues, the mechanisms by which the Russian Federation taxes its oil and gas industries has changed somewhat since the invasion of Ukraine. Between 2019 and 2024, Russia phased out export duties on crude oil and some refined products, including lubricants and waxes. As a result, the Russian government has come to depend more heavily on the Mineral Resource Extraction Tax (MRET), which targets the gross revenues of fossil fuel companies. Notably, the MRET on the extraction of crude oil made up the majority of federal fossil fuel revenues even before the transition away from export duties. The shift away from export duties was likely intended to insulate the federal budget from oil price volatility and instead place the burden on private sector producers. In 2021 the Russian government also fully implemented a potential alternative to the MRET, the Additional Profits Tax (APT), which was designed to better account for differences between oil fields.
- One study estimated that the price elasticity of demand for crude oil is –0.14, while another empirical study found that it was approximately –0.18. Using an elasticity of –0.15, and making assumptions about the oil market similar to those made by Wolfram, Johnson, and Rachel (2022), we estimate that a 12% supply reduction would increase prices by 80% ((–0.12)/(–0.15) = 0.80).
- Exceptions to the price cap and embargo agreements were made for some countries, such as Japan.
- As Europe weaned itself off Russian fuel, Russia shifted its attention East, expanding its trade of crude oil to India and oil products to Turkey. Before escalating the war in Ukraine in February 2022, Russian revenues from seaborne crude oil exports to India were essentially nonexistent but have since risen to over $100 million per day. Similarly, seaborne oil product export revenues to Turkey have risen to roughly $45 million per day from about $10 million per day immediately before the invasion. China, which was already a major importer of Russian crude before 2022, has consistently imported roughly $55–$85 million per day over the last three years. Despite overall revenues falling—at least compared to before the war—Russian fossil fuel exports by tonnage have remained relatively consistent.
- The first linked piece was written by two of the authors of this essay.
- While our estimates are not meant to be an exhaustive list but rather a cross-section of the shadow fleet, we have compiled a substantial set of 343 shadow fleet ships. We believe that this sample is large enough to be representative.
- We derive these data from Bloomberg’s AHOY function, which provides daily oil tanker departures by exporting country.
- Russia is also building some new tankers, though these ships are vulnerable to preemptive sanctions.
- While Aframax and LR2 tankers are technically distinct, they are frequently grouped together. The capacity of Aframax tankers (around 80,000 to 120,000 DWT) overlaps substantially with that of LR2 tankers (around 80,000 to 160,000 DWT). Furthermore, tankers are often built to qualify for both classes and can switch between them with little effort.
- So named for being the largest vessel (the “max”) that can pass through the Suez Canal. Incongruously, the “AFRA” in Aframax refers to “Average Freight Rate Assessment.”
- Existing estimates of the cleanup costs of a shadow fleet spill are likely underestimates. For example, a piece from the Centre for Research on Energy and Clean Air (CREA) asserts that a shadow fleet spill might cost coastal states up to $1.6 billion to clean depending on where it occurred. However, it bases this number on the results of a 1999 study denominated in 1997 U.S. dollars, which it does not inflate to 2024. Furthermore, the CREA piece contextualizes the $1.6 billion number using the reported $2 billion price tag of the Exxon Valdez spill, which occurred in 1989. This value has also not been inflated to the present day. If $1.6 billion is inflated from 1997, it becomes roughly $3.2 billion.
The Brookings Institution is committed to quality, independence, and impact.
We are supported by a diverse array of funders. In line with our values and policies, each Brookings publication represents the sole views of its author(s).