As student loan debt has exceeded $1.2 trillion and many colleges continue to raise tuition prices faster than inflation, students, their families, and policymakers have further scrutinized how much money students pay to attend college. A key metric of affordability is the net price of attendance, defined as the total cost of attendance (tuition and fees, books and supplies, and a living allowance) less all grants and scholarships received by students with federal financial aid. The net price is a key accountability metric used in tools such as the federal government’s College Scorecard and the annual Washington Monthly college rankings that I compile. In this post, I am focusing on newly released net price data from the U.S. Department of Education through the 2013-14 academic year.
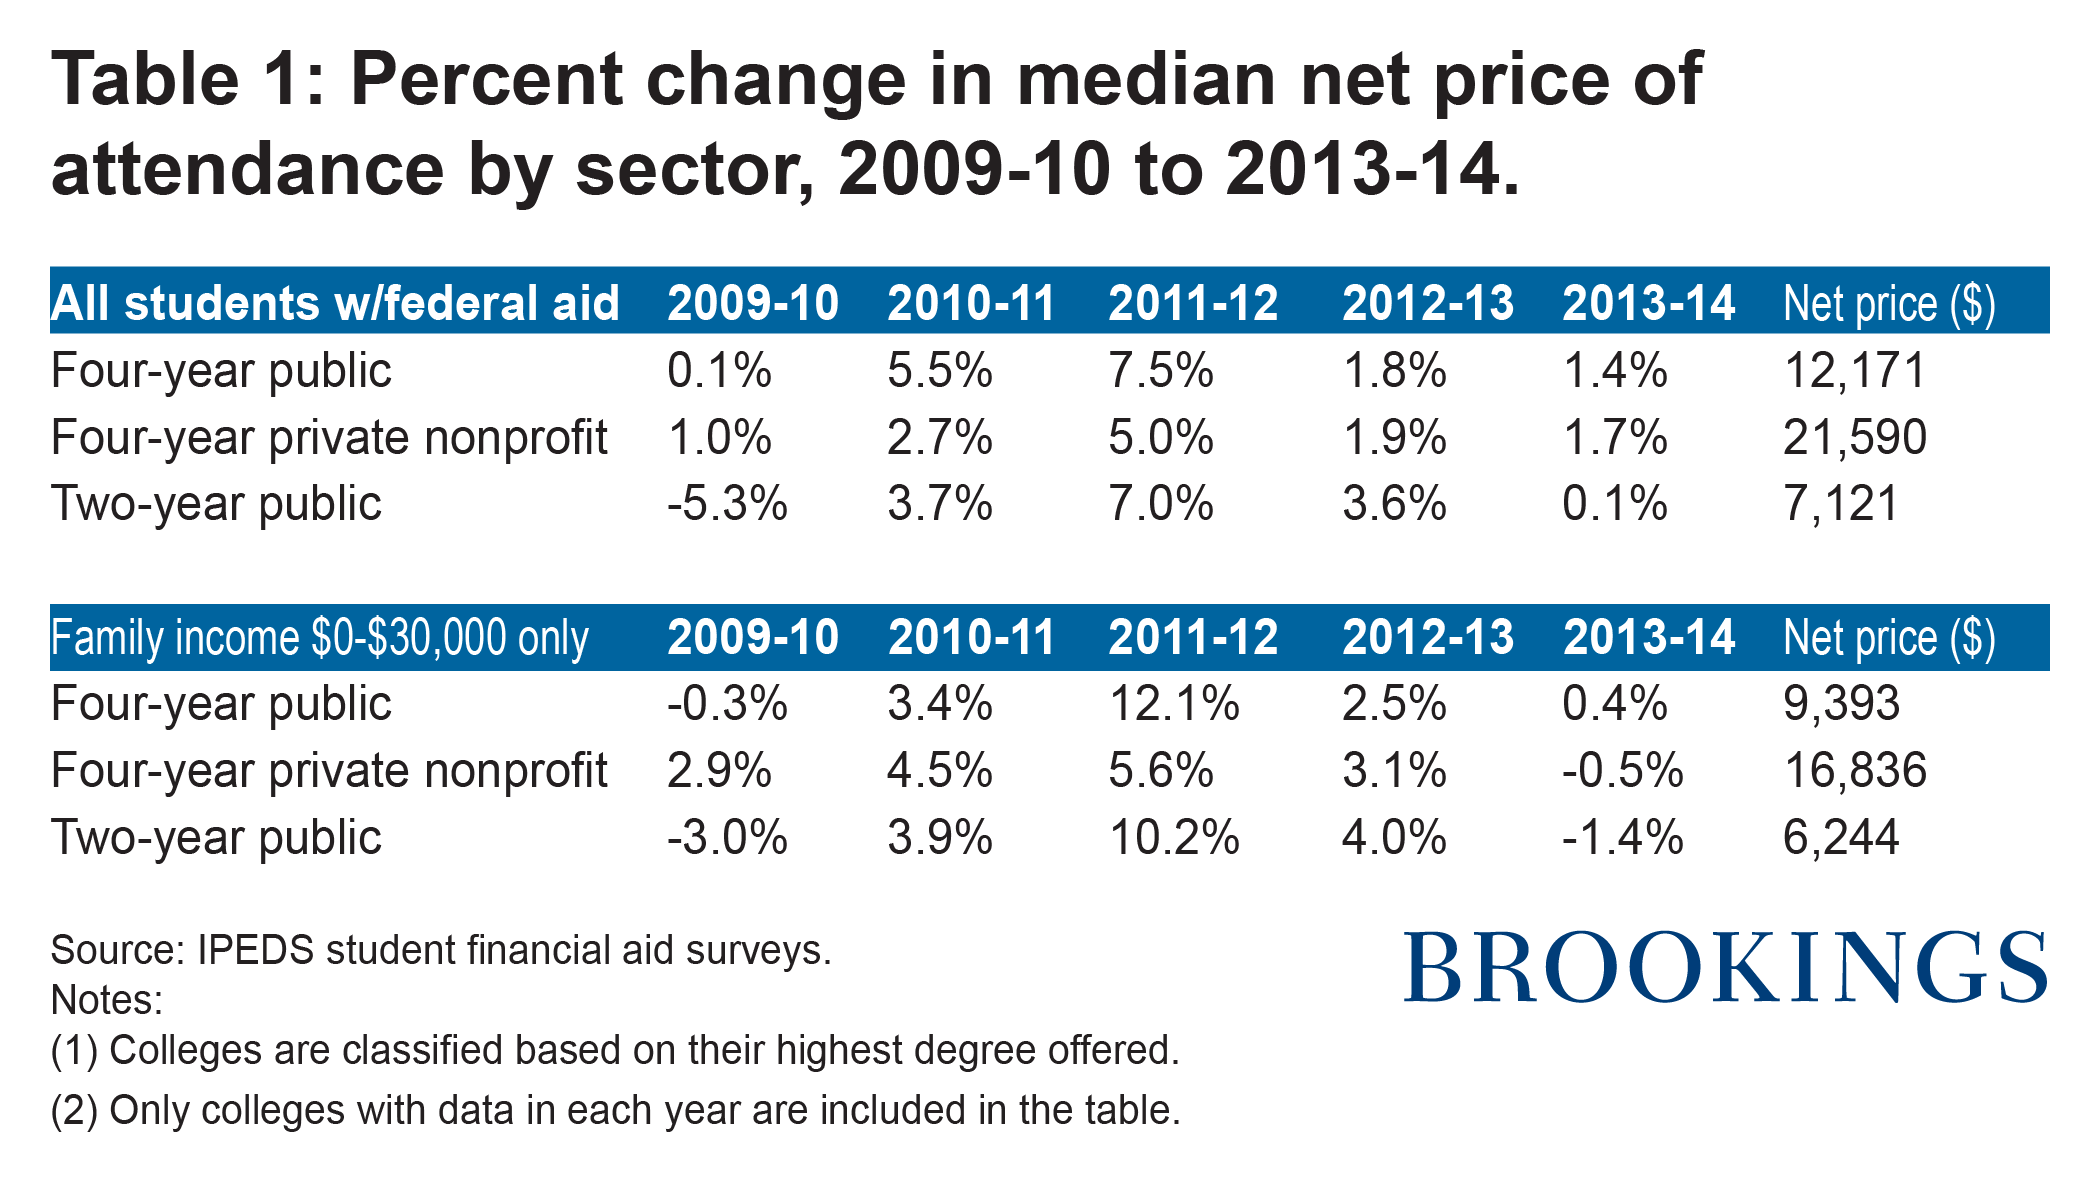
I first examined trends in net prices since the 2009-10 academic year for the 2,621 public two-year, public four-year, and private nonprofit four-year colleges that operate on the traditional academic year calendar. I do this for all students receiving federal financial aid (roughly 70% of all college students nationwide), as well as students with family incomes below $30,000 per year—roughly the lowest income quintile of students. Note that students from different backgrounds qualify for different levels of financial aid from both the federal government and the college they attend (and hence face different net prices). Table 1 shows the annual percentage changes in the median net price by sector over each of the five most recent years, as well as the median net price in 2013-14.

The net price trends in the most recent year of data (2012-13 to 2013-14) look pretty good for students and their families. The median net price for all students with financial aid increased by just 0.1% at two-year public colleges, 1.4% at four-year public colleges, and 1.7% at four-year private nonprofit colleges—roughly in line with inflation. The lowest-income students saw lower net prices in 2013-14 at two-year public colleges (-1.4%) and four-year private nonprofit colleges (-0.5%) and a small 0.4% increase at four-year public colleges.
Even with one year of good news, net prices are up about 15% at four-year colleges and 10% at two-year colleges since the beginning of the Great Recession in 2009, with a slightly larger percentage increase for lower-income students. Much of this increase in net prices, particularly for lowest-income students, occurred during the 2011-12 academic year.
Although some may blame the lingering effects of the recession or reduced state funding for the increase, in my view the likely culprit appears to be changes made to the federal Pell Grant program. In 2011-12, the income cutoff for an automatic zero EFC (Expected Family Contribution, and hence automatically qualifying for the maximum Pell Grant) was cut from $31,000 to $23,000. This resulted in a 25% decline in the number of automatic zero EFC students and contributed to the average Pell award falling by $278—the first decline in average Pell awards since 2005.
I next examined potential reasons for colleges’ changes in net prices. As colleges are facing incentives to lower their net price, they can do so in three main ways. Lowering tuition prices or increasing institutional grant aid would both benefit students, but they are difficult for cash-strapped colleges to achieve.
If colleges want to lower their net price without sacrificing tuition or housing revenue, the easiest way to do so is to reduce living allowances for off-campus students. Colleges have wide latitude in setting these living allowances, and research that I’ve conducted with Sara Goldrick-Rab at Wisconsin and Braden Hosch at Stony Brook shows a wide range in living allowances within the same county. Here, I looked at whether colleges’ patterns of changing tuition and fees or their off-campus living allowance seemed to be related to their change in net price.
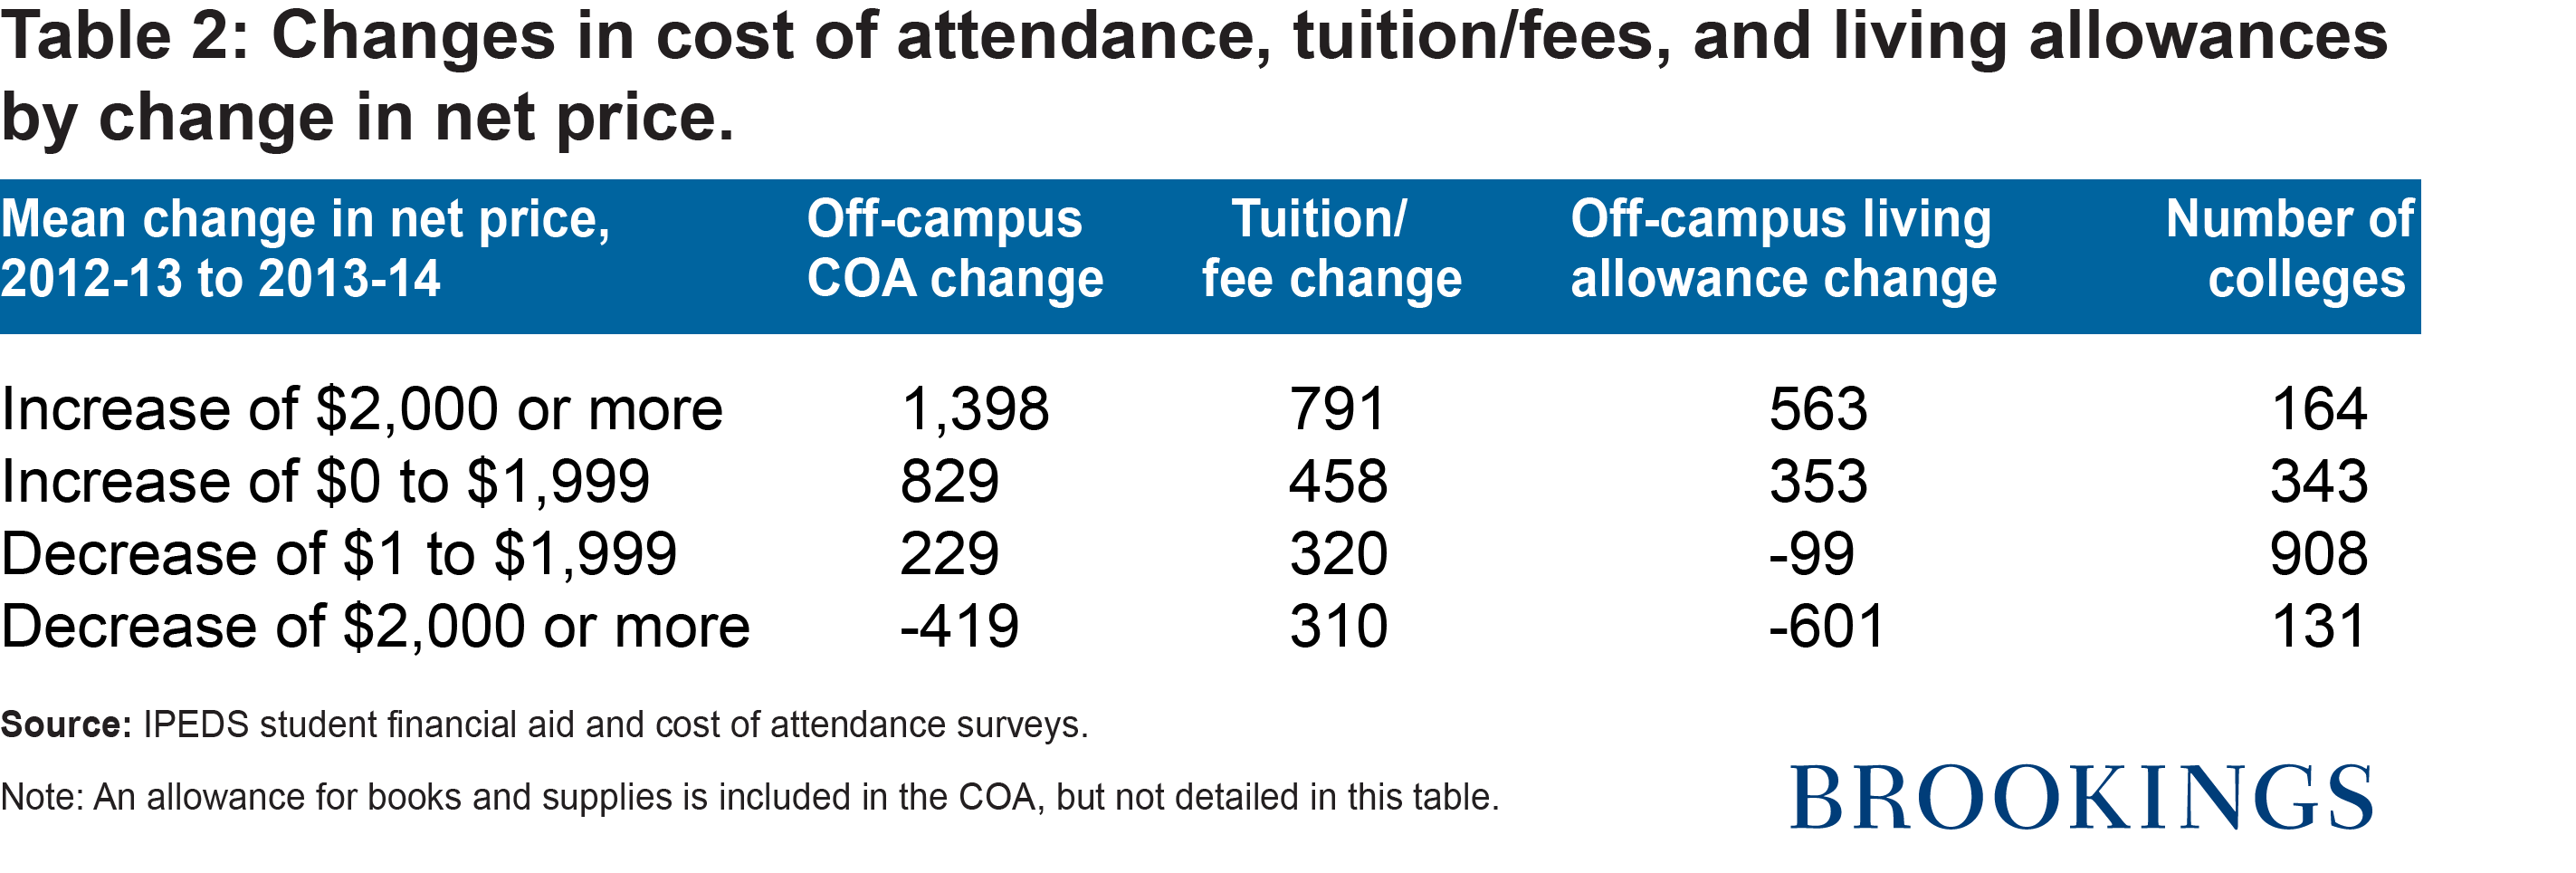
Table 2 shows the change between the 2012-13 and 2013-14 academic years in the total cost of attendance (COA), tuition and fees, and off-campus living allowances (for colleges with off-campus students), broken down by changes in the net price. Colleges with the largest increases in net price (greater than $2,000) increased their COA for off-campus students by $1,398, while colleges with smaller increases (between $0 and $1,999) increased their COA by $829. Both groups of colleges typically increased both tuition and fees and living allowances, which together resulted in the increase in COA.

However, colleges with a reported decrease in net price between 2012-13 and 2013-14 had a different pattern of changes. They still increased tuition and fees, but they reduced off-campus living allowances in order to keep the cost of attendance lower. For example, the 131 colleges with a decrease in net price of at least $2,000 had average tuition increases of $310 while living allowances were reduced by $610. Some of these reductions in allowances may be perfectly reasonable (for example, if rent prices around a college fall), but others may deserve additional scrutiny.
The net price data provide useful insights regarding trends in college affordability, but students and their families should not necessarily expect the posted net price to reflect how much money they will need to pay for tuition, fees, and other necessary living expenses during the academic year. These metrics tend to be more accurate for on-campus students (as a college controls room and board prices), but everyone should also look at colleges’ net price calculators for more individualized price estimates as the net price for off-campus students in particular may not reflect their actual expenses.
The Brookings Institution is committed to quality, independence, and impact.
We are supported by a diverse array of funders. In line with our values and policies, each Brookings publication represents the sole views of its author(s).


