Part II of the 2014 Brown Center Report on American Education

Homework! The topic, no, just the word itself, sparks controversy. It has for a long time. In 1900, Edward Bok, editor of the Ladies Home Journal, published an impassioned article, “A National Crime at the Feet of Parents,” accusing homework of destroying American youth. Drawing on the theories of his fellow educational progressive, psychologist G. Stanley Hall (who has since been largely discredited), Bok argued that study at home interfered with children’s natural inclination towards play and free movement, threatened children’s physical and mental health, and usurped the right of parents to decide activities in the home.
The Journal was an influential magazine, especially with parents. An anti-homework campaign burst forth that grew into a national crusade.[i] School districts across the land passed restrictions on homework, culminating in a 1901 statewide prohibition of homework in California for any student under the age of 15. The crusade would remain powerful through 1913, before a world war and other concerns bumped it from the spotlight. Nevertheless, anti-homework sentiment would remain a touchstone of progressive education throughout the twentieth century. As a political force, it would lie dormant for years before bubbling up to mobilize proponents of free play and “the whole child.” Advocates would, if educators did not comply, seek to impose homework restrictions through policy making.
Our own century dawned during a surge of anti-homework sentiment. From 1998 to 2003, Newsweek, TIME, and People, all major national publications at the time, ran cover stories on the evils of homework. TIME’s 1999 story had the most provocative title, “The Homework Ate My Family: Kids Are Dazed, Parents Are Stressed, Why Piling On Is Hurting Students.” People’s 2003 article offered a call to arms: “Overbooked: Four Hours of Homework for a Third Grader? Exhausted Kids (and Parents) Fight Back.” Feature stories about students laboring under an onerous homework burden ran in newspapers from coast to coast. Photos of angst ridden children became a journalistic staple.
The 2003 Brown Center Report on American Education included a study investigating the homework controversy. Examining the most reliable empirical evidence at the time, the study concluded that the dramatic claims about homework were unfounded. An overwhelming majority of students, at least two-thirds, depending on age, had an hour or less of homework each night. Surprisingly, even the homework burden of college-bound high school seniors was discovered to be rather light, less than an hour per night or six hours per week. Public opinion polls also contradicted the prevailing story. Parents were not up in arms about homework. Most said their children’s homework load was about right. Parents wanting more homework out-numbered those who wanted less.
Now homework is in the news again. Several popular anti-homework books fill store shelves (whether virtual or brick and mortar).[ii] The documentary Race to Nowhere depicts homework as one aspect of an overwrought, pressure-cooker school system that constantly pushes students to perform and destroys their love of learning. The film’s website claims over 6,000 screenings in more than 30 countries. In 2011, the New York Times ran a front page article about the homework restrictions adopted by schools in Galloway, NJ, describing “a wave of districts across the nation trying to remake homework amid concerns that high stakes testing and competition for college have fueled a nightly grind that is stressing out children and depriving them of play and rest, yet doing little to raise achievement, especially in elementary grades.” In the article, Vicki Abeles, the director of Race to Nowhere, invokes the indictment of homework lodged a century ago, declaring, “The presence of homework is negatively affecting the health of our young people and the quality of family time.”[iii]
A petition for the National PTA to adopt “healthy homework guidelines” on change.org currently has 19,000 signatures. In September 2013, Atlantic featured an article, “My Daughter’s Homework is Killing Me,” by a Manhattan writer who joined his middle school daughter in doing her homework for a week. Most nights the homework took more than three hours to complete.
The Current Study
A decade has passed since the last Brown Center Report study of homework, and it’s time for an update. How much homework do American students have today? Has the homework burden increased, gone down, or remained about the same? What do parents think about the homework load?
A word on why such a study is important. It’s not because the popular press is creating a fiction. The press accounts are built on the testimony of real students and real parents, people who are very unhappy with the amount of homework coming home from school. These unhappy people are real—but they also may be atypical. Their experiences, as dramatic as they are, may not represent the common experience of American households with school-age children. In the analysis below, data are analyzed from surveys that are methodologically designed to produce reliable information about the experiences of all Americans. Some of the surveys have existed long enough to illustrate meaningful trends. The question is whether strong empirical evidence confirms the anecdotes about overworked kids and outraged parents.
NAEP Data
Data from the National Assessment of Educational Progress (NAEP) provide a good look at trends in homework for nearly the past three decades. Table 2-1 displays NAEP data from 1984-2012. The data are from the long-term trend NAEP assessment’s student questionnaire, a survey of homework practices featuring both consistently-worded questions and stable response categories. The question asks: “How much time did you spend on homework yesterday?” Responses are shown for NAEP’s three age groups: 9, 13, and 17.[iv]
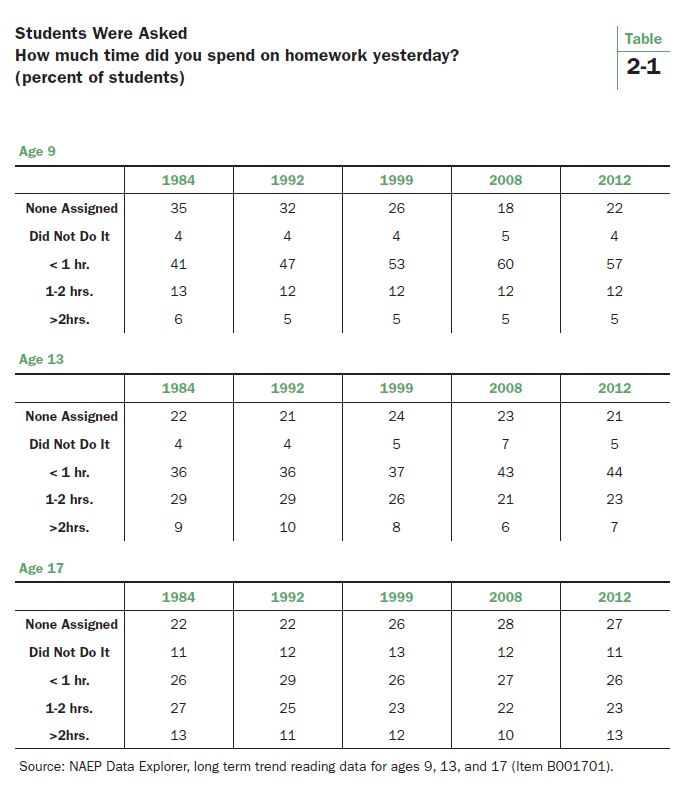
Today’s youngest students seem to have more homework than in the past. The first three rows of data for age 9 reveal a shift away from students having no homework, declining from 35% in 1984 to 22% in 2012. A slight uptick occurred from the low of 18% in 2008, however, so the trend may be abating. The decline of the “no homework” group is matched by growth in the percentage of students with less than an hour’s worth, from 41% in 1984 to 57% in 2012. The share of students with one to two hours of homework changed very little over the entire 28 years, comprising 12% of students in 2012. The group with the heaviest load, more than two hours of homework, registered at 5% in 2012. It was 6% in 1984.
The amount of homework for 13-year-olds appears to have lightened slightly. Students with one to two hours of homework declined from 29% to 23%. The next category down (in terms of homework load), students with less than an hour, increased from 36% to 44%. One can see, by combining the bottom two rows, that students with an hour or more of homework declined steadily from 1984 to 2008 (falling from 38% to 27%) and then ticked up to 30% in 2012. The proportion of students with the heaviest load, more than two hours, slipped from 9% in 1984 to 7% in 2012 and ranged between 7-10% for the entire period.
For 17-year-olds, the homework burden has not varied much. The percentage of students with no homework has increased from 22% to 27%. Most of that gain occurred in the 1990s. Also note that the percentage of 17-year-olds who had homework but did not do it was 11% in 2012, the highest for the three NAEP age groups. Adding that number in with the students who didn’t have homework in the first place means that more than one-third of seventeen year olds (38%) did no homework on the night in question in 2012. That compares with 33% in 1984. The segment of the 17-year-old population with more than two hours of homework, from which legitimate complaints of being overworked might arise, has been stuck in the 10%-13% range.
The NAEP data point to four main conclusions:
- With one exception, the homework load has remained remarkably stable since 1984.
- The exception is nine-year-olds. They have experienced an increase in homework, primarily because many students who once did not have any now have some. The percentage of nine-year-olds with no homework fell by 13 percentage points, and the percentage with less than an hour grew by 16 percentage points.
- Of the three age groups, 17-year-olds have the most bifurcated distribution of the homework burden. They have the largest percentage of kids with no homework (especially when the homework shirkers are added in) and the largest percentage with more than two hours.
- NAEP data do not support the idea that a large and growing number of students have an onerous amount of homework. For all three age groups, only a small percentage of students report more than two hours of homework. For 1984-2012, the size of the two hours or more groups ranged from 5-6% for age 9, 6-10% for age 13, and 10-13% for age 17.
Note that the item asks students how much time they spent on homework “yesterday.” That phrasing has the benefit of immediacy, asking for an estimate of precise, recent behavior rather than an estimate of general behavior for an extended, unspecified period. But misleading responses could be generated if teachers lighten the homework of NAEP participants on the night before the NAEP test is given. That’s possible.[v] Such skewing would not affect trends if it stayed about the same over time and in the same direction (teachers assigning less homework than usual on the day before NAEP). Put another way, it would affect estimates of the amount of homework at any single point in time but not changes in the amount of homework between two points in time.
A check for possible skewing is to compare the responses above with those to another homework question on the NAEP questionnaire from 1986-2004 but no longer in use.[vi] It asked students, “How much time do you usually spend on homework each day?” Most of the response categories have different boundaries from the “last night” question, making the data incomparable. But the categories asking about no homework are comparable. Responses indicating no homework on the “usual” question in 2004 were: 2% for age 9-year-olds, 5% for 13 year olds, and 12% for 17-year-olds. These figures are much less than the ones reported in Table 2-1 above. The “yesterday” data appear to overstate the proportion of students typically receiving no homework.
The story is different for the “heavy homework load” response categories. The “usual” question reported similar percentages as the “yesterday” question. The categories representing the most amount of homework were “more than one hour” for age 9 and “more than two hours” for ages 13 and 17. In 2004, 12% of 9-year-olds said they had more than one hour of daily homework, while 8% of 13-year-olds and 12% of 17-year-olds said they had more than two hours. For all three age groups, those figures declined from1986 to 2004. The decline for age 17 was quite large, falling from 17% in 1986 to 12% in 2004.
The bottom line: regardless of how the question is posed, NAEP data do not support the view that the homework burden is growing, nor do they support the belief that the proportion of students with a lot of homework has increased in recent years. The proportion of students with no homework is probably under-reported on the long-term trend NAEP. But the upper bound of students with more than two hours of daily homework appears to be about 15%–and that is for students in their final years of high school.
College Freshmen Look Back
There is another good source of information on high school students’ homework over several decades. The Higher Education Research Institute at UCLA conducts an annual survey of college freshmen that began in 1966. In 1986, the survey started asking a series of questions regarding how students spent time in the final year of high school. Figure 2-1 shows the 2012 percentages for the dominant activities. More than half of college freshmen say they spent at least six hours per week socializing with friends (66.2%) and exercising/sports (53.0%). About 40% devoted that much weekly time to paid employment.
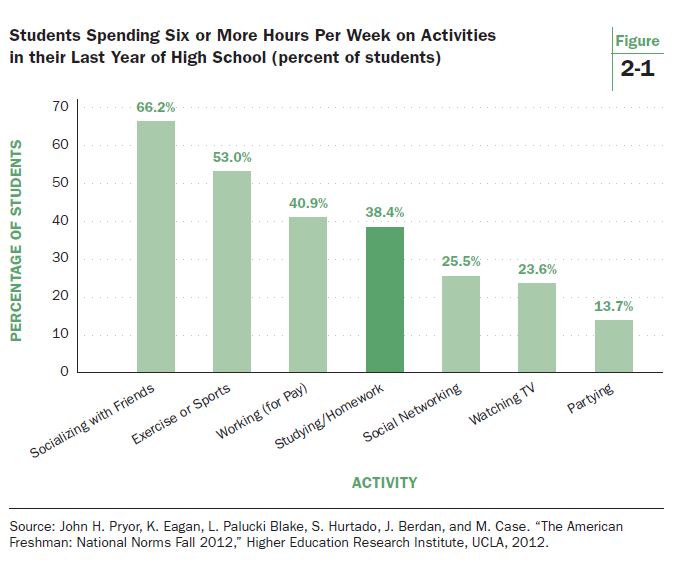
Homework comes in fourth pace. Only 38.4% of students said they spent at least six hours per week studying or doing homework. When these students were high school seniors, it was not an activity central to their out of school lives. That is quite surprising. Think about it. The survey is confined to the nation’s best students, those attending college. Gone are high school dropouts. Also not included are students who go into the military or attain full time employment immediately after high school. And yet only a little more than one-third of the sampled students, devoted more than six hours per week to homework and studying when they were on the verge of attending college.
Another notable finding from the UCLA survey is how the statistic is trending (see Figure 2-2). In 1986, 49.5% reported spending six or more hours per week studying and doing homework. By 2002, the proportion had dropped to 33.4%. In 2012, as noted in Figure 2-1, the statistic had bounced off the historical lows to reach 38.4%. It is slowly rising but still sits sharply below where it was in 1987.
What Do Parents Think?
Met Life has published an annual survey of teachers since 1984. In 1987 and 2007, the survey included questions focusing on homework and expanded to sample both parents and students on the topic. Data are broken out for secondary and elementary parents and for students in grades 3-6 and grades 7-12 (the latter not being an exact match with secondary parents because of K-8 schools).
Table 2-2 shows estimates of homework from the 2007 survey. Respondents were asked to estimate the amount of homework on a typical school day (Monday-Friday). The median estimate of each group of respondents is shaded. As displayed in the first column, the median estimate for parents of an elementary student is that their child devotes about 30 minutes to homework on the typical weekday. Slightly more than half (52%) estimate 30 minutes or less; 48% estimate 45 minutes or more. Students in grades 3-6 (third column) give a median estimate that is a bit higher than their parents’ (45 minutes), with almost two-thirds (63%) saying 45 minutes or less is the typical weekday homework load.
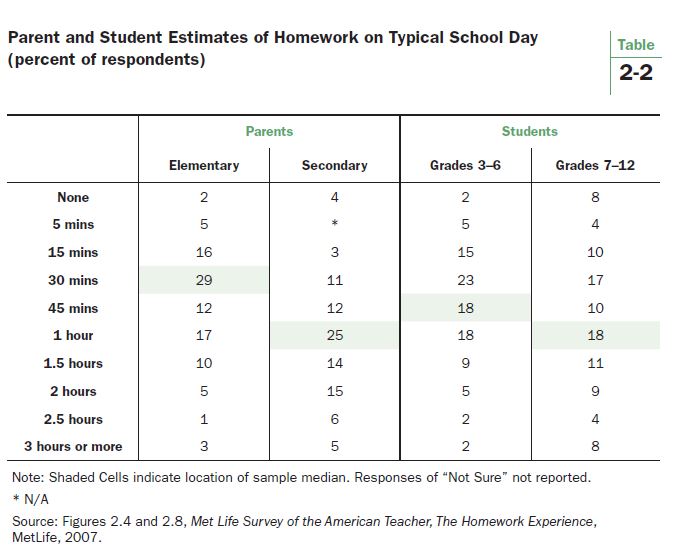
One hour of homework is the median estimate for both secondary parents and students in grade 7-12, with 55% of parents reporting an hour or less and about two-thirds (67%) of students reporting the same. As for the prevalence of the heaviest homework loads, 11% of secondary parents say their children spend more than two hours on weekday homework, and 12% is the corresponding figure for students in grades 7-12.
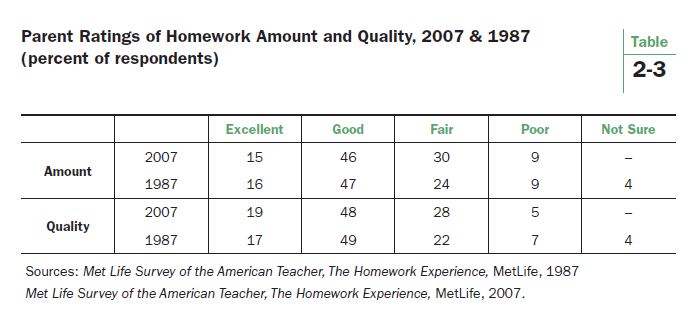
The Met Life surveys in 1987 and 2007 asked parents to evaluate the amount and quality of homework. Table 2-3 displays the results. There was little change over the two decades separating the two surveys. More than 60% of parents rate the amount of homework as good or excellent, and about two-thirds give such high ratings to the quality of the homework their children are receiving. The proportion giving poor ratings to either the quantity or quality of homework did not exceed 10% on either survey.
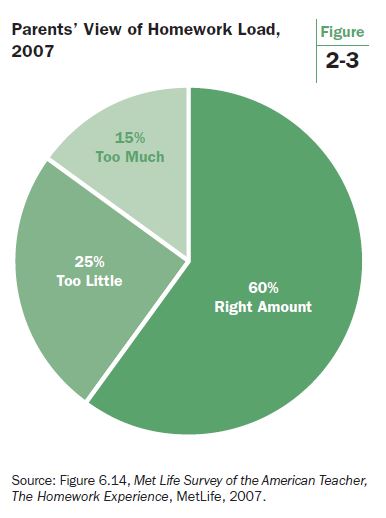
Parental dissatisfaction with homework comes in two forms: those who feel schools give too much homework and those who feel schools do not give enough. The current wave of journalism about unhappy parents is dominated by those who feel schools give too much homework. How big is this group? Not very big (see Figure 2-3). On the Met Life survey, 60% of parents felt schools were giving the right amount of homework, 25% wanted more homework, and only 15% wanted less.
National surveys on homework are infrequent, but the 2006-2007 period had more than one. A poll conducted by Public Agenda in 2006 reported similar numbers as the Met Life survey: 68% of parents describing the homework load as “about right,” 20% saying there is “too little homework,” and 11% saying there is “too much homework.” A 2006 AP-AOL poll found the highest percentage of parents reporting too much homework, 19%. But even in that poll, they were outnumbered by parents believing there is too little homework (23%), and a clear majority (57%) described the load as “about right.” A 2010 local survey of Chicago parents conducted by the Chicago Tribune reported figures similar to those reported above: approximately two-thirds of parents saying their children’s homework load is “about right,” 21% saying it’s not enough, and 12% responding that the homework load is too much.
Summary and Discussion
In recent years, the press has been filled with reports of kids over-burdened with homework and parents rebelling against their children’s oppressive workload. The data assembled above call into question whether that portrait is accurate for the typical American family. Homework typically takes an hour per night. The homework burden of students rarely exceeds two hours a night. The upper limit of students with two or more hours per night is about 15% nationally—and that is for juniors or seniors in high school. For younger children, the upper boundary is about 10% who have such a heavy load. Polls show that parents who want less homework range from 10%-20%, and that they are outnumbered—in every national poll on the homework question—by parents who want more homework, not less. The majority of parents describe their children’s homework burden as about right.
So what’s going on? Where are the homework horror stories coming from?
The Met Life survey of parents is able to give a few hints, mainly because of several questions that extend beyond homework to other aspects of schooling. The belief that homework is burdensome is more likely held by parents with a larger set of complaints and concerns. They are alienated from their child’s school. About two in five parents (19%) don’t believe homework is important. Compared to other parents, these parents are more likely to say too much homework is assigned (39% vs. 9%), that what is assigned is just busywork (57% vs. 36%), and that homework gets in the way of their family spending time together (51% vs. 15%). They are less likely to rate the quality of homework as excellent (3% vs. 23%) or to rate the availability and responsiveness of teachers as excellent (18% vs. 38%).[vii]
They can also convince themselves that their numbers are larger than they really are. Karl Taro Greenfeld, the author of the Atlantic article mentioned above, seems to fit that description. “Every parent I know in New York City comments on how much homework their children have,” Mr. Greenfeld writes. As for those parents who do not share this view? “There is always a clique of parents who are happy with the amount of homework. In fact, they would prefer more. I tend not to get along with that type of parent.”[viii]
Mr. Greenfeld’s daughter attends a selective exam school in Manhattan, known for its rigorous expectations and, yes, heavy homework load. He had also complained about homework in his daughter’s previous school in Brentwood, CA. That school was a charter school. After Mr. Greenfeld emailed several parents expressing his complaints about homework in that school, the school’s vice-principal accused Mr. Greenfeld of cyberbullying. The lesson here is that even schools of choice are not immune from complaints about homework.
The homework horror stories need to be read in a proper perspective. They seem to originate from the very personal discontents of a small group of parents. They do not reflect the experience of the average family with a school-age child. That does not diminish these stories’ power to command the attention of school officials or even the public at large. But it also suggests a limited role for policy making in settling such disputes. Policy is a blunt instrument. Educators, parents, and kids are in the best position to resolve complaints about homework on a case by case basis. Complaints about homework have existed for more than a century, and they show no signs of going away.
Part II Notes:
[i]Brian Gill and Steven Schlossman, “A Sin Against Childhood: Progressive Education and the Crusade to Abolish Homework, 1897-1941,” American Journal of Education, vol. 105, no. 1 (Nov., 1996), 27-66. Also see Brian P. Gill and Steven L. Schlossman, “Villain or Savior? The American Discourse on Homework, 1850-2003,” Theory into Practice, 43, 3 (Summer 2004), pp. 174-181.
[ii] Bennett, Sara, and Nancy Kalish. The Case Against Homework: How Homework Is Hurting Our Children and What We Can Do About It (New York: Crown, 2006). Buell, John. Closing the Book on Homework: Enhancing Public Education and Freeing Family Time. (Philadelphia: Temple University Press, 2004). Kohn, Alfie. The Homework Myth: Why Our Kids Get Too Much of a Bad Thing (Cambridge, MA: Da Capo Press, 2006). Kralovec, Etta, and John Buell. The End of Homework: How Homework Disrupts Families, Overburdens Children, and Limits Learning (Boston: Beacon Press, 2000).
[iii] Hu, Winnie, “New Recruit in Homework Revolt: The Principal,” New York Times, June 15, 2011, page a1.
[iv] Data for other years are available on the NAEP Data Explorer. For Table 1, the starting point of 1984 was chosen because it is the first year all three ages were asked the homework question. The two most recent dates (2012 and 2008) were chosen to show recent changes, and the two years in the 1990s to show developments during that decade.
[v] NAEP’s sampling design lessens the probability of skewing the homework figure. Students are randomly drawn from a school population, meaning that an entire class is not tested. Teachers would have to either single out NAEP students for special homework treatment or change their established homework routine for the whole class just to shelter NAEP participants from homework. Sampling designs that draw entact classrooms for testing (such as TIMSS) would be more vulnerable to this effect. Moreover, students in middle and high school usually have several different teachers during the day, meaning that prior knowledge of a particular student’s participation in NAEP would probably be limited to one or two teachers.
[vi] NAEP Question B003801 for 9 year olds and B003901 for 13- and 17-year olds.
[vii] Met Life, Met Life Survey of the American Teacher: The Homework Experience, November 13, 2007, pp. 21-22.
[viii] Greenfeld, Karl Taro, “My Daughter’s Homework Is Killing Me,” The Atlantic, September 18, 2013.
| « Part I: Lessons from the PISA-Shanghai Controversy | Part III: A Progress Report on the Common Core » |
The Brookings Institution is committed to quality, independence, and impact.
We are supported by a diverse array of funders. In line with our values and policies, each Brookings publication represents the sole views of its author(s).


