
The U.S. has seen a surge in federal infrastructure funding over the last few years, including more than $1 trillion from the Infrastructure Investment and Jobs Act (IIJA) and Inflation Reduction Act (IRA). The mix of formula funds, competitive grants, and tax credits has helped tens of thousands of transportation, water, energy, and broadband projects move forward.
However, the Trump administration’s Department of Government Efficiency (DOGE) has created anxiety around the federal direction going forward, especially within the transportation and water sectors, where governments are the primary asset owners. Freezes in federal infrastructure funding have stalled some projects, while program and staffing cuts at the Department of Transportation and Environmental Protection Agency have sown doubt over future projects and resourcing overall.
Yet even with such federal uncertainty, policymakers and practitioners must look beyond the here and now. Recently updated Congressional Budget Office (CBO) data clarify how public spending on transportation and water infrastructure has changed over the last five decades. The new data, running through 2023, reveal a continued need for greater overall infrastructure investment and the growing importance of state and local governments.
Specifically, the data highlight four trends that policymakers and practitioners should keep in mind as they consider the future of national, state, and local infrastructure needs.
Trend #1: Total public infrastructure spending is up, but as a share of gross domestic product, spending continues to trend down
Even before the IIJA and IRA, U.S. spending on public infrastructure rose slightly decade over decade. Federal, state, and local governments spent $625.8 billion on transportation and water infrastructure in 2023. Adjusted for inflation, this spending is up slightly from an annual average of $590 billion in the 2010s and $599.6 billion in the 2000s. And it’s significantly higher than earlier decades: an annual average of $512.4 billion from 1990 to 1999, and $397.9 billion from 1980 to 1989.
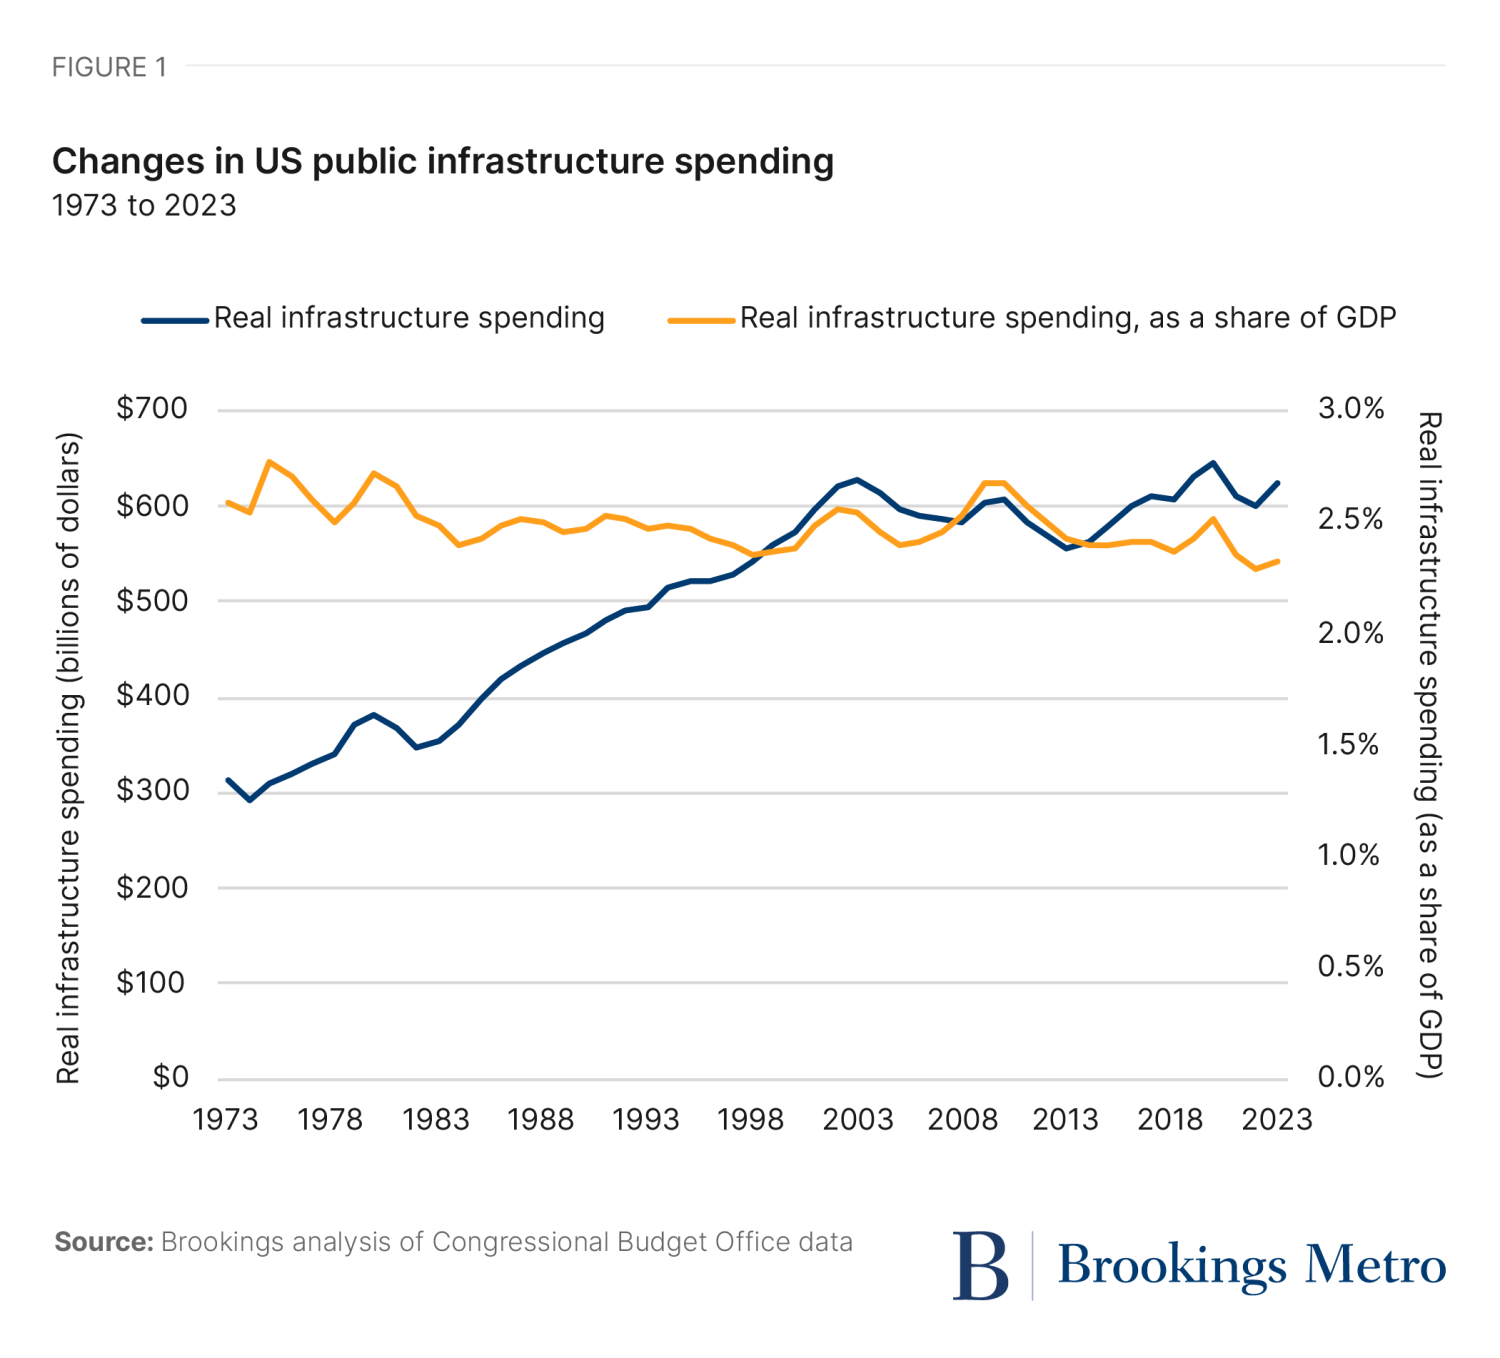
However, as a share of gross domestic product (GDP), infrastructure spending is down, hitting 2.32% in 2023. That is lower than the share in the 2010s (2.46% annual average) and 2000s (2.49% annual average), especially when the American Recovery and Reinvestment Act spiked the share to 2.68% in 2009. The U.S. has still not returned to the record of 2.77% from 1975, a year that saw the passage of several landmark environmental and spending bills. In other words, even as the U.S. economy has expanded, spending on infrastructure improvements has not kept pace with increases in total output.
Infrastructure spending as a share of GDP may have declined from the 1970s to the 2020s, but trends vary by sector. Governments actually increased their relative spending on mass transit and water utilities, equal to higher GDP shares of 0.13% and 0.07%, respectively, across the five-decade period. These percentages may seem small, but they reflect sizable investments in critical assets. By contrast, highways saw the most dramatic decline of any sector (-0.43%), accounting for nearly 90% of the total decline. This drop reflects the end of the interstate highway build-out, affirming how grand national projects can influence total spending levels.

Trend #2: As a share of total national infrastructure spending, state and local spending continues to dominate
The federal government continues to grab headlines around infrastructure spending, but the reality is that state and local governments drive most spending. Transportation departments and water utilities are the primary owners, operators, and investors in U.S. infrastructure, and they’re increasingly carrying a heavier financial burden. In 2023, states and localities accounted for 79% of all public infrastructure spending, or $494.2 billion out of $625.8 billion total. This is higher than the shares observed in the 2010s (77.4% annual average) and the 2000s (75.6% annual average).
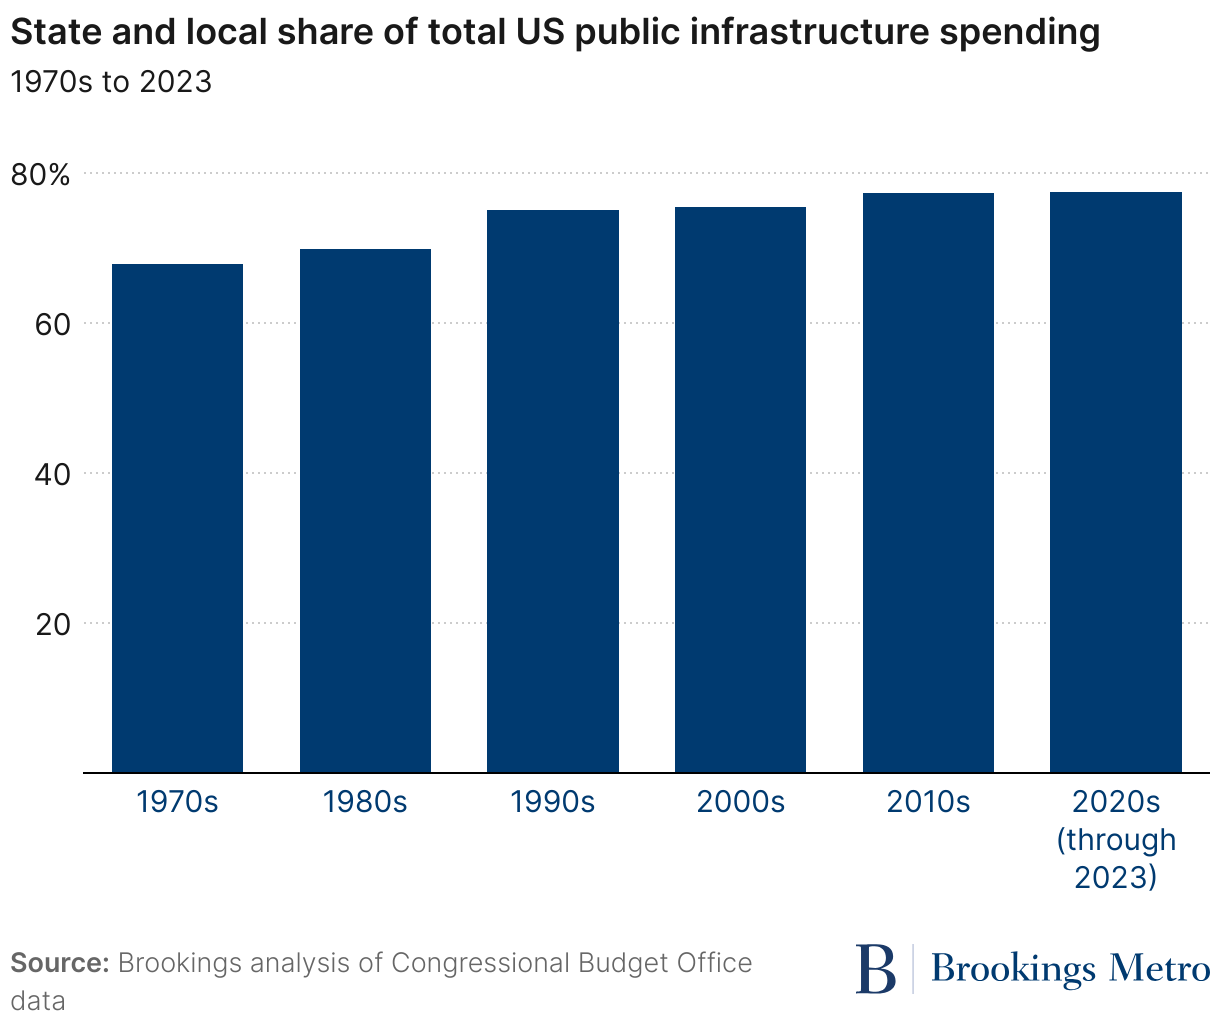
Notably, these shares have increased in every decade since the 1970s, when states and localities accounted for a little more than two-thirds of the country’s public infrastructure spending. Both the federal government and state and local governments have increased their spending in real terms since then, but the latter have significantly increased their spending. From 1970 to 1979, for instance, the federal government spent a combined $1 trillion on infrastructure, and state and local governments spent a combined $2.2 trillion. However, by the 2010s, federal spending had increased only to $1.3 trillion, while state and local spending more than doubled, to $4.6 trillion.
Trend #3: Jumps in operations and maintenance spending drive many of these increases, especially at the state and local level
A 2019 Brookings analysis highlighted how most U.S. infrastructure spending was concentrating in operating and maintaining existing roads, pipes, and other systems, rather than building a bunch of new projects. And even with the influx of IIJA and IRA support, that has not changed in recent years—or at least not yet.
In 2023, operations and maintenance spending accounted for 56.7% of all public infrastructure spending ($355 billion of $625.8 billion total), up from the 2010s (55.3% annual average) and 2000s (49.5% annual average). And it has surged from an annual average of 44.4% during the 1970s. Capital spending, meanwhile, continued a multi-decade decline, falling from a high of 55.6% averaged across the 1970s.

These shares are even more extreme at the state and local level, where operations and maintenance spending accounted for 62.1% of all infrastructure spending in 2023 ($307.1 billion of $494.2 billion). By comparison, the federal government tends to focus more on capital spending, which accounted for 63.6% of its total infrastructure spending in 2023 ($83.8 billion of $131.6 billion). Over time, these shares by level of government mirrored the broader national changes visualized above, signaling the growing importance of operation and maintenance spending—and the corresponding pressure it exerts on state and local governments that own the actual infrastructure.
Trend #4: State and local revenues are increasingly important to keep up with infrastructure spending, as compared to federal grants
In 2023, state and local revenues (via taxes, user fees, and other mechanisms) accounted for 71.6% of the source for local transportation and water projects (specifically, capital projects). Put another way: locally generated revenues are becoming increasingly important for locally led projects. This share is up from the 2010s (65.8% annual average) and 2000s (66% annual average), and much higher than the 1970s (59.5% annual average). Federal grants, correspondingly, have accounted for a lower share over time, dropping from a single-year-high of 53.9% in 1977 (amid a federal environmental push) to 28.4% in 2023.

This data is especially interesting considering that the IIJA was delivering federal funds in 2022 and 2023. Did the increase in federal grants actually crowd-in additional state and local investment? Applied researchers should continue to monitor spending trends to answer that question.
State and local infrastructure spending keeps growing in importance
Together, these four trends point to a U.S. infrastructure spending landscape increasingly dominated by state and local governments. These entities are also increasingly focused on operating and maintaining existing transportation and water infrastructure systems, and even when they are pursuing needed capital projects, they are more often relying on their own locally generated revenues to do so. The recent federal moment—defined by a surge in IIJA and IRA funding—is still ongoing and not fully reflected in the current CBO data. But the trendline is clear: The quality of American infrastructure depends on well-resourced state and local owners.
Authors


The Brookings Institution is committed to quality, independence, and impact.
We are supported by a diverse array of funders. In line with our values and policies, each Brookings publication represents the sole views of its author(s).