New Census Bureau population estimates for the second full year after the 2010 Census show something resembling “normal” population shifts after five years of recession-induced anomaly. During that period, we witnessed a downsized exodus from traditional out-migration areas, mostly in the North, and similarly suppressed in-flows to previously fast-growing Sun Belt areas. A host of factors, including lack of jobs and mortgage financing in the wake of the Great Recession, brought national migration rates down to post-war lows, essentially freezing people in place. Immigration levels were down as well.
But an analysis of the new numbers for the period of July 2011 to July 2012 implies that the migration log jam maybe coming to an end, especially for large metropolitan areas. As a group, such areas in the South and West showed a growth uptick, a year after registering their lowest growth rate in decades. They also received their biggest domestic in-migration since 2001. At the same time, large areas in the Northeast and Midwest saw their greatest migration losses since 2008, which is when their recession-related “migrant retention” started to emerge.
Each of the 20 fastest-growing metropolitan areas in 2011-2012 (among the top 100) were located in the South and West and most grew more rapidly than in the previous year—including Charleston, Orlando, Houston, Dallas, and San Antonio. Similarly, each of the 20 slowest growing or declining areas were located in the Northeast and Midwest, including Youngstown, Buffalo, Pittsburgh, and St. Louis, most of which grew more slowly in the past year. So after a five-year hiatus, Snow Belt/Sun Belt growth trajectories are, once again, heading in opposite directions.
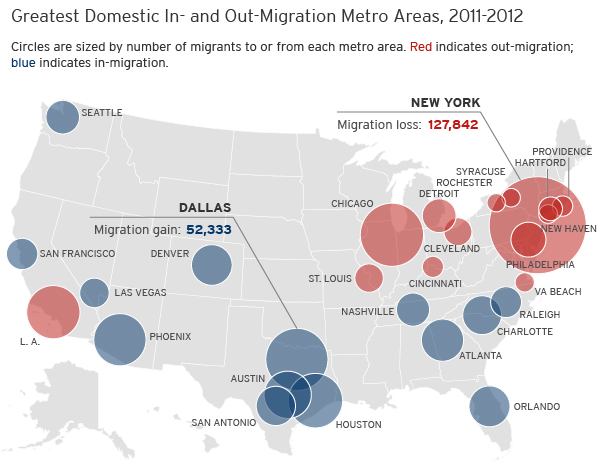
An examination of the domestic migration patterns provides further emphasis, with some surprises (See map below). Here, each of the 2011-2012 top gainers showed higher levels of migration than in 2010-2011. Not unexpectedly, Dallas and Houston rank first and second, with Austin and San Antonio not far behind. These Texas areas were migration draws, even during the recent down period, as they were not as severely affected by national housing and job market ills.

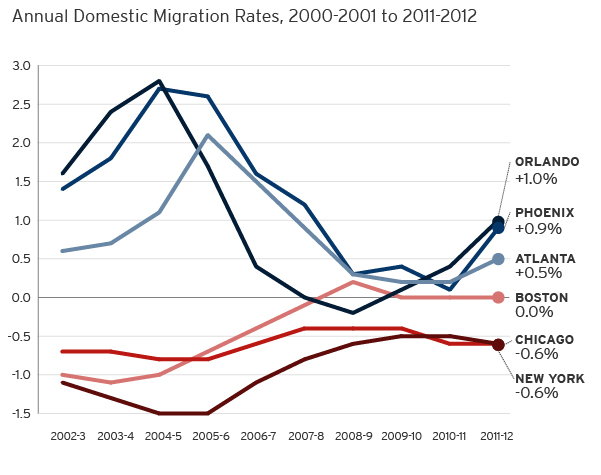
Yet the rise of Phoenix, as it were, to become the third-biggest migration gainer is of special note, given its plunge in the post-housing bubble years (See Figure 1 below). Similar turnarounds are evident in Las Vegas, which experienced net out-migration over the prior three years, and Atlanta, Orlando, Cape Coral, and Jacksonville, among others, each showing in-migration levels not seen since at least 2008.
At the other extreme, migration losses were especially noteworthy in Northeastern metropolitan areas, New York, Philadelphia, Hartford, Syracuse, as well as a slew of smaller metropolitan areas in New England and Upstate New York. In each case, the losses exceeded those of the previous year and seemed to put an end to their recession-era migrant retention. Chicago also experienced reduced out-migration or migration retention over the 2007-2010 period, but began show increased out-movement a year ahead of some others. Los Angeles has long been a Sun Belt outlier, feeding migrants to the rest of the West.

Immigration levels also took a hit over the past five years, in part, due to the same causes: a poor economy in general and a lack of jobs in construction and other immigrant employing industries. But those numbers are also starting to rise—approaching 1 million annually. This may prove timely for older areas starting to lose their hold on domestic migrants by providing an “immigrant cushion.” The new Census estimates show that each of the 100 largest metropolitan areas received more immigrants in 2011-2012 than in 2010-2011.
There is still one area that has not yet reached “normal” expectations, according to the new data: migration to the nation’s outer suburbs. According to a Brookings framework used in previous studies, outer exurban counties are experiencing a net out-migration for the second year in a row and another set of counties classed as “emerging suburbs” continue to grow tepidly, well below earlier years.
Nonetheless, the new Census population estimates make a compelling case that, for better or worse, traditional cross-regional migration patterns are returning. Of course, this turning point is a precarious one because it is dependent on the availability of jobs and a further improvement in the economy. Lets cross our fingers and hope it continues.
The Brookings Institution is committed to quality, independence, and impact.
We are supported by a diverse array of funders. In line with our values and policies, each Brookings publication represents the sole views of its author(s).


Commentary
Op-edEconomic Improvement Nudges U.S. Migration to Normal
March 15, 2013