When the COVID-19 pandemic hit the U.S., observers (including us) began to speculate on what impact the pandemic would have on domestic birth rates. Both recessions and public health crises have historically been associated with reductions in births. The COVID-19 pandemic, which had both elements, thus had the potential to lead to a sizable baby bust.1
National statistics on births by month are now available through June 2021. We use these data to estimate the number of “missing births” that are attributable to the COVID-19 pandemic.2 We calculate missing births as the shortfall between actual births and the number of births predicted based on pre-pandemic trends. Our calculations identify 60,000 missing births in the months of October 2020 through February 2021, which correspond roughly to conceptions that would have occurred in January 2020 through May 2020. Births returned to pre-pandemic trend levels in March 2021, indicating that conceptions returned to pre-pandemic trend levels in June 2020. Data are not yet available on births that would have been conceived during the 2020/21 winter wave of the COVID-19 pandemic, so we cannot make a final determination on the ultimate size of the COVID baby bust.
Detailed, monthly data on births that include information about mothers’ demographic characteristics and place of residence are currently available through December 2020. These data permit an investigation of more detailed features of the nature of the reduction in births associated with conceptions that would have occurred in March 2020, the month the pandemic was declared a national emergency in the U.S.
We make three main observations about the nature of the birth rate reduction coming from the early months of the pandemic, beyond its size:
- U.S. states with larger spikes in unemployment rates tended to have larger reductions in birth rates nine months later. However, the link between pandemic-induced unemployment rate increases and subsequent birth rate reductions is only half the size that would have been predicted based on the experience of the Great Recession.
- U.S. states that had higher cumulative cases of COVID per capita by the end of March 2020 tended to experience larger reductions in birth rates nine months later.
- Birth rate reductions were largest among highly educated women, women in their late 30s and early 40s, and those who already had at least one child. These are not the groups most affected by job or income losses, which suggests that pandemic-related factors beyond economic challenges were important drivers of the observed reduction in births.
The initial months of the pandemic led to 60,000 missing births
We calculate “missing births” as the shortfall between actual births and predicted births. The number of predicted births is based on pre-pandemic monthly birth data, reflecting conceptions that occurred (approximately) between January 2016 and December 2019 (births occurring between October 2016 and September 2020). The predicted number of births account for the pre-pandemic downward trend in births and regular seasonality in birth rates, as captured by monthly patterns. Figure 1 presents data on missing births, dated by month of likely conception. The solid bars indicate estimates that are statistically different from zero at the 5 percent level.
The data show a baby bust of 60,000 missing births between October 2020 and February 2021, roughly corresponding to conceptions that would have occurred between January and May 2020. That initial baby bust disappeared beginning with births that would have been conceived in June 2020 and running through September 2020, when the data indicate a positive birth gap. Future releases of data will reveal whether birth rates equaled or exceeded predicted levels, or whether the winter 2020-21 wave of COVID cases contributed to an extension of the baby bust.

The largest number of missing births are in January 2021, roughly corresponding to conceptions in April 2020. It stands to reason that the events of March 2020 would have led many people to decide to postpone or avert any plans to get pregnant around that time. President Trump declared a COVID-19 national emergency on March 13th and local shut down orders soon followed in various places around the country.
However, there are missing births as early as October 2020, roughly corresponding to conceptions that would have occurred in January 2020. The global pandemic was taking hold in January and February 2020, but it had not yet affected daily life in the U.S. The early onset of a reduction in births could reflect pregnancy avoidance on the part of people who were paying attention to emerging news of the pandemic. It could also reflect the imprecise nature of dating births to conceptions nine months prior. In addition, some of these missing births could be due to miscarriages and abortions occurring in or after March 2020, which would have been conceived in January or February, as opposed to reduced conceptions in those months.
The data show a return to pre-pandemic trend levels of births by March 2021, roughly corresponding to conceptions that would have occurred in June 2020. The number of births that would have been conceived in September 2020 overshot the predicted level, perhaps reflecting a return of optimism. The unemployment rate had fallen from a high of 14.5 percent in April 2020 to 7.8 percent by September. The number of daily cases and deaths attributed to COVID nationally had just fallen following a summer surge and preceded the massive winter spike to come.
The vast amounts of government assistance transferred to individuals and households in the summer of 2020 might help explain why conception rates returned to pre-pandemic trend levels. Congress passed fiscal relief of $2 trillion in March of 2020 in the CARES Act, immediately providing $1,200 stimulus checks and increasing unemployment insurance (UI) benefits by $600 per week through September 2020, among other provisions like expansions to the Child Tax Credit (CTC). The stimulus checks and higher UI benefits began in April; CTC payments did not begin until July. For lower-wage workers, in particular, the UI benefits increase provided them income greater than their lost earnings. In total, the economic assistance provided through CARES Act provisions allowed most households to maintain consumption levels, which likely would have muted some of the negative effects of the ongoing recession on people’s childbearing plans. In a similar way, poverty rates did not increase by as much as previous experience would have predicted.
Places with larger increases in unemployment experienced larger birth rate reductions
As we explained in detail in a previous essay, there is a well-documented link between aggregate economic conditions and birth rates. In short: when economic times are good, people have more babies; when times are tough, birth rates fall.
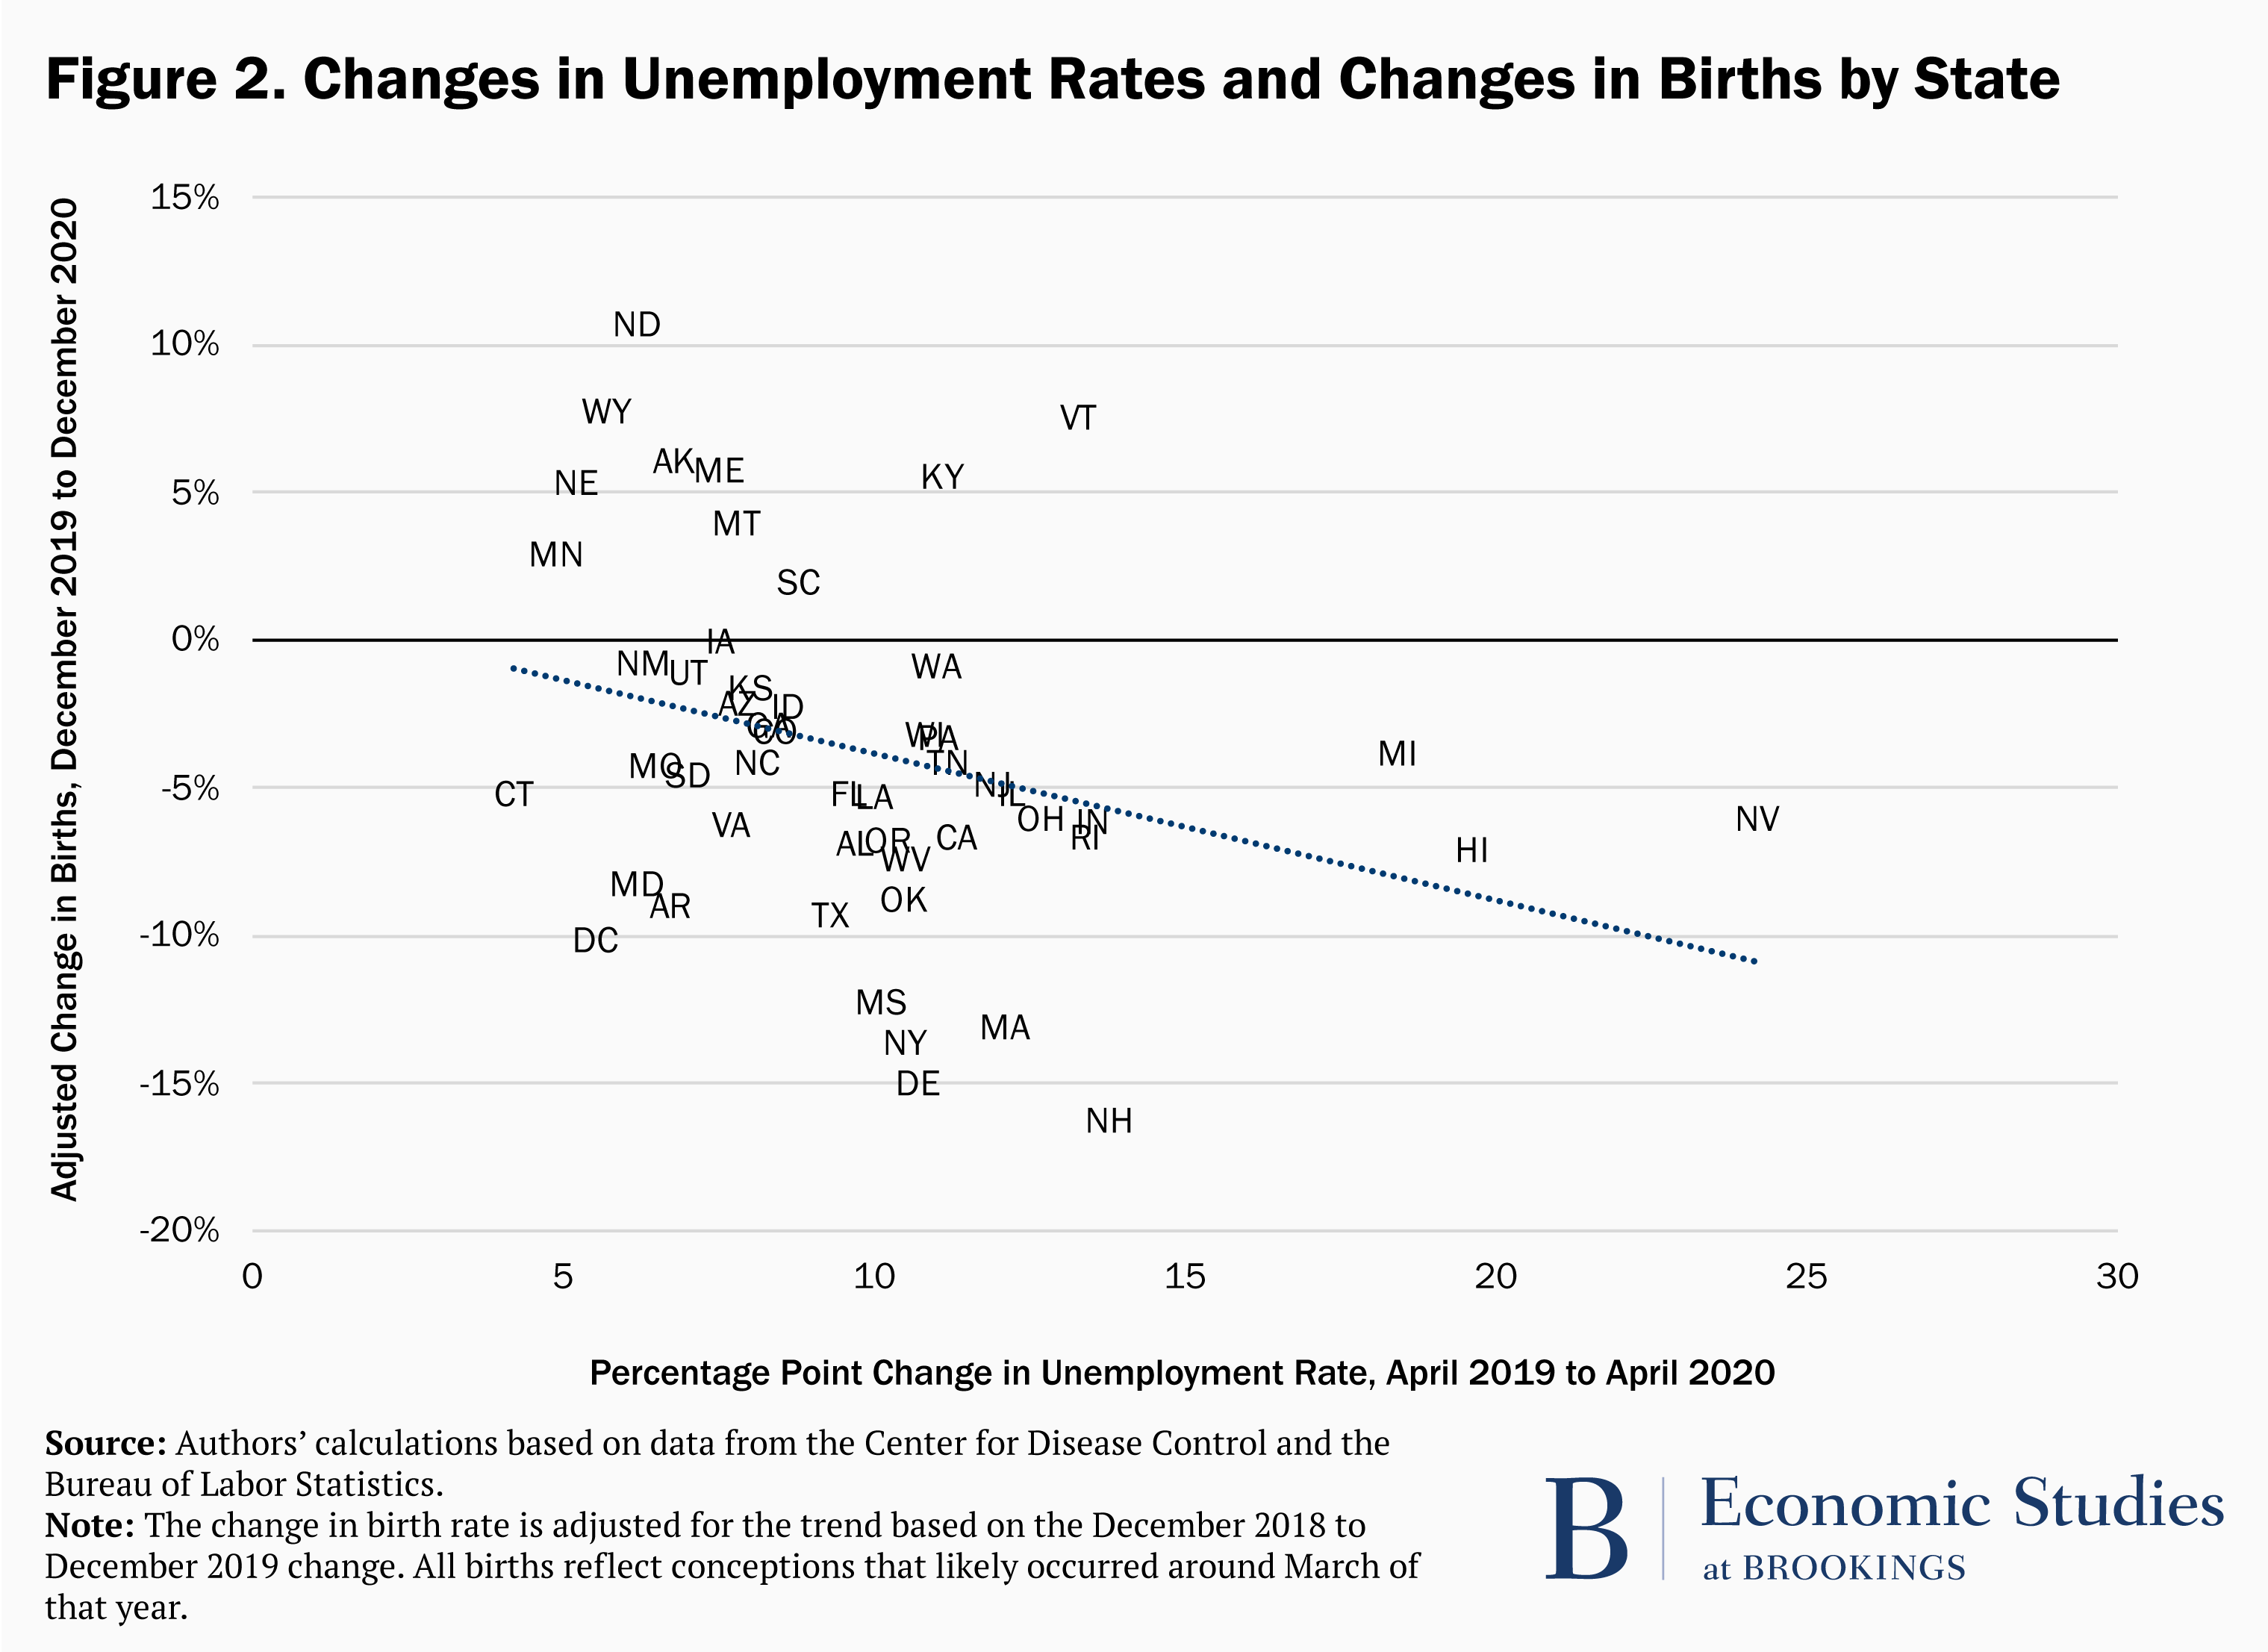
Here we quantify the link between increased unemployment and the subsequent change in birth rates during the initial phase of the U.S. COVID-19 pandemic. We do so by estimating changes in births between December 2019 and 2020 relative to changes in births between December 2018 and 2019 to abstract from ongoing trends (and incorporating nine months of gestation). We reference this statistic as the adjusted change in births. Then we compare this adjusted change in births to the change in the unemployment rate in the state between April 2019 and 2020.
The average increase in a state’s unemployment rate was a massive 9.8 point increase. Unemployment rates in Michigan, Hawaii, and Nevada jumped over 18 points. Births fell 3.7 percent, on average, across states. Births fell the most in New York, Delaware, New Hampshire, and Massachusetts. In fact, we estimate that births to residents of New York City, the epicenter of the initial wave of the pandemic, fell by a whopping 23.4 percent in December of 2020.3
Figure 2 reports the two-way relationship between changes in the unemployment rate between April 2019-2020 and adjusted changes in births in December 2019-2020. A one percentage point increase in the unemployment rate is associated with a 0.5 percentage point reduction in the birth rate. Strikingly, this is half the size of the relationship observed from the Great Recession. We speculate that the unprecedented government response, including the CARES Act, dampened the relationship between the unemployment rate and fertility behavior.
Places with larger increases in COVID-19 cases per capita experienced larger birth rate reductions
The COVID-19 pandemic likely affected birth rates through channels other than job and income effects. Worry and anxiety about health effects and the effects of the pandemic on life in general might have led couples to reconsider plans for conceiving a child at that time. The social restrictions and precautions that people took (or were forced to take) during the initial phase of the pandemic likely also affected relationships and pregnancies. To estimate the link between COVID-19 case rates and the subsequent number of births, we relate the adjusted state-level change in births between December 2019 and 2020 to cumulative state COVID-19 cases per 100,000 people in March 2020.
Figure 3 documents the negative relationship between the magnitude of the pandemic in the state and the birth rate. Every 10-point increase in the incidence rate is associated with a 0.35 percentage point reduction in the birth rate. Of course, people might have responded to the national rate of COVID, not just the incidence rate where they lived. The relationship captured in Figure 3 simply states that in places where more people contracted COVID, birth rates fell by more.

In a statistical horserace of COVID-19 incidence and the change in the unemployment rate – using a regression model that includes both measures – each factor has an independent impact on birth rates. As a statistical matter, the correlation between the increase in the April unemployment rate and the March COVID-19 case rate is low. For instance, unemployment skyrocketed in Nevada, Hawaii, and Michigan because tourism collapsed and auto plants shut down, not because there was a high local rate of COVID-19 cases.
Highly educated women, older women, and those who already had children were most likely to postpone or avert births
To assess who reduced their fertility in response to the pandemic, we construct adjusted changes in birth rates similar to that described earlier, but separately for women distinguished by education, age, and whether or not they already had a child. Figure 4 reports the drop in births in December 2020 relative to December 2019 for women by education level. Births occurring in December 2020 were likely conceived in March 2020, the month the COVID-19 pandemic was declared a national emergency.
Births fell the most for highly educated women – those with master’s degrees, doctorates, or professional degrees – when COVID began. This is perhaps surprising, given that these women were less likely than less-educated women to experience job losses.
Figure 5 tabulates the decline in births by five-year age categories. Birth rates fell the most for women age 35 and above. Again, this is perhaps surprising given that younger workers experienced larger losses in employment and correspondingly, earned income. This provides further suggestive evidence that factors other than a spike in job loss affected fertility during the pandemic-induced recession. The birth decline is larger for teens than for women in their 20s and early 30s. For teens, social restrictions and school and business shutdowns likely generated separation from peers that reduced opportunities for sexual encounters.
These differences in birth rate reductions across groups of women reveal whose behavior was most affected by pandemic circumstances. These differences do not reveal where the majority of missing births are coming from, since women in different education and age groups account for different shares of overall births. For instance, births fell much more for women 40 to 44 compared to women 30 to 34, but women in this younger age group accounted for three times as many of the missing births because they account for a larger share of total births.
Birth data also reveal that a larger fertility response occurred among women who already had a child. Figure 6 shows that there are larger drops in births for second and third or higher-order births, as compared to first births. The pandemic’s restrictions on social movements and the associated closures of school and daycare led to great disruptions in the lives of children and their parents. It is not surprising that parents who might otherwise have expanded their family decided to put off having another child during this time.4
Conclusion
The numbers we have reported above reveal that the COVID-19 baby bust to date is smaller than we predicted in our earlier forecasts. More time has to pass before we will know the total size of the COVID baby bust. Regardless of its ultimate magnitude, the COVID baby bust should be considered in the context of the sustained, substantial decline in U.S. birth rates since the Great Recession. The hundreds of thousands of fewer births occurring every year over this period, with no obvious reversal in sight, has far greater long-term implications for society than the COVID baby bust.
The Brookings Institution is financed through the support of a diverse array of foundations, corporations, governments, individuals, as well as an endowment. A list of donors can be found in our annual reports published online here. The findings, interpretations, and conclusions in this report are solely those of its author(s) and are not influenced by any donation.
-
Footnotes
- In a June 2020 Brookings report, we forecast as many as 500,000 fewer births in the following year on account of the emerging US pandemic. We subsequently (in December 2020) revised downward our forecast to around 300,000 fewer births in the year, given a more rapid economic recovery than previously expected Birth data released by the CDC in March 2021 confirmed tens of thousands of “missing births” that were not conceived during the initial months of the US pandemic.
- All of the birth data we use is obtained from CDC Wonder for births through December 2020 and provisional birth data reported by the CDC for 2021 births through June.
- This calculation is based on statistics available from the CDC.
- The age pattern in birth rate declines holds even when looking at first births only. This indicates that the larger relative responses among women in their 30s and 40s is not simply reflecting the larger relative reduction in higher parity births.
The Brookings Institution is committed to quality, independence, and impact.
We are supported by a diverse array of funders. In line with our values and policies, each Brookings publication represents the sole views of its author(s).


