There is currently a lot of focus on capital flight out of China. This post—the seventh in our new Global Economy and Markets blog—examines capital flight in 2015 and 2016, which came after a surprise devaluation of China’s yuan against the dollar in August 2015. That devaluation came after a decade during which the yuan either strengthened or was stable against the dollar and sparked fear among Chinese households that further depreciation was inevitable. What followed was large-scale capital flight, causing official foreign exchange reserves to fall around $1 trillion as China defended the yuan. There is once again lots of focus on capital flight out of China now, but—while outflows are certainly happening—they are nowhere near the panic in 2015 and 2016. That is not to say that capital flight could not resume. If onshore expectations of yuan depreciation build once again, that could reignite genuine capital flight. Additional large U.S. tariffs could be a catalyst for this, given that such tariffs led to meaningful yuan depreciation in 2017 and 2018.
Capital flight out of China in 2015 and 2016
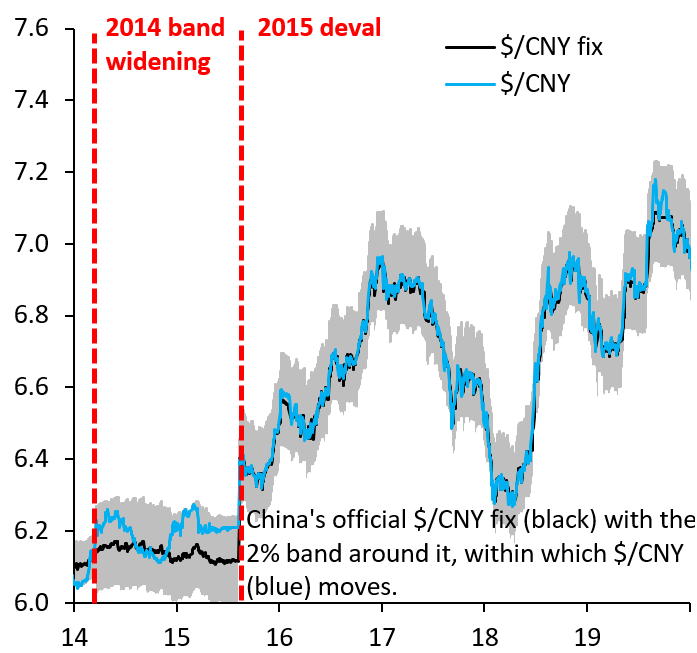
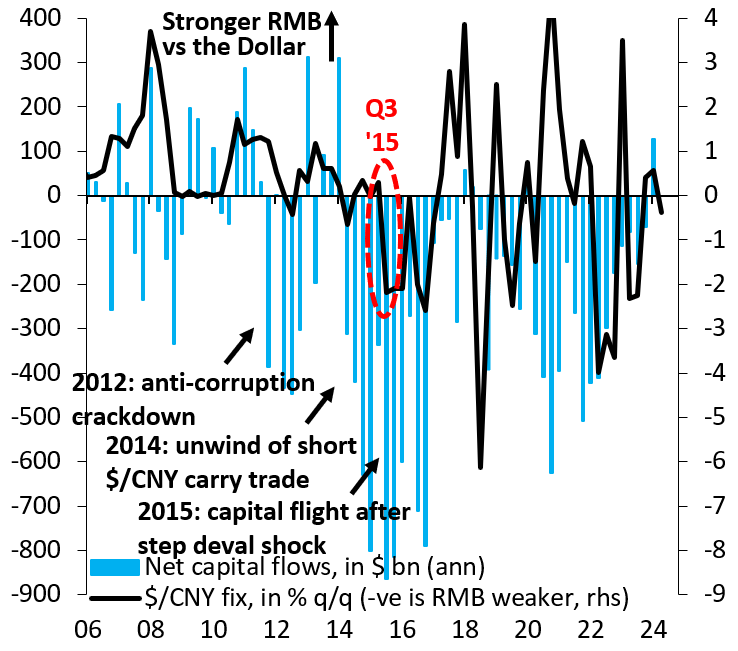
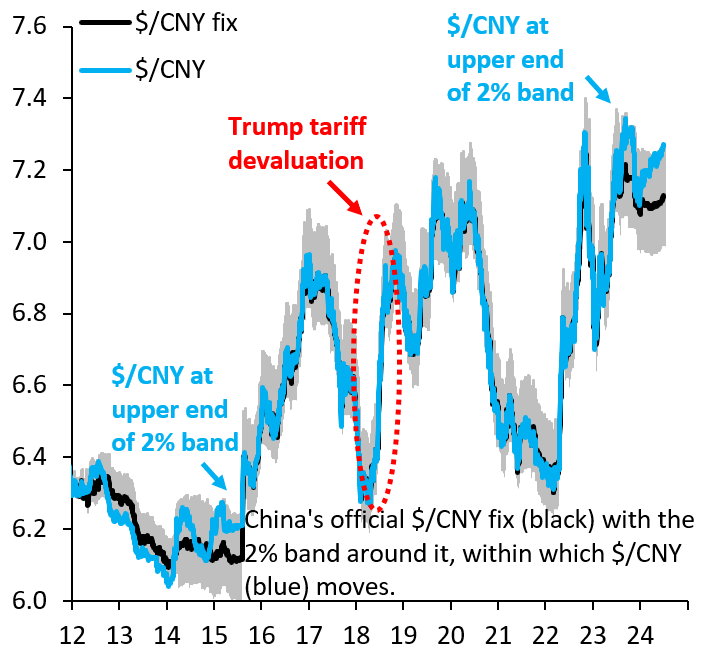
In the run-up to the devaluation in August 2015, China had been trying to make the yuan more flexible. It widened the band around the official dollar-yuan fix in early 2014, whereafter the yuan traded mostly near the top end of band, opening China up to the criticism that it had multiple exchange rates. On August 11, 2015, partly aiming to deflect that criticism, China devalued the yuan, which fell a total of 3% over several days (Figure 1). That kind of fall was unheard of at the time and sparked widespread panic among Chinese households, who tried to convert their savings into hard currency. Figure 2 shows net capital outflows from China (-), defined as net portfolio and net other investment flows plus errors and omissions, alongside the quarterly change in the yuan against the dollar. Capital flight was intense after this devaluation and is clearly nowhere near these levels today.
Figure 1. China’s official dollar-yuan fix
Figure 2. China’s net capital flows
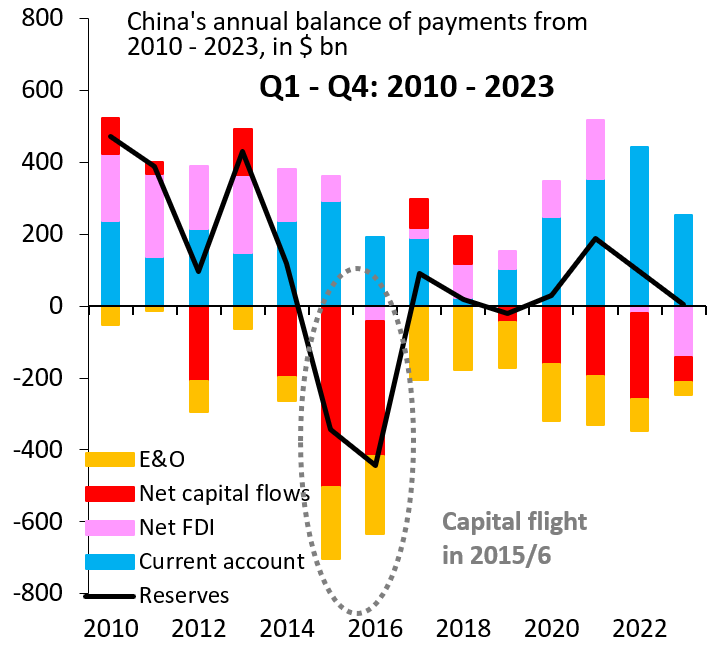
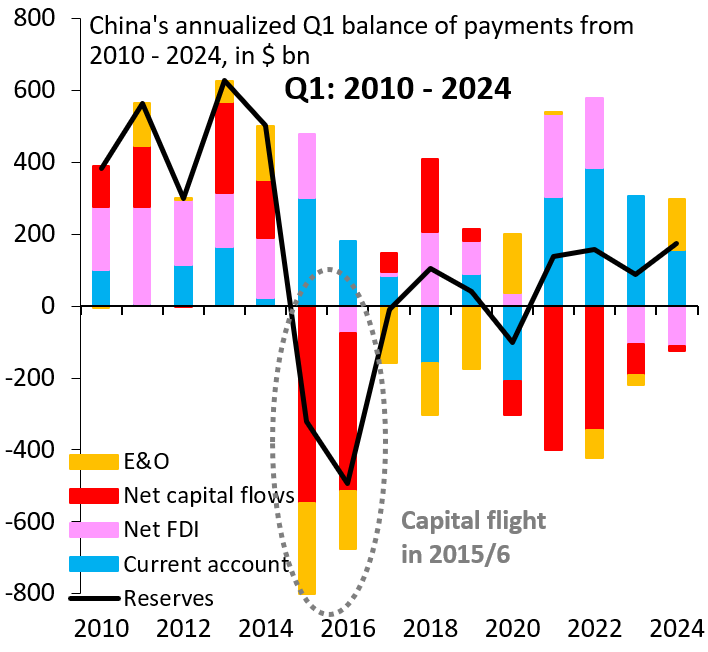
We now compare balance of payments dynamics during the 2015-16 episode with today. Figure 3 presents annual data for China’s balance of payments from 2010 to 2023. Changes in official foreign exchange (FX) reserves (black) are driven by the balance between the current account surplus (blue) versus capital outflows, where the latter are dominated by net foreign direct investment (pink), net portfolio and other investment flows (red), and errors and omissions (orange). As China just published data for the first quarter of 2024, Figure 4 is a companion chart that shows the same breakdown for Q1 in every year from 2010 to 2024. Two conclusions emerge: (i) There are certainly capital outflows now, but they are nothing near the panic of 2015 and 2016; (ii) Even if you believe that the current account is understated—something that might cause capital outflows to be understated as well—the magnitudes involved get you nowhere near 2015/16.
Figure 3. China’s annual balance of payments from 2010-2023, in billions of dollars
Figure 4. China’s annualized Q1 balance of payments from 2010-2024, in billions of dollars
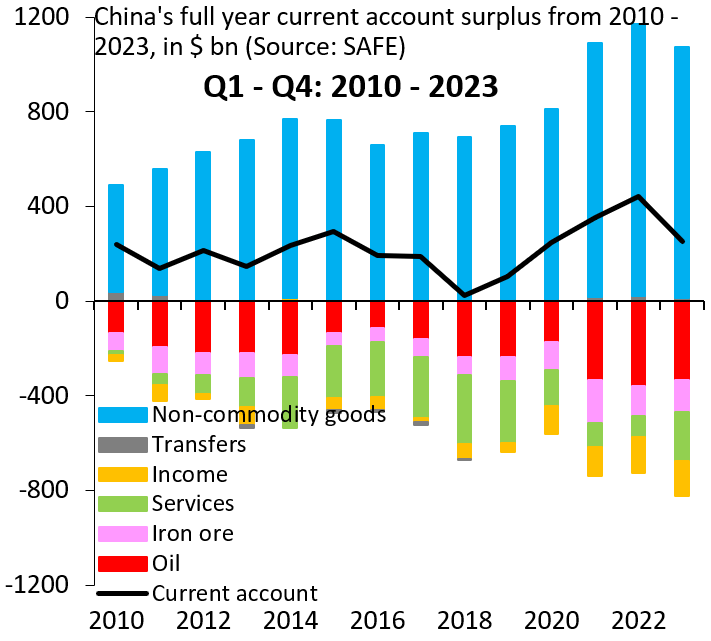
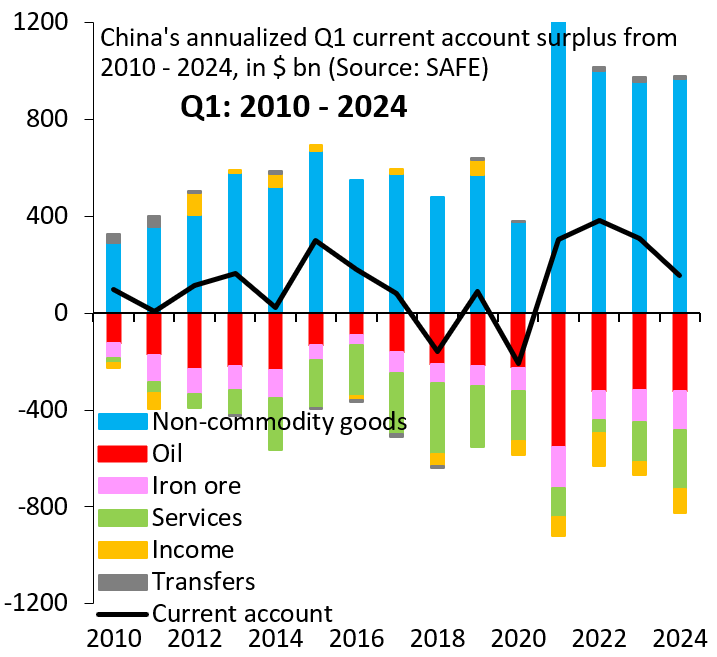
Given how much focus there is on potential understatement of China’s current account surplus, we now investigate this issue. Figure 5 presents annual data for the current account from 2010 to 2023, breaking down the headline number into a non-commodity trade surplus (blue), trade deficits for oil (red) and iron ore (pink), and services and income balances. Figure 6 shows the same breakdown for the first quarter in every year from 2010 to 2024. China’s current account surplus has been below the non-commodity trade surplus for many years, with this discrepancy most notable in the years since COVID-19. With this being a long-standing issue, this discrepancy is unlikely to explain an acceleration in capital outflows, even if the current account surplus is understated. In our view, the current account understatement argument is a red herring.
Figure 5. China’s full-year current account surplus from 2010-2023, in billions of dollars
Figure 6. China’s annualized Q1 current account surplus from 2010-2024, in billions of dollars
Capital flight is China’s Achilles’ heel
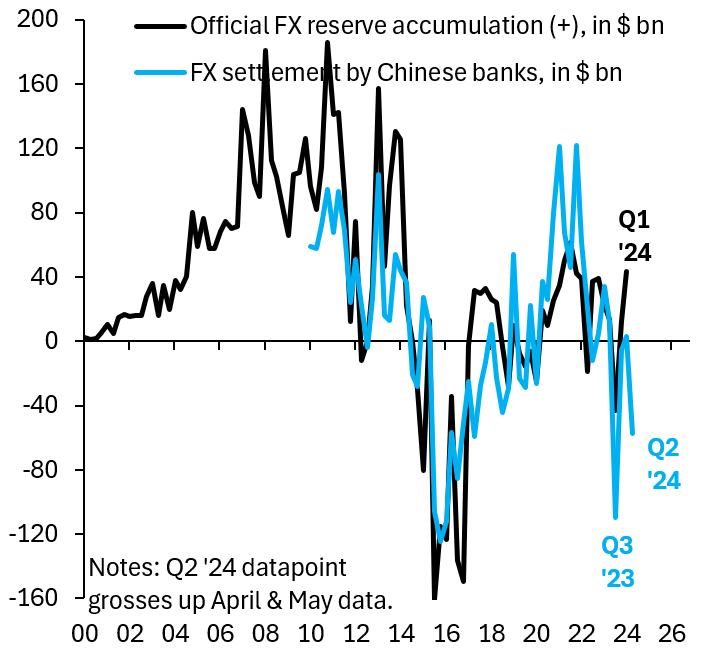
While China certainly has capital outflows currently, these come nowhere near “capital flight.” Indeed, a current account surplus country with a quasi-pegged exchange rate will have large outflows by definition. In the past, these outflows came in the form of official FX reserve accumulation. These days, official FX reserve buildup has been replaced by outflows via state banks and other quasi-official institutions. In other words, the classification of these flows in the balance of payments has changed, but their nature—foreign asset accumulation by China’s government as a counterpart to the current account surplus—has not.
Figure 7. China’s official foreign exchange reserve accumulation and settlement by Chinese banks, in billions of dollars
Figure 8. Effect of US tariffs on China’s official dollar-yuan fix
Even if outflows are manageable currently (Figure 7), that does not mean that capital flight is a thing of the past. The critical element is households’ expectations for yuan depreciation. U.S. tariffs in 2017 and 2018 caused the yuan to fall around 10% against the dollar in an almost one-for-one offset (Figure 8). That depreciation did not result in large-scale capital flight, perhaps because—unlike 2015—Chinese households were by this point used to some exchange rate volatility. However, another round of large U.S. tariffs could change this picture. If additional, large U.S. tariffs convince Chinese households that the yuan is likely to fall substantially, capital flight could quickly reemerge. This is China’s Achilles’ heel in any coming trade dispute with the United States.
The Brookings Institution is committed to quality, independence, and impact.
We are supported by a diverse array of funders. In line with our values and policies, each Brookings publication represents the sole views of its author(s).





Commentary
China’s Achilles’ heel—capital flight
July 4, 2024