
1. Introduction
Millions of American parents help finance a college education to secure economic security and upward mobility for their children. Yet the high costs of post-secondary education have created a challenging reality: Many parents who want to invest in their children’s futures cannot pay for college out of savings alone. This parental aspiration to create better opportunities for their children—to give them chances they themselves may not have had—has led many families to federal Parent PLUS loans.
Since 1980, parents have been able to borrow from the federal government through the Parent PLUS program to help finance their children’s college education. The Parent PLUS program fills the gap that remains after students exhaust federal Pell grants, institutional aid, and Direct Loans—debt that students take on in their own names without parental obligation. Direct Loans are capped at $5,500-$7,500 annually for dependent students depending on the year in school. In contrast, Parent PLUS loans are entirely the parents’ responsibility; students bear no legal obligation for repayment. For over three decades, Parent PLUS borrowing was constrained only by an institution’s cost of attendance, leaving the option for parents to borrow considerable sums. For some parents, this debt has proven to be overwhelming.
New borrowing limits for Parent PLUS—an annual cap of $20,000 per student and a lifetime limit of $65,000 per student—will go into effect on July 1, 2026. These changes are part of the One Big Beautiful Bill Act (OBBBA), signed into law on July 4, 2025, which introduced a number of changes to federal student aid including the elimination of Grad PLUS and the restructuring of income driven repayment.
Most families who currently struggle to repay Parent PLUS loans borrowed amounts below these new caps. Meanwhile, the families most likely to be constrained by the new limits—higher-income borrowers who typically borrow larger amounts—are generally better positioned to manage debt repayment successfully.
The core challenge facing Parent PLUS is not excessive borrowing by creditworthy families but rather that even modest debt burdens can overwhelm lower- and middle-income families. By focusing on aggregate borrowing limits rather than borrower-specific capacity to repay, the new policy may inadvertently restrict access for families who can afford larger loans while leaving financially vulnerable families exposed to unmanageable debt burdens.
This analysis examines who borrows through Parent PLUS, how the new loan limits will affect different groups of borrowers, and why uniform caps may miss the mark in addressing the program’s most pressing challenges.
2. The Parent PLUS Policy Challenge
The Parent PLUS program sits at the intersection of competing policy objectives: expanding access to higher education, protecting borrowers from unsustainable debt, and maintaining fiscal responsibility. Parent PLUS loans enable families to choose institutions they believe offer strong opportunities, even when these options cost more than the most affordable alternatives, creating a tension between expanding educational choice and minimizing debt burden.
The federal government makes loans directly to students based on the rationale that education increases future income, allowing students to repay their loans in most circumstances. The rationale for Parent PLUS loans is somewhat different: Parental income and assets that determine capacity to pay are likely well-established when their children are of college age, so the program serves primarily as a liquidity management tool for families with sufficient resources to contribute to their children’s education. When parents take out other loans (such as those for credit cards, cars, or homes), lenders evaluate whether they can afford the payments and charge an interest rate consistent with the risk of nonpayment, a process known as underwriting. The Parent PLUS program’s underwriting process is minimal. To participate, parents must have no adverse credit history defined as debts (in excess of $2,085) that are significantly delinquent or in collection/charged off within the last two years, but the government does not assess whether parent borrowers can afford the payments. These standards are more lenient than under the rules in place before 2014.1 The amount that parents can borrow is limited only by the total cost of attendance less financial aid, including federal loans to the student. How much families can borrow does not depend on financial circumstances, and the interest rate is the same for all borrowers.
2.1 The borrower perspective
Parent PLUS borrowers exist along a spectrum of financial capacity and default risk. At one end are higher-income families who use Parent PLUS loans primarily for liquidity management. These families could potentially pay college costs up front but prefer to spread payments over time while taking advantage of federal loan benefits such as tax deductibility and flexible repayment options. At the other extreme are families who turn to Parent PLUS borrowing because they have exhausted other financing options and cannot qualify for private market alternatives due to poor credit histories, limited income, or both. Between these extremes lies a substantial middle group of borrowers who are positioned to manage modest levels of additional debt to help their children pay for college.
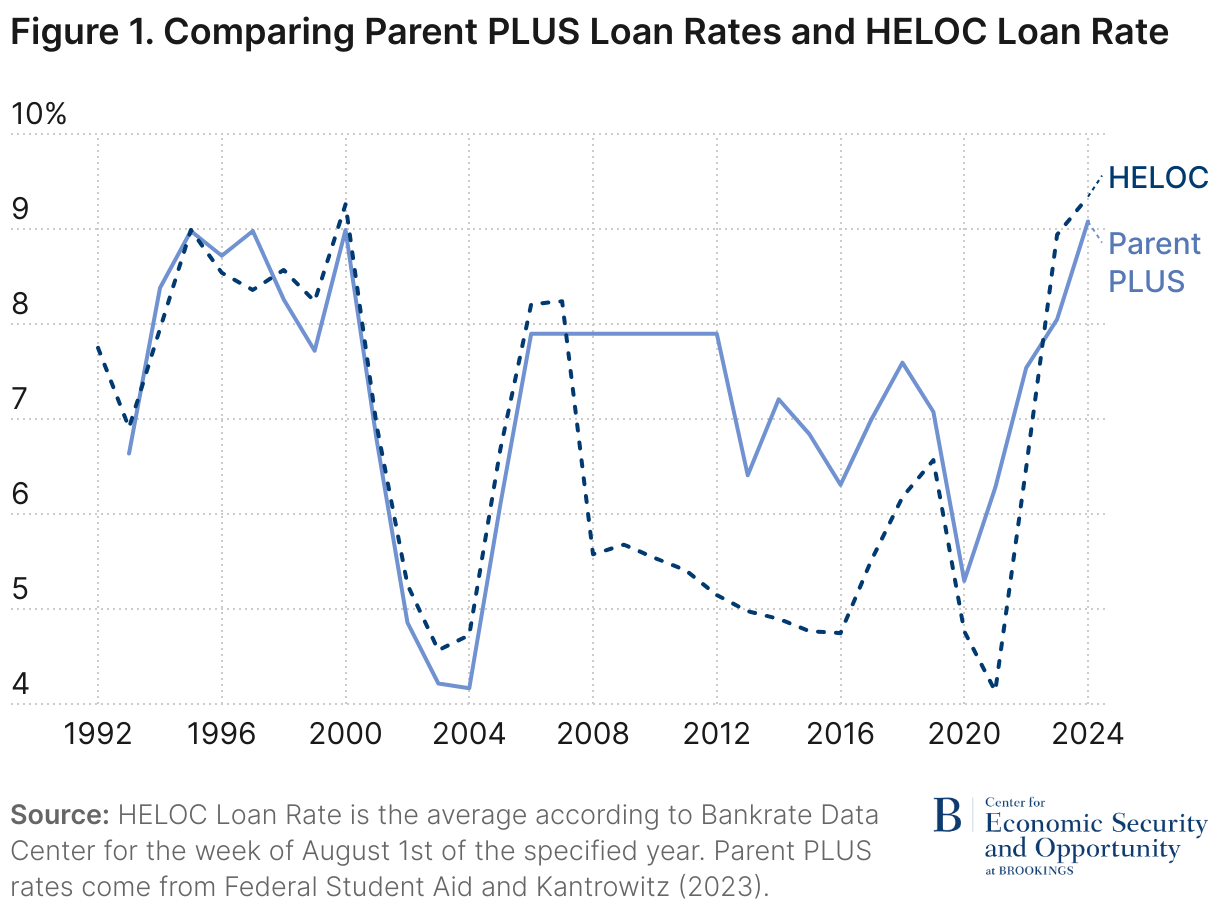
Some parents may find it advantageous to consider private market alternatives, particularly home equity borrowing, to pay for college. Over the last 15 years, home equity lines of credit (HELOCs) and home equity loans have usually offered lower interest rates than Parent PLUS loans, as shown in Figure 1. Within the private market, home equity lending is likely to be less expensive for borrowers (and less risky for lenders) because it is secured by the collateral of real estate. However, not all families own homes or have sufficient equity and income to access this financing option.
Although they may have higher interest rates and origination fees than loans offered by the private sector, Parent PLUS loans offer several advantages that make them attractive to many families. Unlike private loans, Parent PLUS loans provide flexible repayment options such as the extended and graduated plans. Current Parent PLUS borrowers also have access to some income driven repayment options, though new Parent PLUS borrowers after July 1, 2026 will not have access to income-based options.2 Parent PLUS loans also qualify for the student loan interest deduction on federal taxes. These federal protections and repayment flexibility help insure parent borrowers against unforeseen financial risks, potentially making Parent PLUS a more attractive option than private alternatives despite higher upfront costs.
For some Parent PLUS borrowers, unexpected changes in circumstances like unemployment or health shocks can make their finances unexpectedly more precarious. But for borrowers who start out with low incomes, financial distress arising from Parent PLUS obligations is predictable. Periods of deferment or forbearance only magnify problems as unpaid interest is capitalized, increasing the overall amount owed. Borrowers are often repaying Parent PLUS loans well into retirement and can have their Social Security benefits garnished: “I took out Parent PLUS Loans for three of my daughters . . . $295 has been deducted from my meager Social Security check for several months now to repay these Parent PLUS Loans. This leaves me with less than $1,600 per month to live on.”
Repayment struggles are concentrated among lower-income families, with Black and Hispanic families experiencing disproportionately high rates of financial distress related to Parent PLUS obligations. We explore these patterns further below.
2.2 The government perspective
Fiscally, Parent PLUS occupies a unique position among federal student loan programs. The Parent PLUS origination fee is notably higher than other loans at 4.228%, compared to 1.057% for federal direct subsidized and unsubsidized loans made to students. For the estimated $13 billion in Parent PLUS loans annually, the federal government collects nearly $550 million in origination fees alone. Overall, the Congressional Budget Office estimates that Parent PLUS generates 16.2 cents in revenue for every dollar disbursed, making it one of the few profitable federal student loan programs.
Yet this profitability masks concerning repayment patterns. On average, Parent PLUS borrowers still owe nearly half their initial balance 10 years after entering repayment. Although the Department of Education does not calculate conventional cohort default rates for Parent PLUS loans, recent analysis identifies more than a dozen institutions (largely for-profit) where over 30% of parent borrowers default within two years of entering repayment. These outcomes suggest that the program’s minimal underwriting standards—requiring only that borrowers have no adverse credit history in the two years prior to borrowing—do not ensure that loan obligations match borrowers’ capacity to repay.
The program’s profitability depends on borrowers who successfully make payments over time. Any policy changes that alter the composition of the borrower pool could significantly affect the program’s fiscal sustainability, particularly if changes concentrate lending among borrowers with poor repayment prospects.
2.3 The institutional perspective
Colleges and universities, particularly those that do not get substantial revenue from state appropriations or endowment funds and thus are tuition dependent, have strong incentives to encourage Parent PLUS borrowing regardless of families’ ability to repay. Unlike federal student aid programs that come with institutional accountability measures, institutions face no meaningful consequences when Parent PLUS borrowers struggle or default.
This misalignment of incentives can easily become a form of “predatory inclusion”, where colleges and universities provide access to credit and enrollment in educational programs that may not deliver promised returns while placing financial risks primarily on borrowers rather than institutions.3
When Congress proposed eliminating Parent PLUS entirely through the College Cost Reduction Act in 2024, higher education organizations mounted strong opposition. The Association of American Universities argued that elimination would “limit the ability of students with the greatest financial need to pursue studies at the institution of their choice”. The National Association of Student Financial Aid Administrators warned that elimination could “drive borrowers to riskier private loans” and “ultimately make college less affordable for students.”
This dynamic is especially pronounced at institutions serving large numbers of low-income students and Black and Hispanic students. These institutions often have limited resources for need-based institutional aid and depend heavily on tuition revenue for operations. With substantial fixed costs to cover, these tuition-dependent institutions rely on enrollment from tuition-paying students. The availability of Parent PLUS loans allows institutions to maintain enrollment even when tuition charges exceed what families can realistically afford to pay, illustrating the broader challenge of college costs that outpace family financial capacity.
3. Who borrows and why it matters
To understand the impact of loan limits, we examined the distribution of current borrowers across family characteristics and institutional settings. This analysis draws on two primary data sources: the National Postsecondary Student Aid Survey (NPSAS:20), a nationally representative survey of 352,740 students, and the Department of Education’s College Scorecard, which links information from the National Student Loan Data System (NSLDS) administrative repayment data and information from Integrated Postsecondary Education Data System (IPEDS) surveys.
3.1. Borrowing patterns by family characteristics
In the 2019-2020 academic year, 7.7% of dependent undergraduate students had parents who borrowed through Parent PLUS, with an average loan amount of $16,272. These aggregate indicators disguise substantial heterogeneity—borrowing rates differ markedly across colleges and by race and family income.
Figure 2a4 illustrates the distribution of Parent PLUS borrowing across income groups by annual borrowing amounts. Higher-income families are substantially more likely both to borrow and to borrow larger amounts. Among families earning more than $130,000 annually, 46% of Parent PLUS borrowers take more than $20,000 annually. By contrast, among families earning less than $30,000, only 16% borrow more than $20,000 annually.
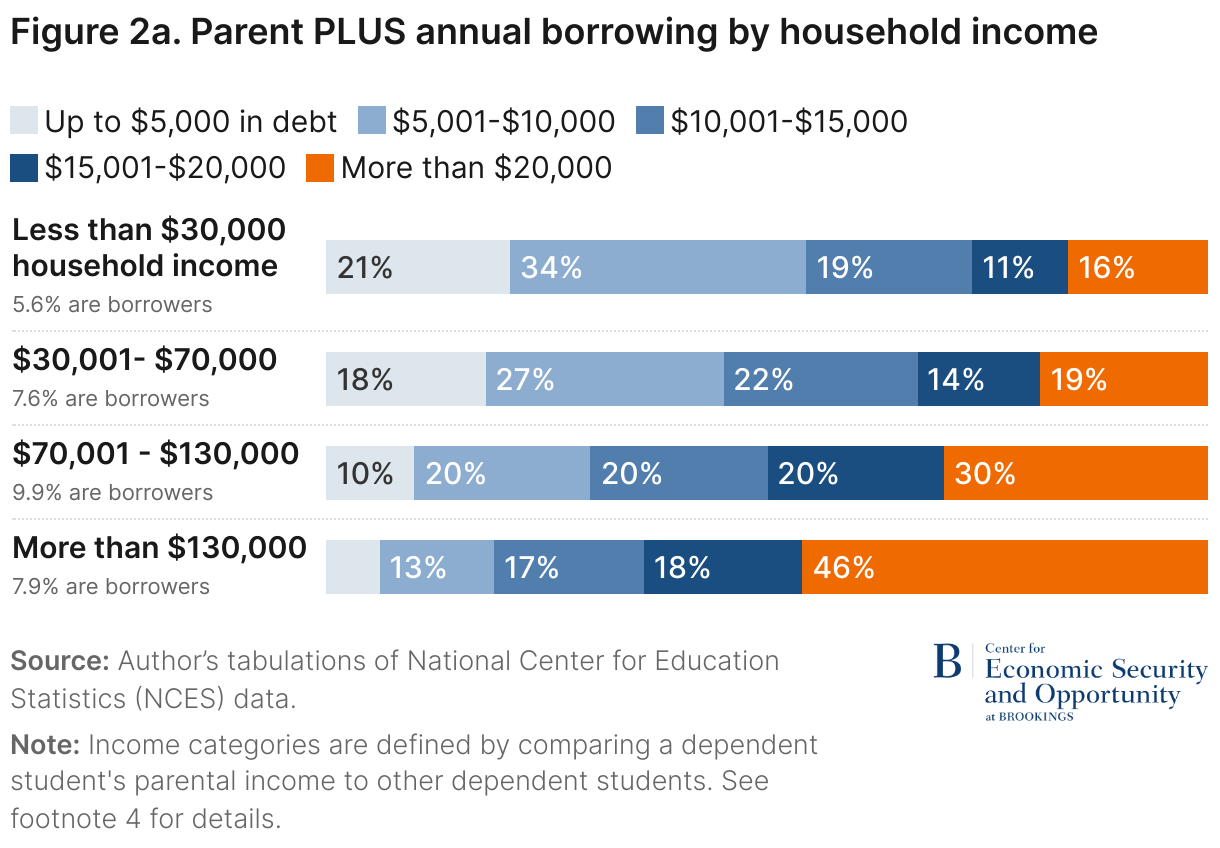
However, these patterns mask a crucial insight: While lower-income families borrow smaller absolute amounts, they face significantly higher debt-to-income ratios. To illustrate the burden this creates, consider a parent who borrows $30,000 (well below the new limits) at the current Parent PLUS interest rate of 9.08%. Under a standard 10-year repayment plan, this would require monthly payments of approximately $381. For a family earning $150,000 annually, this is a manageable 3% of gross income. For a family earning $50,000, the same payment consumes over 9% of gross income—a substantial burden that leaves little room for other financial obligations or unexpected expenses.
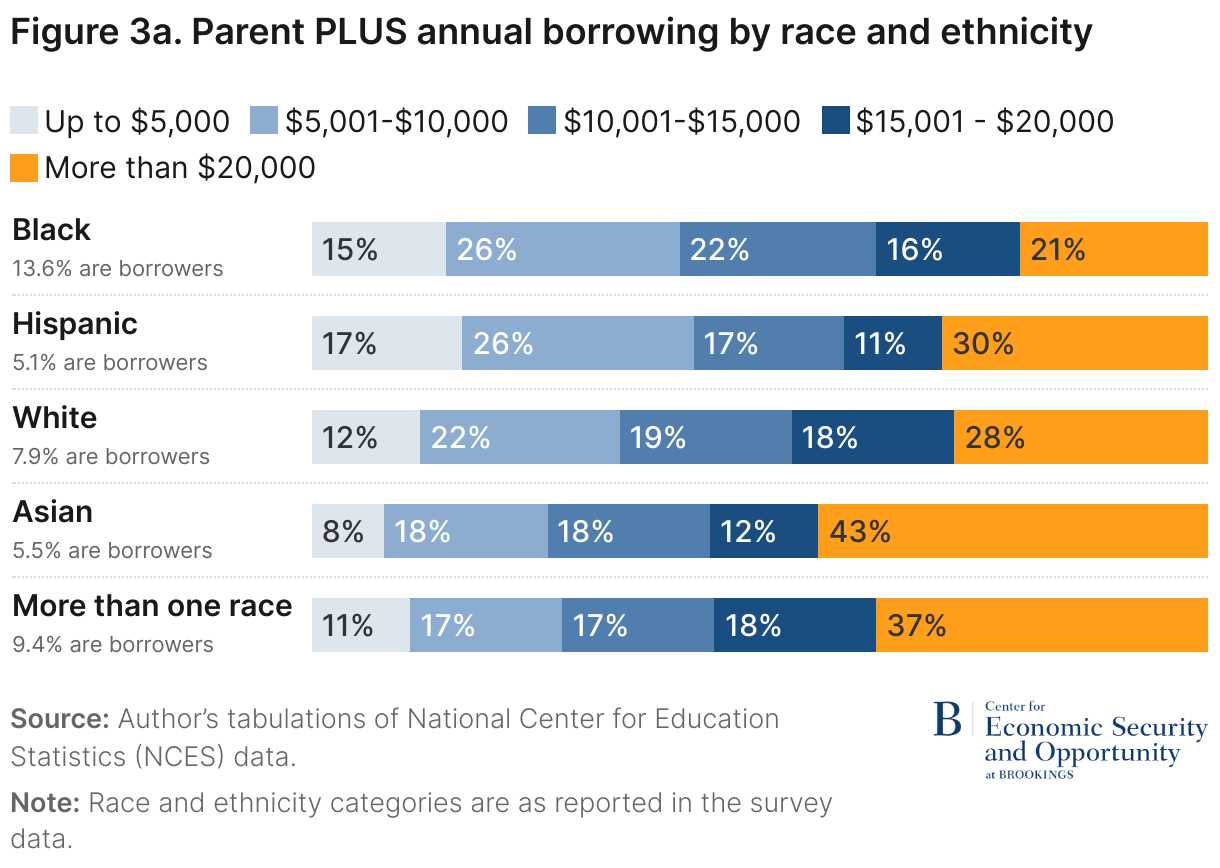
Figure 3a reveals concerning disparities across racial and ethnic groups. First, there are substantial differences across race and ethnicity in the share of parents who borrow: 13.6% of Black parents borrow, while only 7.9% of white parents and 5.5% of Asian parents take out Parent PLUS loans. Asian families are most likely to borrow large amounts, with 43% of Parent PLUS borrowers taking more than $20,000 annually. Black families, while somewhat less likely to borrow the largest amounts, still borrow substantial amounts: 21% take more than $20,000 annually despite typically having lower incomes and less wealth to support repayment—disparities that reflect the broader pattern of persistent racial wealth gaps across the income distribution. Hispanic families show similar patterns, with 30% borrowing more than $20,000 annually.
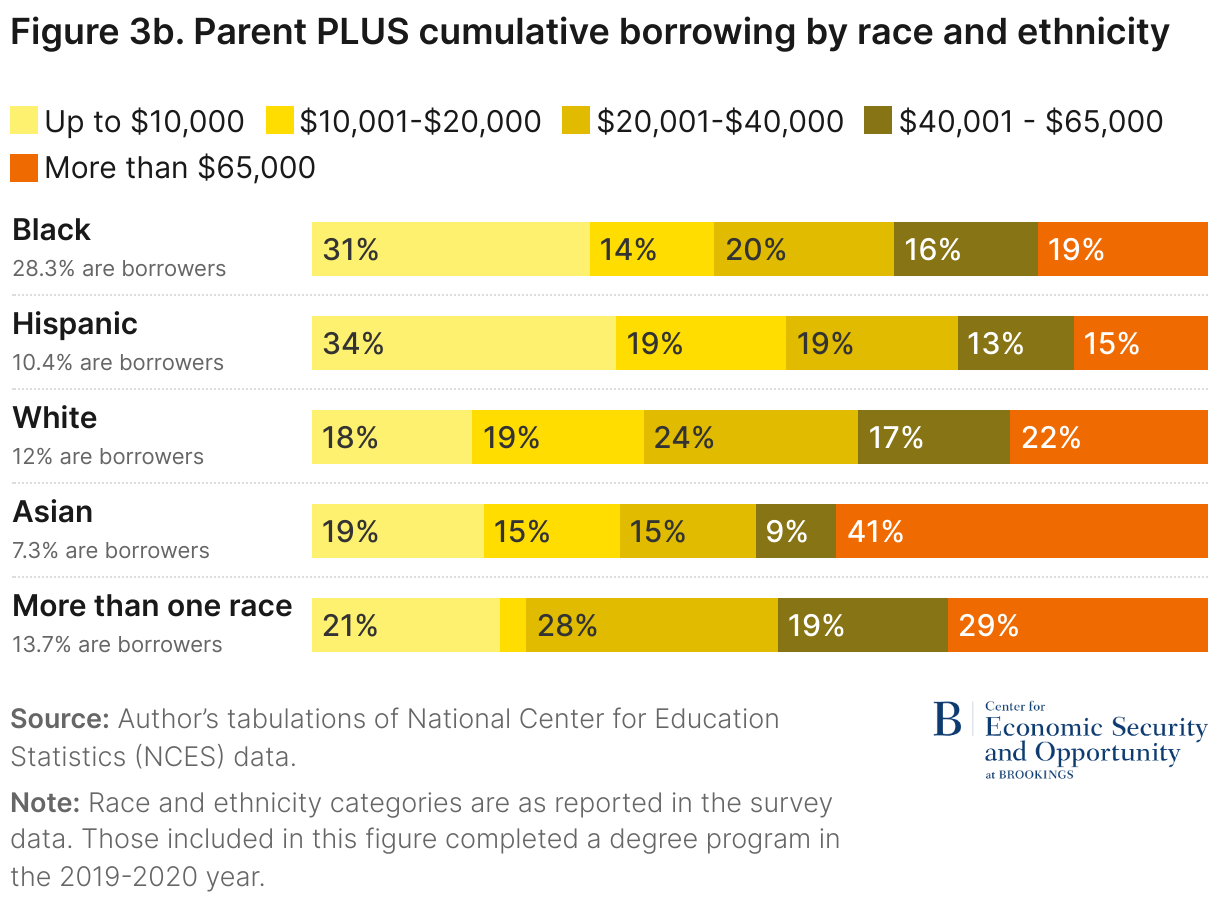
Rachel Fishman considers how the joint distribution of race and family income interact with Parent PLUS borrowing. While parents with family income less than $30,000 in 2020 accounted for about 10% of white Parent PLUS borrowers, about 32% of Black borrowers were from this low-income bin. Measuring parental means by Expected Family Contribution (EFC, now called Student Aid Index, SAI) from the FAFSA shows that 36% of Black borrowers and 9% of white borrowers had an EFC of 0, indicating that their parents were not positioned to make any contribution towards the cost of college for their children according to the government.
The College Scorecard data reinforces these concerns about financial vulnerability. Among Parent PLUS borrowers, 56% qualify for Pell Grants—federal aid available only to families demonstrating substantial financial need—indicating that a large portion of the Parent PLUS portfolio involves families with incomes too low to make substantial contributions to their children’s education. Institutions where higher proportions of Parent PLUS borrowers also received Pell Grants consistently show slower repayment outcomes, with many borrowers owing more than their original balance after 10 years because their payments have not even been sufficient to cover accumulating interest, much less make progress on reducing the loan principal.
3.2. Institutional variation in borrowing and repayment
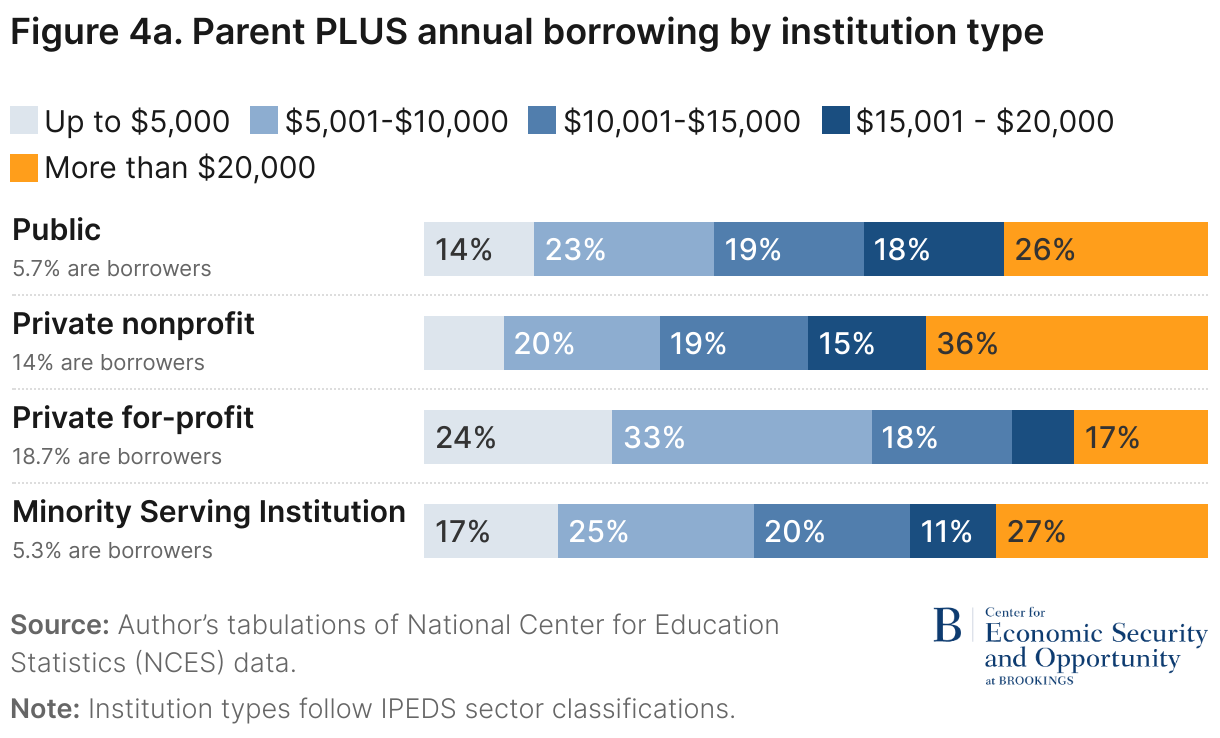
Figure 4a demonstrates how the type of institution students attend strongly predicts Parent PLUS borrowing patterns. More detailed analysis shows that, among students attending four-year colleges, parents of those at private nonprofit four-year institutions are most likely to borrow (19.7% on average) and have higher average debt ($56,730), reflecting higher costs compared to public institutions (where 11.9% borrow and the average amount borrowed is $40,877). Parental borrowing for public two-year colleges is more modest, reflecting generally lower costs of these institutions (2.3% and $20,469 among those borrowing).
More concerning are the repayment patterns across institutional sectors shown in Table 1. Families borrowing for students at public four-year institutions have relatively strong repayment progress, with 46.7% of initial balances remaining after 10 years. Private nonprofit institutions show weaker repayment progress at 53.5%, while for-profit institutions lag significantly at 61.1%.
|
Institution Type |
Mean Origination Balance ($) |
1-Year Remaining Balance |
5-Year Remaining Balance |
10-Year Remaining Balance |
N Institutions |
|---|---|---|---|---|---|
| All Institutions | 18,624 | 99.10% | 76.40% | 49.50% | 2,179 |
| 2-Year Public | 6,248 | 102.60% | 79.60% | 41.70% | 842 |
| 2-Year Non-Profit | 10,646 | 100.40% | 74.40% | 44.70% | 113 |
| 2-Year For-profit | 11,866 | 93.70% | 63.60% | 45.00% | 328 |
| 4-Year Public | 16,272 | 98.90% | 74.20% | 46.70% | 753 |
| 4-Year Non-Profit | 24,943 | 100.40% | 80.50% | 53.50% | 1,514 |
| 4-Year For-profit | 15,667 | 98.70% | 85.30% | 61.10% | 206 |
| HBCUs | 16,217 | 113.00% | 121.30% | 98.40% | 100 |
| Religious | 22,416 | 101.10% | 80.40% | 52.00% | 843 |
| Tribal | 5,137 | . | . | 51.10% | 35 |
Notes: Data come from U.S. Department of Education (2024). Remaining balance refers to the dollar-based repayment rate, showing the percentage of the original balance outstanding after the designated number of years. Mean origination balance is based on the 10-year cohort, which will vary from cumulative borrowing amounts for those completing degree programs in 2019-2020, estimated in Figure 4b. All statistics are weighted by cohort size. The All Institutions classification includes less-than-two-year institutions.
Some of the most concerning outcomes occur at Historically Black Colleges and Universities (HBCUs). Many families eligible for Pell grants took out Parent PLUS loans to attend these institutions and still owe 98.4% of their Parent PLUS debt after 10 years, on average.5 The incidence of substantial Parent PLUS debt burdens among low-income families at wealthy private institutions is also troubling (including those with endowments over $1 billion). A Wall Street Journal report showed that at Baylor University, where 47% of Pell-eligible parents borrow through Parent PLUS, only 28% were making progress on repayment within two years. Similar patterns emerged at other institutions: At Liberty University, 53% of Pell parents borrowed, with only 31% making repayment progress; at NYU, 46% of parents of students receiving a Pell Grant borrowed, with 44% progressing on repayment.
These institutional patterns reflect multiple factors: resource constraints that limit need-based aid, dependence on tuition revenue, and inadequate financial aid provision for families with limited income and wealth. The result is a concentration of financial risk among the families least equipped to bear it.
4. How loan limits change the borrowing landscape
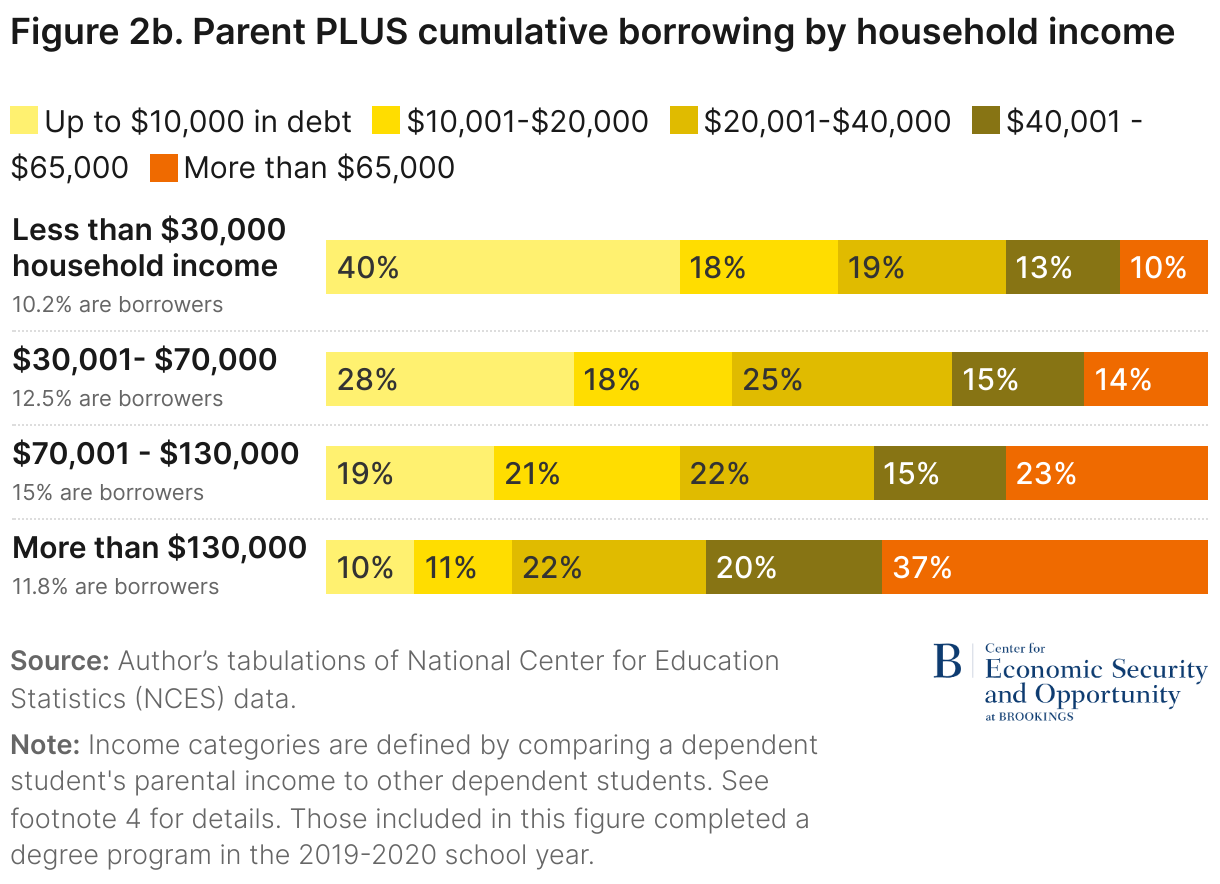
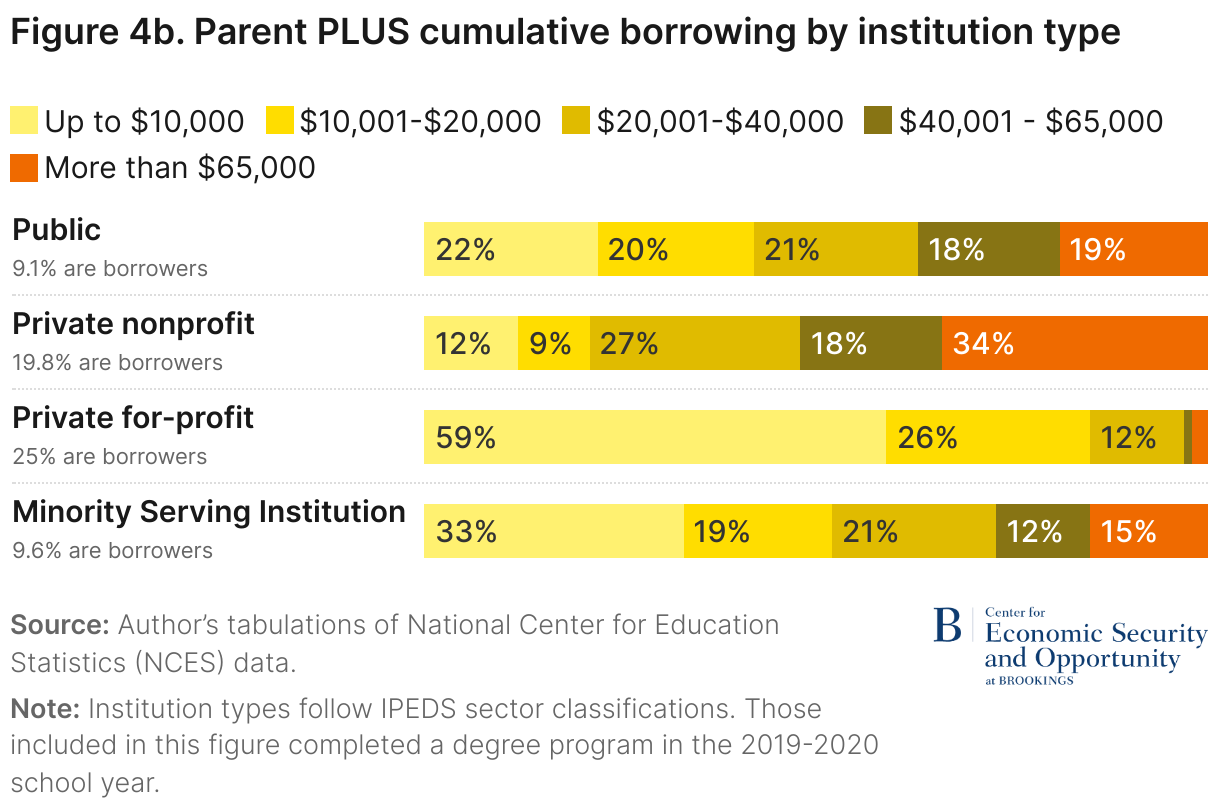
The effects of the new loan limits may run counter to the objectives of creating liquidity for borrowers who are well-positioned to repay, while protecting vulnerable borrowers. Our analysis of NPSAS data reveals that approximately 22% of current Parent PLUS borrowers would be affected by the $65,000 aggregate cap, while 29% would be constrained by the $20,000 annual limit. The incidence of “constraint” is illustrated in Figures 2 through 4, with the orange shading indicating constraints due to the annual limit in panel (a) and the cumulative limit in panel (b).
4.1. Who is likely to be constrained by the new limits
The borrowers most likely to be affected by these caps are disproportionately higher-income families who do not qualify for Pell Grants. As shown in Table 2, among borrowers who would hit the aggregate cap, 79% received no Pell Grant assistance, compared to only 58% of borrowers unaffected by the cap. The pattern is similar for the annual cap: 76% of affected borrowers are non-Pell recipients versus 52% of unaffected borrowers.
|
Aggregate Cap |
Annual Cap |
|||
|---|---|---|---|---|
| Pell Status | Non-Binding Group | Binding Group | Non-Binding Group | Binding Group |
| Pell | 41.8% | 21.4% | 48.4% | 23.7% |
| Non-Pell | 58.2% | 78.6% | 51.6% | 76.3% |
| Total | 100% | 100% | 100% | 100% |
Notes: Data from National Center for Education Statistics (2020). The binding group for the aggregate cap is determined by identifying Parent PLUS borrowers with a student who completed a degree in 2019-2020 borrowing more than $65,000 total. For the annual cap, borrowers who borrowed more than $20,000 for the 2019-2020 award year are grouped into the binding group.
This distribution matters enormously for policy impact. Pell-eligible households must demonstrate financial need, and, for the 2022-2023 aid year, over 60% of Pell recipients came from households making less than $30,000 annually. These families, who face the greatest repayment challenges, will be largely unaffected by the new caps that still allow borrowing well above what they typically borrow.
Meanwhile, the families most likely constrained by the limits are precisely those with higher incomes and better repayment prospects. The policy essentially restricts borrowing by families who are most capable of managing larger debt loads while leaving exposed those who struggle with even modest obligations.
4.2. Institutional impact patterns
The caps also create disparate effects across institution types. As shown in Table 3, among borrowers affected by the aggregate cap, 54% attend private nonprofit four-year institutions, compared to only 31% of unaffected borrowers. Students at public four-year institutions are somewhat less likely to be constrained, reflecting the lower average costs at these institutions.
|
Aggregate Cap |
Annual Cap |
|||
|---|---|---|---|---|
| Institution Type | Non-Binding Group | Binding Group | Non-Binding Group | Binding Group |
| Public 4-year | 52.9% | 43.4% | 58.2% | 50.6% |
| Public 2-year | 5.0% | – | 2.0% |
– |
| Private Nonprofit 4-year | 30.8% | 54.1% | 33.7% | 45.0% |
| Private Nonprofit 2-year | – | – | – | – |
| Private For-Profit 4-year | 3.8% | – | 2.8% | 3.3% |
| Private For-Profit 2-year | 6.8% | – | 2.7% | – |
| Total | 100% | 100% | 100% | 100% |
Notes: Data come from National Center for Education Statistics (2020). The binding group for the aggregate cap is determined by identifying Parent PLUS borrowers with a student who completed a degree in 2019-2020 borrowing more than $65,000 total. For the annual cap, borrowers who borrowed more than $20,000 for the 2019-2020 award year are grouped into the binding group. Suppression occurs due to failure to meet NPSAS disclosure standards related to sample size.
These patterns have revenue implications for both the federal government and the institutions themselves. Private nonprofit institutions generally show weaker repayment performance than public institutions. The institutions with the most concerning repayment outcomes—particularly HBCUs and some for-profit institutions—are more likely to have borrowers who fall below the caps and thus remain unaffected by the policy.
4.3. Effects on government revenue
From the federal budget perspective, the new loan limits may—somewhat paradoxically—weaken the program’s fiscal position by disproportionately reducing borrowing among those most likely to repay. High-income and non-Pell-eligible borrowers are relatively likely to pay their loans back on time, avoiding default and potential forgiveness that is costly for the federal government. Slow repayment can increase government revenue by increasing interest payments, but it can also decrease government revenue if it results in forgiveness or discharge before the full principal has been recovered. The cap disproportionately constrains this group of higher-income people more likely to repay their debt and less likely to default. The cap is likely to decrease the revenue-generating capacity of the program by increasing the concentration of debt held by those less likely to repay within the Parent PLUS portfolio.
4.4. Market substitution and access effects
The new Parent PLUS loan limits will likely accelerate the development of private parent lending markets. Private lenders like SoFi and Navient have been clear with their shareholders about the opportunities for expansion in light of caps on Parent PLUS. SoFi CEO Anthony Noto explains that SoFi will “absolutely capture that opportunity” if the government reduces lending, noting that this type of lending produces a high return on equity owing to the parental backing.
For creditworthy families constrained by the new limits in Parent PLUS, private alternatives may offer superior terms. Home equity lines of credit, for instance, have historically offered lower interest rates than Parent PLUS loans, and other private lending products may emerge to serve this market segment. However, private market expansion will likely increase stratification in the cost of borrowing.
Families with strong credit, substantial home equity, or other collateral can access lower-cost alternatives, while families with limited assets face reduced options or potentially predatory lending. Sites that compile information on private loans for parents indicate a wide range of rates—from 2.99 to 17.99% APR—contingent on credit scores and other information, with credit scores above 600 typically required for loan access. This market segmentation could amplify existing differences in how families finance higher education.
For some families, loan limits may encourage shifts toward lower-cost educational options, particularly public institutions. While this could improve long-term financial outcomes, it may also constrain access to institutions that families perceive as better fits for individual students’ needs.
5. The limits of loan limits
The fundamental problem with uniform borrowing caps is their failure to account for the enormous heterogeneity in family financial circumstances and capacity to repay.
5.1. Mismatched policy tool
Effective borrower protection requires matching loan obligations to repayment capacity—precisely what traditional underwriting accomplishes in private credit markets. The Parent PLUS program’s minimal underwriting standards fail to assess whether borrowers can realistically manage debt payments alongside their other financial obligations.
The OBBBA borrowing limits substitute crude quantity limits for meaningful assessment of capacity to repay. This approach is likely to mean that some families who could afford payments have insufficient access to capital, while still permitting excessive borrowing relative to income for others.
One approach—suggested by Sandy Baum, Kristin Blagg, and Rachel Fishman—would be to align borrowing capacity with financial circumstances measured by the FAFSA application, which would be closer to more traditional underwriting employed by private creditors. However, being forthright about limiting parental borrowing for low-income families highlights the importance of increasing need-based grant aid for these students. Without such intervention, young people may find themselves unable to pursue high-return post-secondary education.
5.2. Persistent problems and potential unintended consequences
Beyond the mismatch between loan limits and capacity to pay, several fundamental problems remain unaddressed by the loan limits.
Misalignment of institutional incentives: The loan limits in the OBBBA fail to address the problem of institutional incentives. Under the current system, there are no meaningful consequences for colleges and universities that encourage parents to take on loans they are unlikely to repay. This creates a troubling problem. On one hand, families trust educational institutions to provide pathways to economic prosperity for their children. On the other hand, many of these institutions are heavily tuition-dependent and rely on Parent PLUS revenue as a key source of financing, creating incentives to charge students more than they can reasonably afford, with the expectation that parents will borrow.
Lack of information: Families often lack clear information about their expected debt obligations, realistic repayment scenarios, or the labor market returns associated with different educational choices. Many parents may not fully understand that Parent PLUS loans cannot be easily discharged in bankruptcy or that balances can grow over time when payments are not enough to cover accrued interest.
Risky Parent PLUS loans are concentrated in certain institutions: The institutions most dependent on Parent PLUS borrowing are often those serving the most financially vulnerable populations. Loan limits do nothing to address the underlying resource constraints that drive this dependence or to improve these institutions’ capacity to provide need-based aid.
Parent PLUS loan limits are likely to create expanded opportunities for private market participation in parental lending. For families with strong financial profiles and good credit, this shift may yield access to lower-cost options than Parent PLUS loans, which carry relatively high interest rates and origination fees. However, for families with weaker credit or limited collateral, private market underwriting may result in reduced access to loan funds and substantially higher borrowing costs, potentially exacerbating existing inequalities in college financing.
By removing the borrowers most likely to repay from the pool, loan limits may worsen the program’s risk profile and fiscal sustainability. This could ultimately threaten the program’s existence or lead to further restrictions that harm access.
6. Implications and conclusions
The Parent PLUS loan limits enacted in the One Big Beautiful Bill Act reflect legitimate concerns about family debt burdens and program sustainability, but the chosen approach may prove counterproductive. By focusing on the amount borrowed, rather than borrower-specific capacity to repay, the policy constrains families who can likely manage larger debt loads while leaving financially vulnerable families exposed to obligations they may struggle to meet.
The evidence suggests that families most likely to be affected by the caps—higher-income, non-Pell recipients attending private nonprofit institutions—generally have the strongest repayment prospects. Meanwhile, families who face the greatest repayment challenges typically borrow amounts well below the new limits. This mismatch undermines both the policy’s protective intent and its fiscal logic.
More effective approaches to Parent PLUS reform might include enhanced underwriting that considers borrowers’ financial circumstances, institutional risk-sharing mechanisms that create consequences when borrowers struggle, improved information systems that help families understand their obligations before borrowing, and targeted interventions for vulnerable populations rather than system-wide caps.
The current reform represents a missed opportunity to address the Parent PLUS program’s fundamental challenge: The systematic exposure of financially vulnerable families to debt burdens they cannot realistically manage. Addressing the underlying gap between what families are asked to pay and what they can afford requires policy solutions beyond loan program modifications, such as expanded need-based aid, institutional cost controls, or targeted support for the resource-constrained institutions that depend heavily on tuition revenue from low-income families. Until policymakers develop more sophisticated tools that match borrowing capacity to repayment ability alongside these broader affordability measures, reforms will continue to constrain the wrong borrowers while leaving the most vulnerable families at risk.
Related Content


Authors


|
Rank |
Institution Name |
Remaining Balance (%) |
Initial Debt |
HBCU |
For-Profit |
||||
|---|---|---|---|---|---|---|---|---|---|
|
10 Institutions with Highest Remaining Balances |
|||||||||
| 1 | Howard University | 1.05 | 31738 | X | |||||
|
2 |
Morgan State University | 1 | 17634 | X | |||||
| 3 |
Full Sail University |
0.9 | 36990 | X | |||||
| 4 | Prairie View A&M University | 0.9 | 7788 | X | |||||
| 5 | University of Memphis | 0.9 | 7123 | ||||||
| 6 | North Carolina A&T State University | 0.85 | 9696 | X | |||||
| 7 | Florida Agricultural and Mechanical University | 0.85 | 11215 | X | |||||
| 8 |
Valencia College |
0.84 | 6078 | ||||||
| 9 | Florida International University | 0.84 | 11080 | ||||||
| 10 | Berklee College of Music | 0.8 | 32654 | ||||||
|
10 Institutions with Lowest Remaining Balances |
|||||||||
| 1 | Brigham Young University-Idaho | 0.2 | 1241 | ||||||
| 2 | University of Minnesota-Twin Cities | 0.23 | 2655 | ||||||
| 3 | Appalachian State University | 0.26 | 4192 | ||||||
| 4 |
Grand Rapids Community College |
0.27 | 1118 | ||||||
| 5 |
University of Northern Iowa |
0.27 | 3688 | ||||||
| 6 | University of California-Davis | 0.27 | 4878 | ||||||
| 7 | Western Washington University | 0.28 | 4225 | ||||||
| 8 | University of Wisconsin-Eau Claire | 0.28 | 2331 | ||||||
| 9 | Bellevue University | 0.29 | 2351 | ||||||
| 10 | University of Wisconsin-La Crosse | 0.3 | 3208 | ||||||
Notes: Data come from U.S. Department of Education (2024). This table shows the top and bottom 10 institutions by Parent PLUS 10-year repayment rate. Sample is restricted to institutions with at least 7,500 undergraduate students and at least 50 Parent PLUS borrowers. Repayment rate represents the percentage of debt outstanding 10 years after entering repayment. Higher rates indicate worse repayment performance. HBCU column shows X marks for Historically Black Colleges and Universities. For-Profit column shows X marks for for-profit institutions.
-
Footnotes
- The underwriting standards in place before 2014 required no bankruptcies, foreclosures, defaults, tax liens, or wage garnishments during the preceding five years along with the absence of a delinquency of more than 90 days on any debt. These standards were used by banks in administering Parent PLUS loans under the Federal Family Education Loan (FFEL) or guaranty program, which was eliminated in 2010 and replaced by Direct loans administered by the Department of Education. Up until 2011, the Department of Education did not fully enforce the underwriting standards that were part of the regulations, resulting in Parent PLUS loan denial rates that were about twice as high in the FFEL program (42%) as the Direct lending program (21%). In 2011, the Department of Education began enforcing the credit history requirements, resulting in a substantial decline in Parent PLUS receipt and significant outcry from colleges and universities enrolling a large number of students from low-income families who were denied loans. After much lobbying, the underwriting standards were shifted by the Department of Education to the two-year window in 2014 with an allowance for small debt write-offs, along with an appeal mechanism which required a counseling module for those with adverse credit histories; see Congressional Black Caucus press release for a timeline and further details.
- Borrowers can access Income-Contingent Repayment (ICR) by consolidating their Parent PLUS loans into a Direct Consolidation Loan. This consolidation requirement exists because of specific statutory language in the Higher Education Act: while 20 USC 1087e(d)(1)(E) explicitly excludes Parent PLUS loans and consolidation loans that include Parent PLUS loans from IBR eligibility, the parallel provision for ICR in 20 USC 1087e(d)(1)(D) contains no such exclusionary language for consolidation loans, creating the pathway for consolidated Parent PLUS loans to access ICR. ICR is broadly regarded as the least generous income driven repayment plan with payments set at 20% of income above an income protection allowance. Because the Department of Education’s data processing systems allowed a loan that was consolidated then reconsolidated (“double consolidation”) to avoid classification as Parent PLUS, the double consolidation workaround or loophole allowed borrowers to access more favorable IDR plans like IBR, PAYE and REPAYE with payment rates of 10-15% of income because consolidating twice obscured to servicers a loan’s origin as Parent PLUS (88 FR 43820, July 10, 2023). The workaround of double consolidation ended July 1, 2025.
- The term “predatory inclusion” originates from Keaanga-Yamahtta Taylor’s seminal work, “Race for Profit,” where she analyzes its application within the subprime lending market and the 2008 mortgage collapse, which has been subsequently applied by other researchers in the domain of higher education. The term applies when colleges and universities present Parent PLUS loans to low-income and minority families as a crucial tool for access to higher education, leveraging messages of opportunity and upward mobility, even when these loans are likely to lead to substantial financial hardship. While a federal loan may seem less “predatory” than private alternatives, the obligations can still be crippling for vulnerable populations.
- Income categories for Figures 2a and 2b are based on ordering the parental income for all dependent students. The 25th percentile for income is $30,100, the 50th percentile is $68,500, and the 75th percentile is $130,000.
- Appendix Table A1 provides a list of 10 institutions with the best and weakest repayment trajectories. HBCUs are five of the 10 institutions with weak repayment outcomes.
The Brookings Institution is committed to quality, independence, and impact.
We are supported by a diverse array of funders. In line with our values and policies, each Brookings publication represents the sole views of its author(s).