Artificial intelligence (AI) continues to dominate headlines, spanning chip supremacy and job losses to AI actresses and U.S. national security. These articles demonstrate that AI is top of mind across industries, and the technology is touching virtually every aspect of government and society. As we showed in our recent series on national AI plans, not all countries are equally capable of embracing AI, and the relative success for each country largely hinges on the country’s technological prowess as well as their “bench strength” of people to power and direct the technology. These insights helped us understand why some countries are further ahead in the AI race.
This paper builds on the notion that, as with countries, not all U.S. states are equally capable of implementing AI and important differences exist. In our first piece, we investigated the general themes of bills introduced across the country in 2025 and examined the number of bills proposed and passed for each theme. We found that bills proposing to ban nonconsensual intimate imagery (NCII) and child sexual abuse material (CSAM) had the greatest number of bills proposed but, at the time of our analysis, none of the bills had become law. Employment was the only area where a significant percentage of bills had been signed into law.
In our second piece, we examined the characteristics of states that proposed AI legislation and found that younger, wealthier, and Democratic-leaning states are leading the way. Older, poorer, and Republican-leaning states were much less active in proposing AI legislation, suggesting that these states are either ideologically opposed to action or lack sufficient capacity to act. Understanding these enablers allows policymakers to build realistic pathways for AI development that are consistent with the ground-level reality within each state.
For this blog, we deepen the lens to better understand the characteristics of the various states that have successfully passed AI legislation, given the relatively low number of bills that have been passed.
Our data
Our team used tracking from the Brookings Center for Technology Innovation for this analysis and is current as of Oct. 20, 2025. We identified a total of 386 bills introduced across all 50 states with at least one bill in each state.
We grouped approximately 20 substantive categories of bills into three overarching themes (see Table 1) and then looked at the success rate for each theme (see Table 2).
The highest percentage of bills that are still active center on protection of the individual, but this area also saw the lowest percentage of bills passed. We suspect that this is because all legislators are likely interested in protecting individuals, but this requires these legislators to grapple with the concept of “fairness,” which is central to these bills. That is, for usage of AI in areas like health care decisionmaking, legislators are likely having trouble balancing the competing desires of health insurance companies with those of the insured. With that said, we assume there would be great unanimity on bills regarding sexual exploitation.
Transparency and trust had the largest number of bills overall (both all bills and active bills), but its passed bill percentage (15.5%) and its very high active bills percentage (80%) indicate that legislators may be struggling with competing topics such as disclosure versus transparency and market-orientation versus citizen-orientation. As with protection of the individual, we speculate that legislators are having difficulty successfully balancing these topics in a way that enables bill passage.
Responsible governance, while comprising the smallest number of bills (114) and the smallest number of active bills (64), had both the highest number of bills passed (44) and the highest percentage of bills passed (38.6%). We suspect that these are standard institution-building proposals with low ideological resistance as their underlying intentions receive broad bipartisan support. Said differently, these bills reflect what all governments are tasked to do: provide good governance structures over government operations.
After calculating these success rates, we gathered descriptive data to better predict what kinds of bills would pass or fail in each state. We used the following:
- Per capita income: Captures the level of income per state. A higher per capita income is associated with greater income and therefore a higher available tax base. This data comes from the U.S. Bureau of Economic Analysis.
- Defeating poverty: Measures the amount of poverty per state. Higher levels indicate that the state is better able to raise an individual out of poverty, while lower levels indicate that the state is less able to do so. This data comes from the U.S. Bureau of Economic Analysis.
- Human capital: Measures the degree to which a state’s labor force can engage in innovative activities. States with “high levels of human capital are those with enhanced knowledge, measured by educational attainment, patent diffusion, knowledge spillover, business incubator presence, STEM degree holders and occupations, and the share of high-tech employment.” This indicator is taken from the StatsAmerica Innovation Intelligence Index (II3).
- Business profile: Gauges the business environment of the state by “measuring local business conditions and resources available to entrepreneurs and companies. The components identify the possible resources a region might offer that can lead to growth and subsequent innovation. These resources can be found in the form of capital (foreign investments or local banks), connectivity within and with other regions, dynamism of region, and entrepreneurship.” This indicator is also taken from the StatsAmerica II3.
- Governor party: Reflects whether the governor’s party is Republican or Democrat and is taken from each state’s website. There are currently 23 Democratic governors and 27 Republicans.
- State party base: Indicates the state’s propensity to vote Republican or Democrat across all statewide ballots. There are currently 23 states that lean Democratic and 27 states that lean Republican, according to Inside Elections.
Analysis
We conducted a qualitative comparative analysis (QCA) to examine how these six conditions combine to predict bill passage in each state. Using the calibrated data, we constructed configurations for each outcome (bills passed, bills active, and bills failed) and assessed them using degrees of coverage at two levels. Given the low number of passed and failed bills, we utilized the principle of asymmetry in QCA. Under this principle, high and low solutions (that is, configurations leading to presence and absence of the outcome respectively) are not the inverse of each other; rather, each provides new information that aids in understanding. As such, we can examine the absence of passed bills (i.e., those that are active or failed) and of failed bills (i.e., those that are active or passed) and triangulate the results with the presence of active bills (i.e., those that have neither been passed nor have failed). In this way, we can view the passage of AI legislation as traversing a set of possible obstacles or traps, flipping the lens from why bills pass or fail to why bills do not pass or fail.
In our analysis of the three outcomes, we identify negative (absence of AI bill passage and failure) and high (presence of active bills) outcomes. We use a heat map to identify which of the six core conditions explain each configuration. Orange represents a necessary absence, blue a necessary presence, and gray indicates that neither presence nor absence impacts the outcome. Individual conditions are read horizontally in rows, while configurations are read vertically in columns (see Table 3).
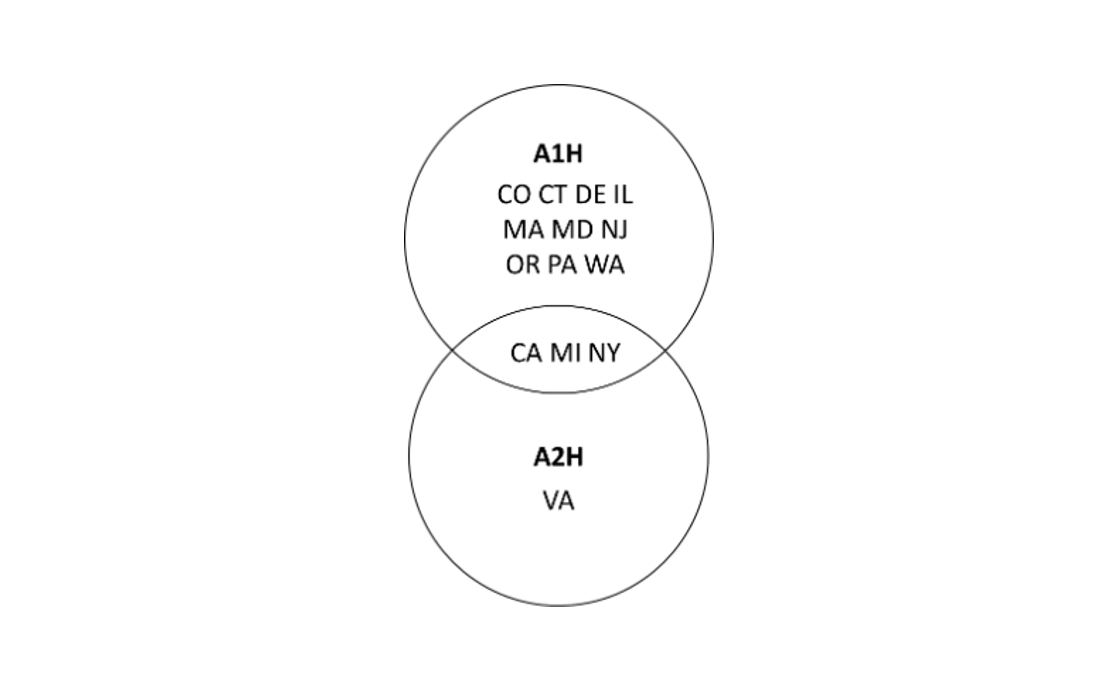
In describing these configurations, we provide Venn diagrams to show the relationships between groups of states. In these diagrams, the size of each circle or ellipse is representative of degree of coverage of the configuration within the overall solution, so a larger circle indicates greater coverage and explanatory power in the model.
Analysis of not-passed bills
The “Not-Passed” solution—that is bills that are currently either active or failed—has four configurations. The first and strongest configuration (P1L) is a weak entrepreneurial ecosystem (Business Profile), which suggests that when industry does not demand governance, there is little pressure to advance complex AI bills, as fewer tech-oriented stakeholders mean less expert testimony, fewer bill sponsors, and lower policy priority. Under these conditions, legislatures may recognize risks but lack “external pressure” to move bills to passage.
The second strongest configuration (P2L) focuses on a low human capital workforce, which suggests that states with low levels of advanced education, STEM skills, tech workforce concentration, or knowledge institutions tend not to pass AI bills. In such settings, legislative bodies have fewer local experts to consult, so risk assessment and policy design become harder due to knowledge gaps. As a practical manifestation of this, these states tend to have smaller or less active AI committees in the community, so the legislatures have fewer resources to consult as well as fewer groups to pressure them.
Practically speaking, these first two configurations conceptually overlap as they both speak to low external capacity preventing progress, so that bills remain active primarily because lawmakers lack the capacity to refine or advance them.
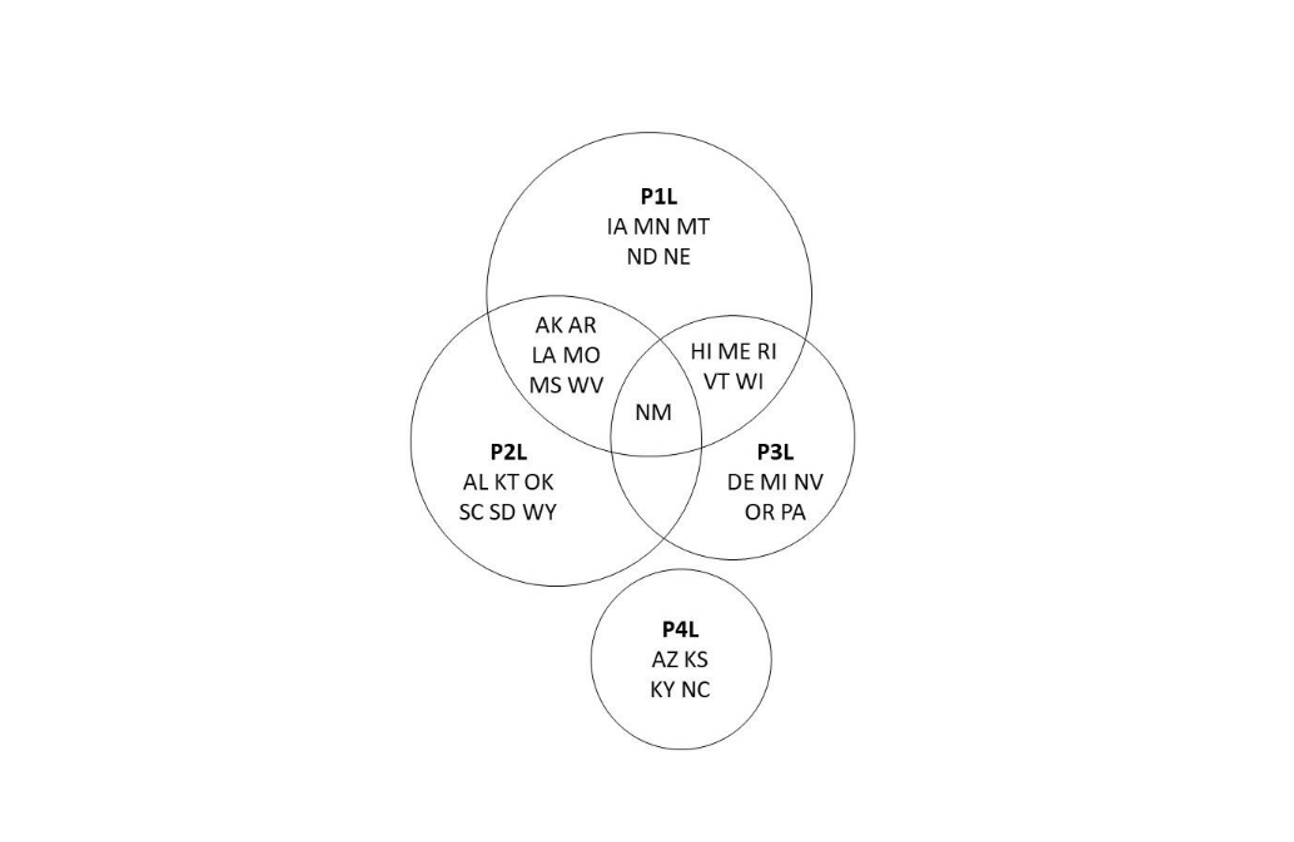
The third configuration (P3L) represents high-income states with a Democratic-leaning electorate. Despite these states having resources and a supportive electorate, bills still fail to pass. We speculate that this is because these innovation-heavy states may host powerful tech industries resistant to regulation. In essence, while the Democratic base may favor protective regulations, the tech industry may persuade legislators to slow or stall such bills.
Finally, the weakest but most unique configuration (P4L) hints at a politically contested state with executive-legislative branch mismatch, where a Democratic governor and a Republican-leaning public and legislature may freeze AI bills, as committees may gatekeep or prevent executive priorities from moving forward. In these cases, the Republican legislature may stall AI bills proposed by the Democratic governor to avoid giving them a political victory. As a result, these bills become more symbolic than actionable.
Analysis of not-failed bills
The “Not-Failed” solution (bills that are active or passed) has three configurations. The first and strongest configuration (F1L) includes a Democratic governor who is likely more open to AI regulation and expansion than their Republican counterparts, shielding bills from being voted down, which, while not necessarily guaranteeing passage, may protect them from formal termination. Indeed, there appears to be a concentrated push in states with Democratic governors to lean into AI regulation.
The second configuration (F2L) sees weak human capital in states with low STEM capacity and fewer high-tech workers, so there is a lack of expertise to refine bills, leading committees to procedurally stall and leave bills in limbo. In short, there is little appetite for the state to pass bills that are not highly relevant to its citizens.
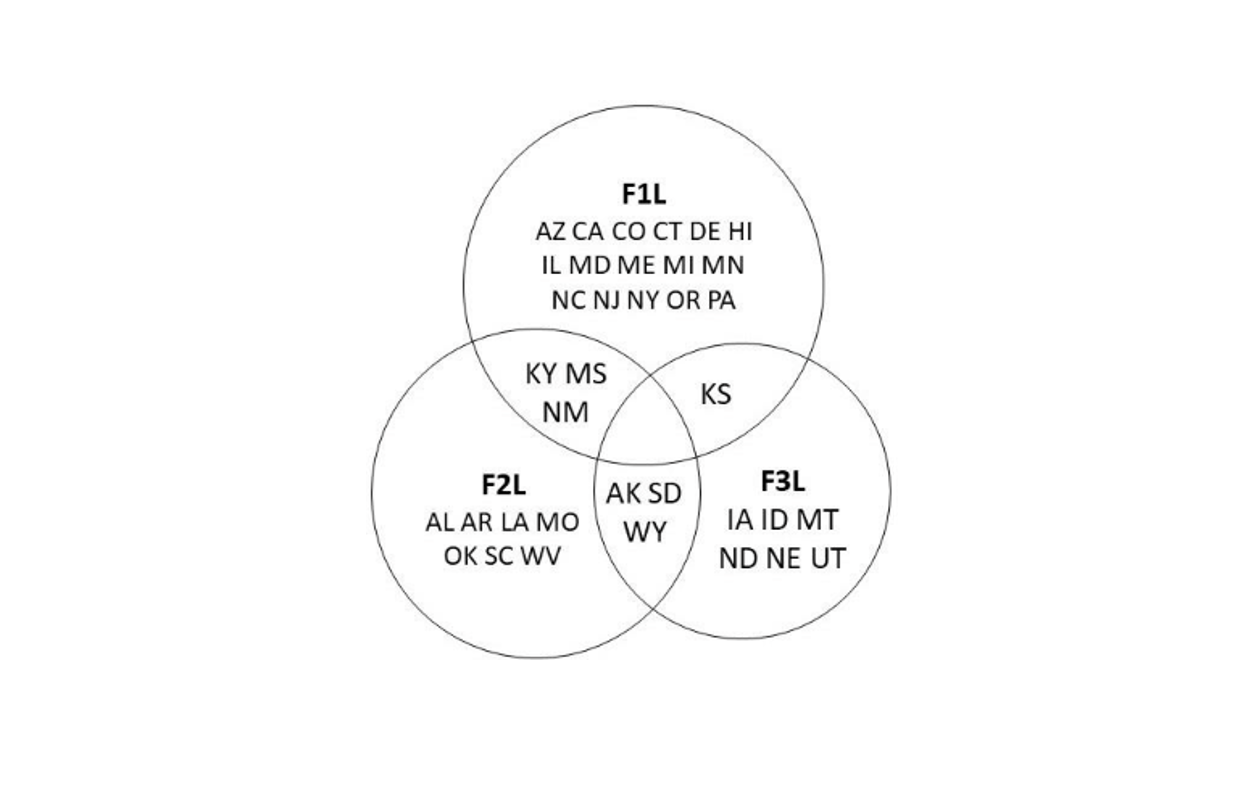
The last and weakest configuration (F3L) combines high poverty reduction with a Republican-leaning electorate, suggesting these conservative states with strong administrative competences may manage bills carefully, avoiding outright failure by keeping them under review. These bills are not prioritized for ideological reasons, so they languish but are not killed outright to avoid negative optics. These configurations suggest how bills avoid termination, either through politically motivated shielding of bills or similarly motivated stalling of them, with capacity and ecosystem playing supporting roles.
Active bills analysis
The “Active” solution (bills that are still in process) has two configurations of approximately equal coverage. The first configuration (A1H) sees a strong entrepreneurial ecosystem (Business Profile) in a Democratic state with a Democratic governor. There is likely a tension at work between the political motivation to protect the public from AI and the strong business drive to minimize regulation. This tension may keep many bills in play for extended periods.
The second configuration (A2H) sees lower poverty reduction in a Democratic state with strong human capital than states with high STEM capacity and many high-tech workers. This suggests a different tension between having a well-paid and technologically advanced workforce in a Democratic state with high income inequality, where ideological concerns over misuse of AI can come into conflict with the equally strong political desire to see highly lucrative industries thrive.
Summary
Richer states see more failed AI bills and higher failure rates, paralleling our earlier findings that wealthy states generate more legislative activity overall. However, we find that the large influx of bills increases legislative congestion, stakeholder contestation, and technical complexity, resulting in more bills stalling before passage. This finding reflects a counterintuitive but well-known capacity phenomenon that high-capacity states are prolific innovators, but innovation volume generates more failures at early stages.
More highly educated states experience more failures and higher failure rates. We find that highly educated states tend to introduce more ambitious, more complex, and more technically demanding legislation, leading to stakeholder fragmentation, technical drafting challenges, and greater scrutiny from industry, academia, and civil society. As such, while education level increases experimental policy volume, it does not necessarily result in legislative completion.
States with stronger business ecosystems experience fewer AI bill failures. A robust business ecosystem provides industry experts who help improve legislative design, collaborative relationships that reduce opposition, and institutional stakeholders who support or refine AI bills. As such, businesses act as policy co-producers, helping to reduce failure by reflecting the notion that industry-government-university collaboration improves policy implementation, even in emerging technology areas.
States that have successfully reduced poverty have fewer failed AI bills. Poverty reduction signals lower social fragmentation, reducing policy contestation, competing social priorities, and legislative overload. In these states, fewer groups push conflicting priorities, making AI governance easier to complete once begun.
Overall, there are clear pathways to successful bill introduction and eventual bill passage, but these differ based on the characteristics of the state. By having a clear understanding of what leads to bill passage, elected officials can tailor their own bills to the unique characteristics of their state. When the 2026 legislation sessions conclude, we plan to replicate our analysis to see how the regulation and legislation has matured and in which direction it is headed.
Related Content


Authors


The Brookings Institution is committed to quality, independence, and impact.
We are supported by a diverse array of funders. In line with our values and policies, each Brookings publication represents the sole views of its author(s).