INTRODUCTION
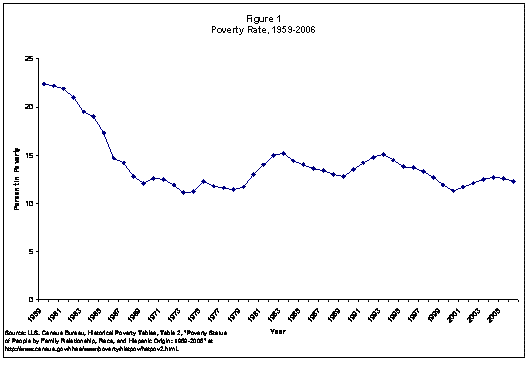
Consider the surprising lack of progress against poverty since the early 1970s. Figure 1 shows that poverty fell precipitously during the 1960s, rose slightly for a few years, and then fell to its lowest level ever, a little over 11 percent, in 1973 and 1974. Over the next three decades and more, poverty moved up and down in rough correlation with the economy, but never again approached the low achieved in the mid-1970s.
This lack of progress is especially surprising in view of the tsunami of government means-tested programs and the blizzard of spending on these programs (Figure 2). As the breadth of these programs expanded – eventually to include cash, medical, nutrition, housing, social services, and other categories of programs – and spending grew as measured in constant dollars, as a percentage of all federal spending, and as a percent of GDP, the nation made no progress against poverty. If anything, there was a slight increase in poverty over the entire period between early 1970s and 2006. Why?

Additional Papers presented at the Poverty Reduction Strategies for the Next Decade event:
Poverty Reduction Strategies for the U.S. »
by Mary Jo Bane
Poverty and Philanthropy: Strategies for Change »
by Gordon Berlin
High Priority Poverty Reduction Strategies for the Next Decade »
by Rebecca M. Blank
Three Policy Options for Reducing Poverty in the U.S. »
by Wade F. Horn
Policies To Require and Enable Less-Educated Noncustodial Parents To Work And Provide Financial Support For Their Children. »
by Ronald B. Mincy
The Next Time Around: Some Thoughts on Poverty Policy in the Next Administration »
by Katherine S. Newman
Reducing Poverty Four Key Policy Areas that Need More Policy and Foundation Attention »
by Sharon Parrott
Growing Together: New Poverty Policy for New Times »
by Manuel Pastor
The Brookings Institution is committed to quality, independence, and impact.
We are supported by a diverse array of funders. In line with our values and policies, each Brookings publication represents the sole views of its author(s).


