Editor’s note: In this blog, John McArthur and Christine Zhang highlight six facts on child survival since the launch of the Millennium Development Goals. For a more detailed look at the decline of child mortality rates, read McArthur’s latest paper, Seven Million Lives Saved.
When considering the achievements of the Millennium Development Goals (MDGs), people often wonder how much progress would have happened anyhow, and how much was actually due to the Goals? The query came up again recently when the UN’s annual child mortality data release and accompanying report stressed that 100 million more children would have died since 1990, the MDG baseline year, if mortality rates had remained unchanged.
Global under-5 mortality rates have indeed dropped by nearly half since 1990, which is cause for celebration. But as the world approaches the MDGs’ 2015 deadline, a deeper question is: how and where have trajectories changed, and what progress would likely have happened in any case? Moreover, how much of the overall global progress is simply due to rapid development in China and India, which together account for nearly 45 percent of the developing world’s population?
It is not possible to obtain precise answers to questions of MDG causality, since the world itself cannot be randomized. But it is possible to frame a variety of quantitative tests that can inform overarching assessments of progress. The simplest test – one that is hugely important – is the formal achievement of MDG targets. But a variety of additional tests help provide a deeper understanding of what has happened since the MDGs were established. We worked together on a study released last week, “Seven Million Lives Saved: Under-5 Mortality Since the Launch of the Millennium Development Goals,” which approaches these questions with regard to MDG4– the goal to reduce the under-five mortality rate by two-thirds between 1990 and 2015–from a variety of angles. This is what we found:
1. At least 7.5 million extra children’s lives have been “saved” since the launch of the MDGs
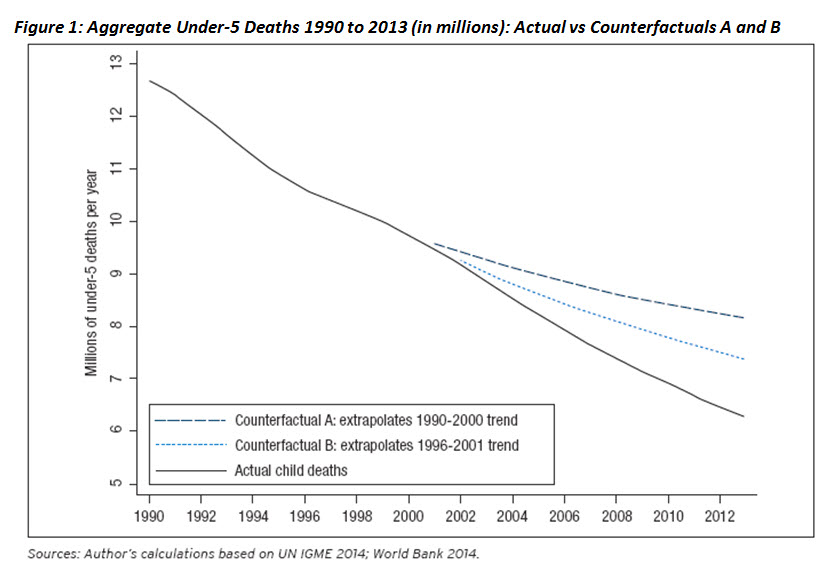
The paper considers two counterfactual trajectories for assessing recent under-5 mortality (U5MR) trends. One is the average rate of progress from 1990 to 2000, the decade leading up to the UN Millennium Summit. We call this “Counterfactual A.” A second considers average progress from 1996 to 2001, recognizing that many countries were already starting to do better in the late 1990s, and MDG efforts only got going in earnest during late 2001 and early 2002. We dub this more conservative trajectory “Counterfactual B.”
Figure 1 below compares the two counterfactuals to the actual UN data trends reported since 1990. Under Counterfactual A, 13.7 million more children would have died from 2001 to 2013. Under Counterfactual B, 7.5 million more children would have died from 2002 to 2013. Note that a straight diagonal line actually represents accelerating progress, since a constant rate of progress would show a flattening curve over time. To illustrate, cutting something by half every year would show smaller absolute differences from each year to the next – from 100 percent in year 1, to 50 percent in year 2, to 25 percent in year 3, to 12.5 percent in year 4, to 6.25 percent in year 5, and so on.
2. China and India account for less than a quarter of the estimated lives saved
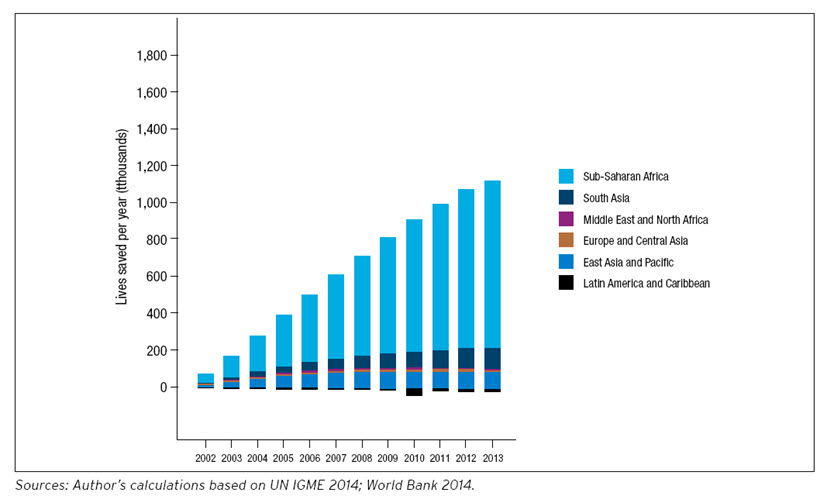
Although China and India have been responsible for a large share of the global reduction in extreme poverty in recent decades, they only account for a small fraction of the total estimated “lives saved.” Under Counterfactual A, China and India account for only 22 percent of the cumulative total, and under Counterfactual B they account for only 18 percent. In fact, as shown by Figure 2, the great majority of the lives saved have been in sub-Saharan Africa. The region accounts for fully 71 percent of the aggregate lives saved under Counterfactual A and 78 percent under Counterfactual B. As a footnote, both China and India saw accelerated progress in child survival during the 2000s – implying that even in these two countries the advances were not simply “happening anyhow.”
Figure 2: Counterfactual B – Incremental lives saved per year compared to U5MR trends from 1996-2001
3. As of the early 2000s, countries with high mortality no longer experience slower progress
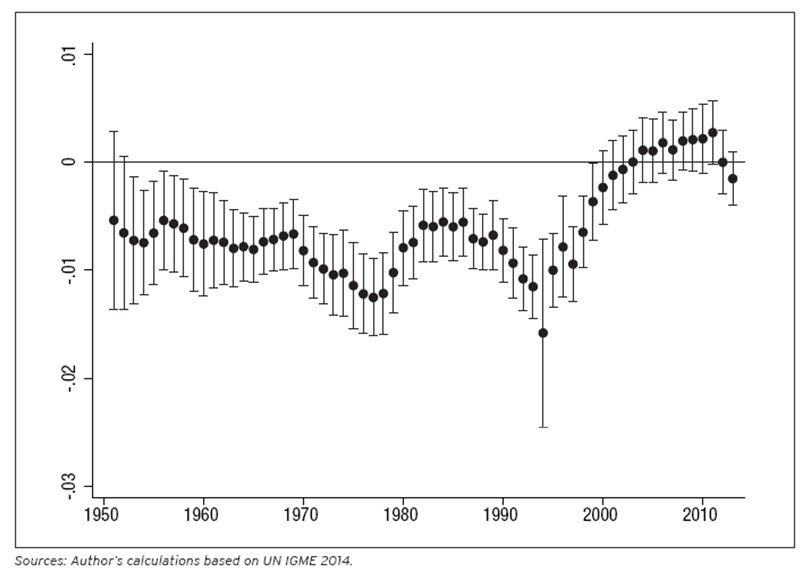
Using the UN’s historical data going back to the 1950s, our findings suggest there was a structural change in long-term progress patterns as of the early 2000s. A trend of “unconditional convergence” would show countries with higher beginning mortality experiencing faster rates of progress, and catching up to countries with lower beginning mortality. We conducted statistical tests for this pattern across several decades. A positive relationship between initial U5MR and rates of progress would imply “convergence” (higher initial U5MR being associated with higher rates of progress), while a negative one would imply “divergence” (higher initial U5MR being associated with lower rates of progress).
The evidence is presented graphically in Figure 3, where the dots represent the regression coefficient, or the strength of the relationship between initial U5MR and rates of progress, and the bars represent the margin of error for estimating that coefficient, 19 times out of 20. The bars are fully below zero from the 1950s to the 1990s, implying a negative statistical relationship. This is evidence of cross-country “divergence” in health outcomes, meaning a growing proportionate U5MR gap between higher beginning mortality (generally poorer) and lower beginning mortality (generally richer) countries. But then, as of 2000, there is no longer a statistical difference in rates of progress across initial U5MR levels, meaning consistent rates of progress for all countries, regardless of starting U5MR.
As of 2004, the coefficient dots cross above the zero line, becoming positive (if not statistically significant) for several years. This positive relationship falls just short of statistical significance in 2011, which would imply a transition to cross-country convergence in U5MR. However, a drop in 2013, though still not statistically significant, suggests that the recent decade’s global improvements should not be taken for granted.
Figure 3: Regression Coefficient and 95% Confidence Interval for Initial Under-5 Mortality Rate in Year-to-Year Test for Unconditional Global U5MR Convergence, 1951-2013
4. Africa’s progress is matching the rest of the world – for the first time.
Another exciting finding is that the period since the launch of the MDGs includes the first time in the data that sub-Saharan Africa has not, on average, been lagging the rest of the world in child mortality declines. Figure 4 below plots the African regional coefficient when added to the same basic cross-country statistical test described above – in other words, Africa compared to the global average.
Figure 4: Regression Coefficient and 95% Confidence Interval for Sub-Saharan Africa Regional Variable in Year-to-Year Test for Unconditional Global U5MR Convergence, 1951-2013
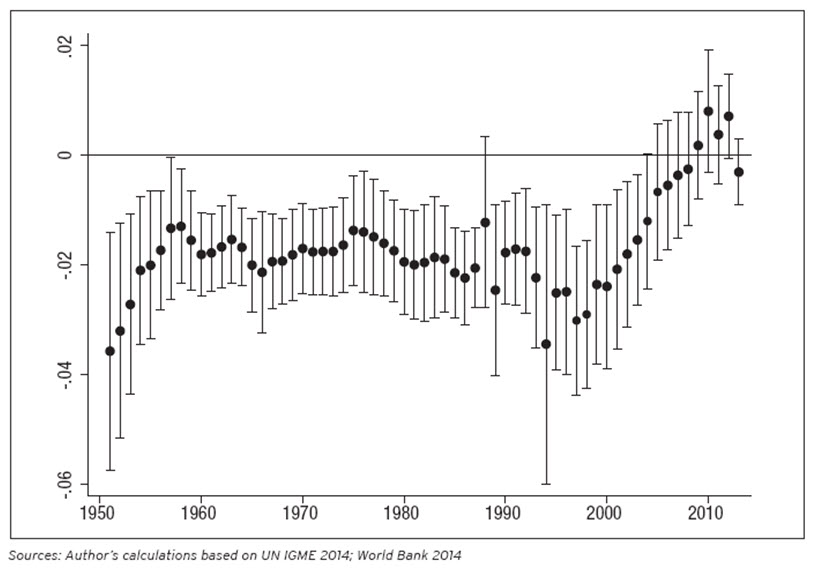
From 1951 to the early 2000s, Africa’s progress is slower than the global average. But then, starting in the early 2000s, the gap begins to narrow and from 2004 onward Africa’s rates of progress are statistically indistinguishable from the rest of the world. However, the drop in 2013 indicates a possible slowdown that year, and provides yet another reminder of the fragility of recent upward trends.
5. Initially “Off Track” and low-income countries saw the greatest acceleration in progress.
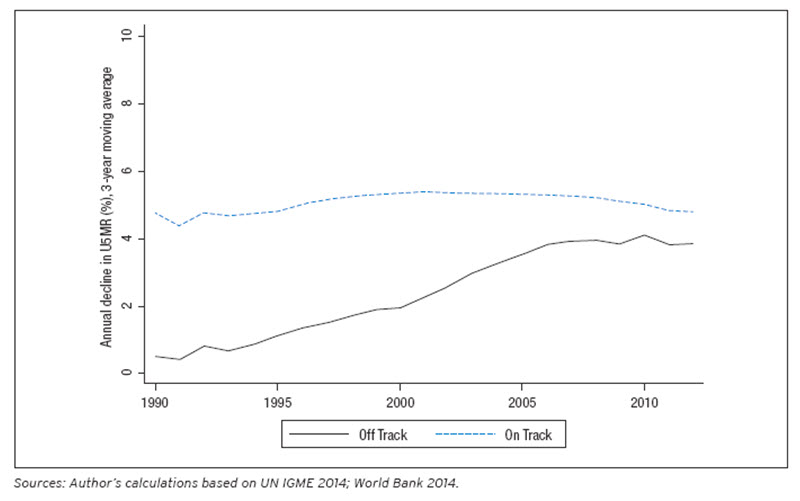
At the turn of the millennium, the top aim of the MDGs was to stimulate progress in countries which were grappling with extreme poverty and struggling to achieve development gains. So a good way to measure acceleration trends across countries is to look at initial country income groups and also whether countries were “On Track” or “Off Track” to achieve the MDGs at the outset. For example, the acceleration of progress in an Off Track country initially making no progress should ultimately be evaluated differently than an acceleration (or even “stagnation”) in a country already making the world’s fastest improvements. Figure 5 below shows that initially On Track countries have held a steady average rate of progress in recent years, and that much of the global gain has been achieved by those countries which would have initially been deemed Off Track.
Figure 5: Weighted Average Annual Reduction in Under-5 Mortality Rates, 1990-2012, by Developing Country MDG “On Track” vs “Off Track” Status as of 2001 (3-year moving average)
Equally important, Figure 6 shows that, after excluding China and India, countries that were considered low-income at the beginning of the MDGs have caught up to middle-income countries’ average rate of progress. The low-income countries have also jumped ahead of the high-income countries rates of progress, which have slowed down considerably.
Figure 6: Weighted Average Annual Reduction in Under-5 Mortality Rates, 1990-2012, by Country
Income Group as of 2001 (3-year moving average)
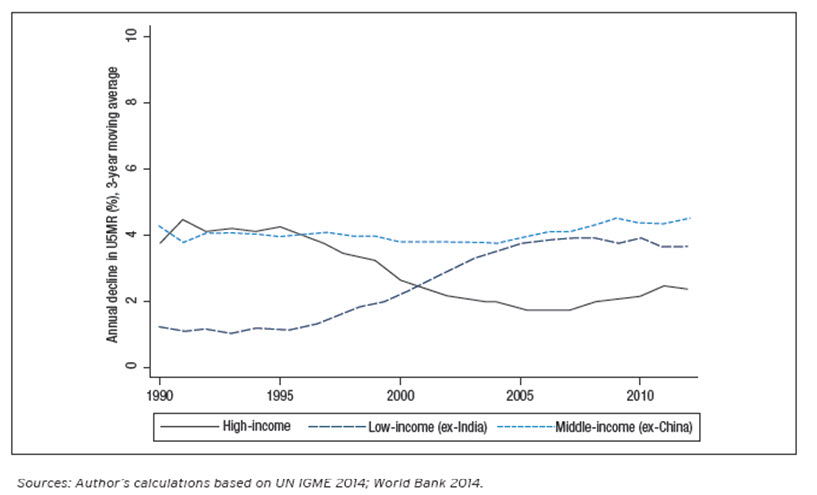
One key implication of these graphs is that there seems to have been a global convergence in rates of progress, even if full cross-country convergence in U5MR outcomes has not yet begun. Another implication is that while low-income countries have seen tremendous aggregate improvements since the launch of the MDGs, middle-income countries have only seen consistent rates of progress. This might offer insight into why some middle-income country governments have been less enthusiastic about the MDGs. On average, the group of countries was already making good progress, and the MDGs do not seem to have helped boost their overall rates of improvement.
6. Many Countries Not on Course to Achieve the MDG are Achieving the Greatest Gains
The paper’s exploration of structural changes in progress forms a complement rather than substitute to basic tests of MDG performance. To that end, three binary tests help illustrate results, as summarized in Tables 1 and 2. A “highest” test measures MDG target achievement; a “medium” test tracks against the annual rate of progress (4.3 percent) that would have counted as On Track as of 2000; and a “minimum” test checks whether countries have at least accelerated progress.
Table 1. Tests of MDG Success in Reducing Child Mortality: Comparing “On Track” vs “Off Track” Countries as of 2001
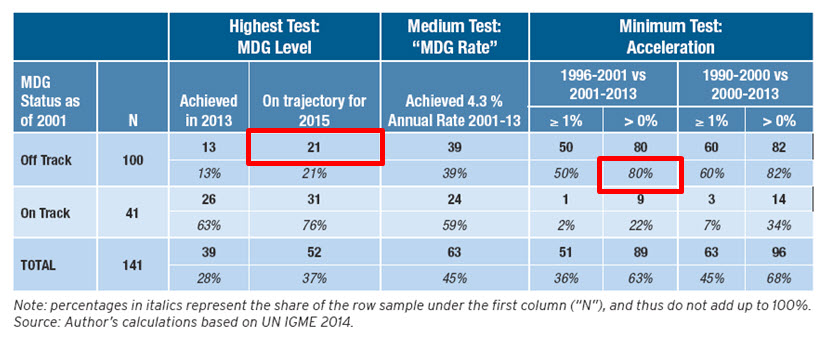
Table 2. Tests of MDG Success in Developing Countries’ Child Mortality Rates, by Initial Income Classification and Region
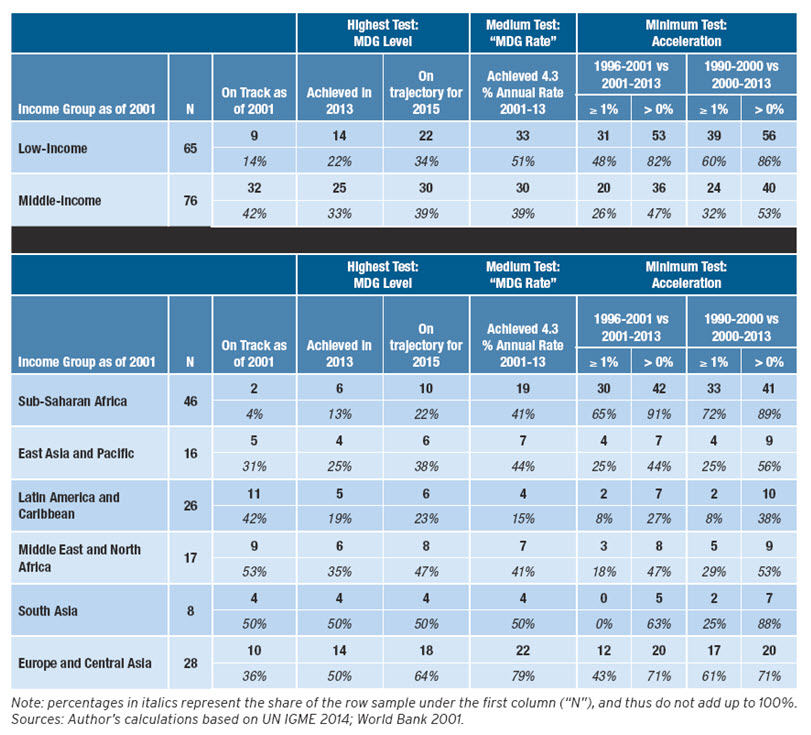
Table 1 shows that only 21 of 100 initially Off Track countries are on course to achieve the MDG. This is a huge victory for those countries, but an arguably more fundamental result is that 80 percent of that group saw acceleration, implying that much of the underlying progress is occurring in countries not on track to achieve the target. The regional breakdowns in Table 2 also show that the vast majority of countries in Africa saw accelerated progress, even if only 10 are on course to achieve the MDG target. At the other end of the spectrum, Latin America and the Caribbean started the MDG period with much higher average rates of progress but saw a slight slow-down over the ensuing years.
What Does It All Mean?
The results provide helpful reference points when considering post-2015 successor goals. They cannot provide conclusive proof of MDG success, but they do suggest that efforts to achieve MDG 4 were coincident with unprecedented global gains.
The Brookings Institution is committed to quality, independence, and impact.
We are supported by a diverse array of funders. In line with our values and policies, each Brookings publication represents the sole views of its author(s).


Commentary
Six Things to Know About Child Survival Since 2000
September 29, 2014