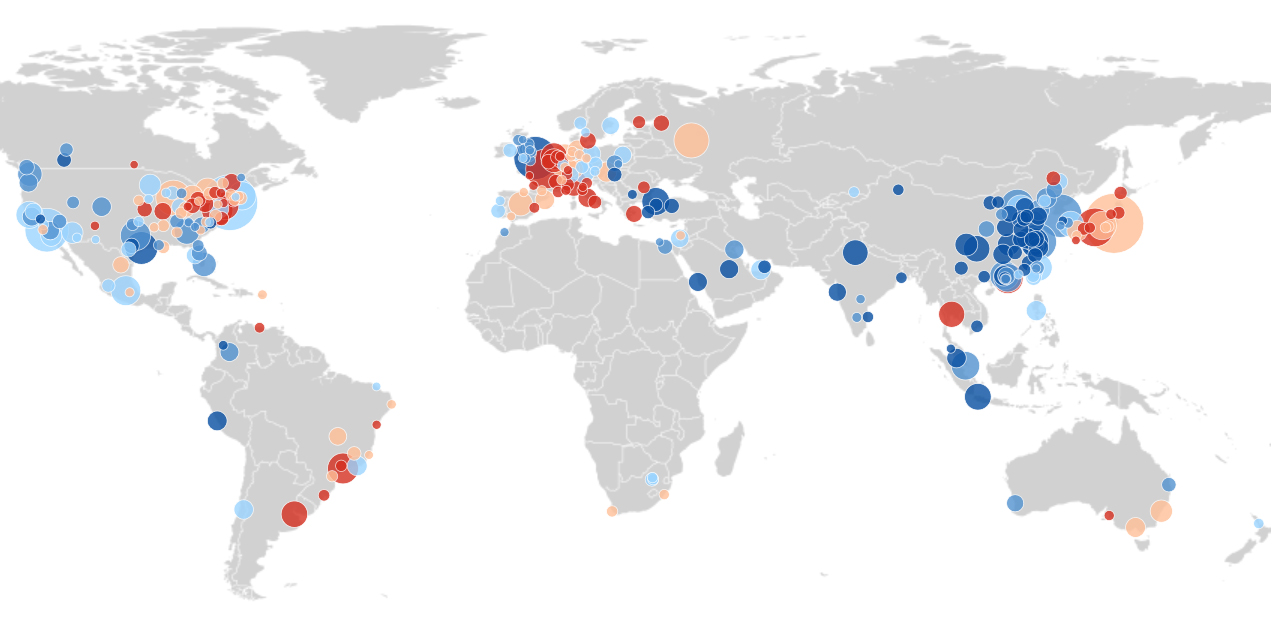
With only 20 percent of the population, the world’s 300 largest metropolitan economies accounted for nearly half of global output in 2014. This interactive and report compare growth patterns in the world’s 300 largest metro economies on two key economic indicators—annualized growth rate of real GDP per capita and annualized growth rate of employment. These indicators, which are combined into an economic performance index on which metro areas are ranked, matter because they reflect the importance that people and policymakers attach to achieving rising incomes and standards of living and generating widespread labor market opportunity.
· Read the Asia-Pacific Metro Monitor
Findings
Developing metro economies continue to be the sites of faster growth in 2014, further converging with their more developed peers. In an economic performance index combining employment and GDP per capita growth, developing metro areas accounted for 80 percent of the top performers, led by metro areas in China and Turkey. Six developed metro economies from the United States and United Kingdom were also among the top performers.
Metro areas continue to power national economic growth; most registered faster GDP per capita or employment growth in 2014 than their respective countries. A third of the world’s 300 largest metropolitan economies were “pockets of growth,” outpacing their national economies in both indicators, revealing that specific characteristics of metropolitan economies often differentiate their economic performance from that of their countries.
Sustained growth means that a majority of the world’s metro economies (60 percent) have recovered to pre-recession levels of employment and GDP per capita. At the other end of the spectrum, just over one-fifth of metro areas are “not recovered” in either indicator; 90 percent of this group is comprised of North American and Western European metro economies.
Metropolitan areas specializing in commodities registered the highest rates of GDP per capita and employment growth in 2014. Utilities, trade and tourism, and manufacturing specializations were also associated with higher growth. Metro areas with high concentrations of business, financial, professional services grew more slowly.
Authors


The Brookings Institution is committed to quality, independence, and impact.
We are supported by a diverse array of funders. In line with our values and policies, each Brookings publication represents the sole views of its author(s).