
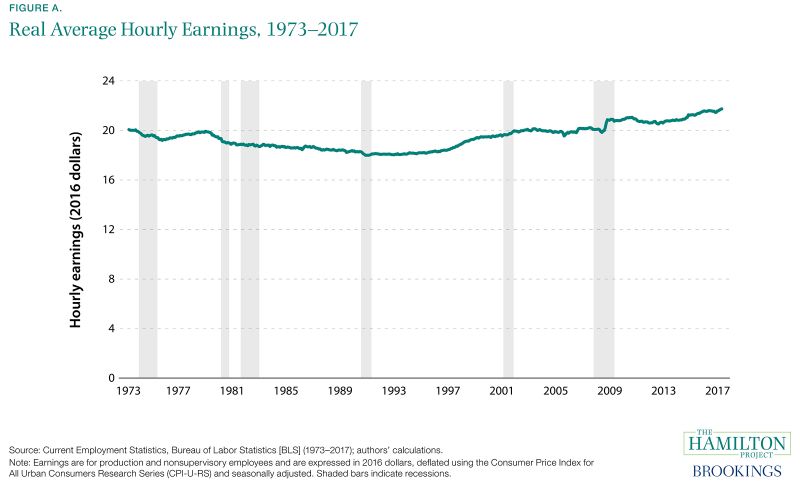
The expectation of rising living standards, with each generation doing better than the one before, has long been a given. More recently, that expectation has diminished—and with good reason. One of the best measures economists use to determine Americans’ economic advancement is whether wages are rising, broadly and consistently. After adjusting for inflation, wages are only 10 percent higher in 2017 than they were in 1973, with annual real wage growth just below 0.2 percent.1 The U.S. economy has experienced long-term real wage stagnation and a persistent lack of economic progress for many workers.
For more than a decade, The Hamilton Project has offered proposals and analyses aimed at increasing both economic growth and broad participation in its benefits. This document highlights the necessary conditions for broadly shared wage growth, trends closely related to stagnation in wages for many workers, and the recent history of wage growth, with an emphasis on the experience of the Great Recession and recovery. It concludes by discussing how public policies can effectively contribute to the growth in wages that is a core part of improving living standards for all Americans.
Full introduction
What is necessary for broadly shared wage growth?
The economic forces that underlie wage growth—that is, the increase in pay going to typical workers—essentially encompass all aspects of the economy. Wages depend on how productive workers are, the share of economic output that is channeled to compensation, and the division of wage and nonwage compensation (including benefits like health insurance). Workers’ productivity, in turn, depends on the human and physical capital used in the production process, as well as how efficiently labor and capital are used.
For the inflation-adjusted compensation paid to a typical worker to rise sustainably, a number of conditions must be met. Workers must become more productive over time. They must have adequate bargaining power such that their share of the returns to production remains stable or increases. And labor income has to be broadly shared, rather than concentrated at the top.
Figure A reflects the many economic forces that contribute to wage trends. Real wages fall over some periods because technological progress slows, capital investment weakens, nonwage benefits increase, or because labor receives a diminishing share of economic output. Over short horizons, wages can be influenced by simple supply and demand for labor: a weaker economy can yield insufficient demand for labor, generating weak wage growth. Also, unexpectedly high inflation can lead to steep drops in real wages, as in 1980, and unexpectedly low inflation can lead to an increase in real wages, as in 2009.
Box 1. What’s in a Wage?
A number of different concepts are often lumped together under the term “wages.” It can refer to cash earnings or total compensation, including benefits like health insurance. It can be measured at an hourly, daily, weekly, or annual frequency. In different contexts, one might refer to average wages or to median wages, with the latter corresponding more closely to the experience of a typical worker. Finally, wages can be expressed either in nominal or inflation-adjusted (real) terms, accounting for changes in prices.
Depending on the question that is being asked and the data that are available, we alternate between these various wage definitions in this document. When differences between the definitions are economically important, we highlight the distinctions and discuss their relevance. We generally emphasize real wages or compensation because they describe changes in the purchasing power of workers.
The Importance of productivity Growth
For workers to experience rising living standards over any substantial period, labor productivity must also rise. That is, for a worker to be paid more for an hour’s work, the value of that worker’s economic output must increase.
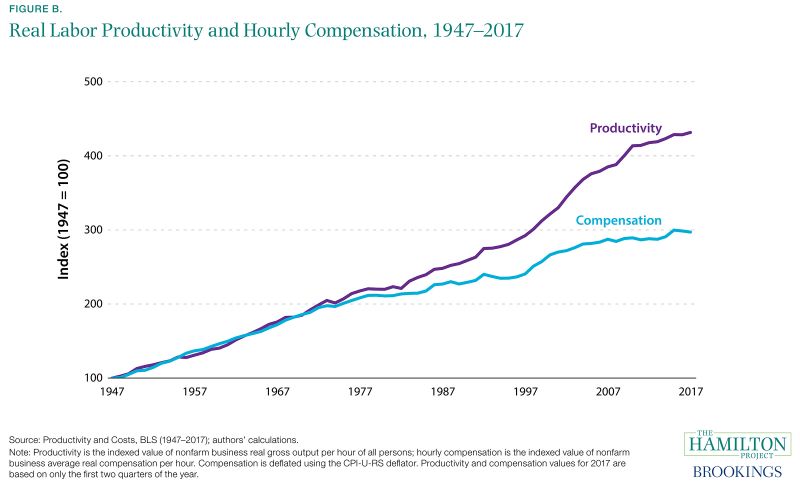
The history of the U.S. economy has been one of rising labor productivity, as shown in figure B. Technological advances, increases in human and physical capital, and improved business methods allow for dramatically more efficient uses of human labor as those advances and improvements accumulate over time.
Wages rise in the wake of these changes because firms compete with each other to hire and retain those workers who have become more productive. Figure B shows the increase in output per hour (productivity) and average compensation per hour—both adjusted for inflation—from the postwar period through the present. Both series have exhibited large increases over that period.
What economic and policy factors might reduce compensation growth by limiting worker productivity? In subsequent chapters, we explore a number of possibilities. First, worker mobility—both across jobs and across states—has been in decline for decades. In addition, business start-ups have become less common. These developments are associated with weaker increases in productivity and wages, given that they limit the reallocation of workers to productive new jobs. Finally, the recent decline in the growth of capital relative to labor depresses workers’ productivity.
Who benefits from productivity growth?
However, even robust growth in productivity is not always sufficient to ensure rising wages, particularly for workers at the bottom and middle of the wage distribution. Two considerations are most important.
First, the overall share of economic output that is received by workers can and does change over time. For example, if the share of output received as wages and benefits falls, real wage growth that would otherwise have occurred as productivity improved might diminish or even disappear completely. This dynamic affects workers as a group, rather than the distribution of wages received by various workers. Changes in worker bargaining power, competition within and across industries, and globalization can all influence the share of output workers receive. Over the long run, labor’s share of output has fallen, which is reflected in the fact that average compensation growth has lagged behind productivity growth (as depicted in figure B).2
Second, the inequality of wages paid to workers can also change over time. While workers as a whole might benefit from productivity growth over some period, these benefits are sometimes shared unequally. Indeed, real wages for those in the bottom half of the wage distribution have stagnated since 1979 (the earliest year in which appropriate data are available), whereas the upper reaches of the distribution have seen large gains. To the extent that labor’s gains disproportionately accrue to those with high incomes, gains for the typical worker will lag even farther behind productivity growth.
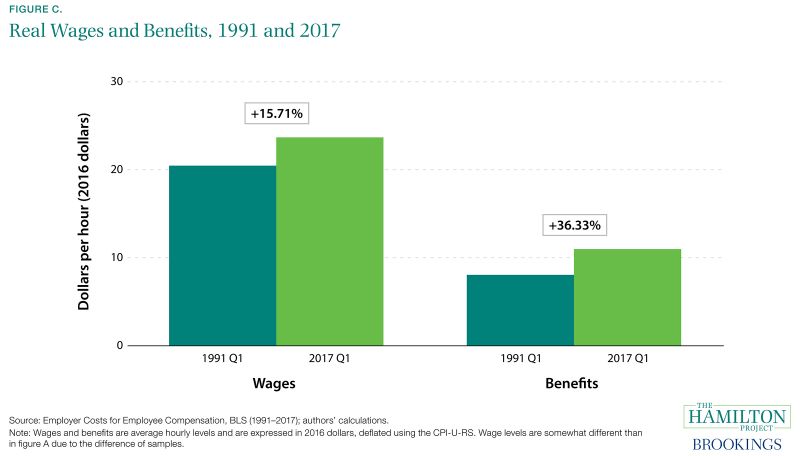
Finally, wages are only one component of compensation: nonwage components—such as health, life, and disability insurance, as well as retirement contributions—might take up a falling or rising share of compensation over time. To shed light on these trends, figure C shows growth in wages and benefits separately. While benefits have made up an increasingly large share of compensation, wage growth has lagged.
Economic and policy changes are both important for the division of economic gains. In the next chapter we explore the roles of technological progress, globalization, and changing returns to education in driving some of these wage trends over the long run. We also examine declines in the rate of union membership and the real minimum wage, focusing on how these developments have affected the level and distribution of wages.
Chapter 1: Why have wages been stagnant for so many workers?
Fact 1: The share of economic output workers receive has generally fallen over the past few decades.
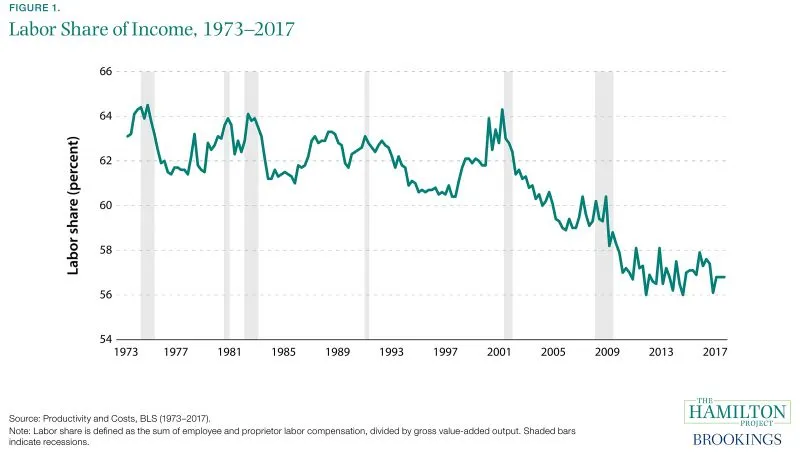
Long-term wage stagnation can be traced to many trends, including the decline in labor’s share of income. The portion of national income received by workers fell from 64.5 percent in 1974 Q3 to 56.8 percent in 2017 Q2. Over the past few years the U.S. labor share has ceased falling, but this might reflect the ongoing economic recovery rather than any change in the long-run downward trend.
The fall in labor’s share is not unique to the United States. In other advanced economies, it has also been falling since the 1970s. The declining labor share has been traced to both technological progress as well as to the increase in capital intensity of production (International Monetary Fund 2017; Karabarbounis and Neiman 2014). Analysis has suggested a number of other possible explanations for the United States, including the offshoring of labor-intensive production. A portion of the labor share decline is likely due to difficulty in measuring labor compensation (Elsby, Hobijn, and Sahin 2013; Smith et al. 2017).
One recent study suggests that the fall in the labor share is related to the rise of so-called superstar firms, which the authors argue are likely to have lower labor shares given their high profitability (Autor et al. 2017). Market concentration has increased noticeably over time and could be playing a role in lowering labor’s income share (Furman 2016).
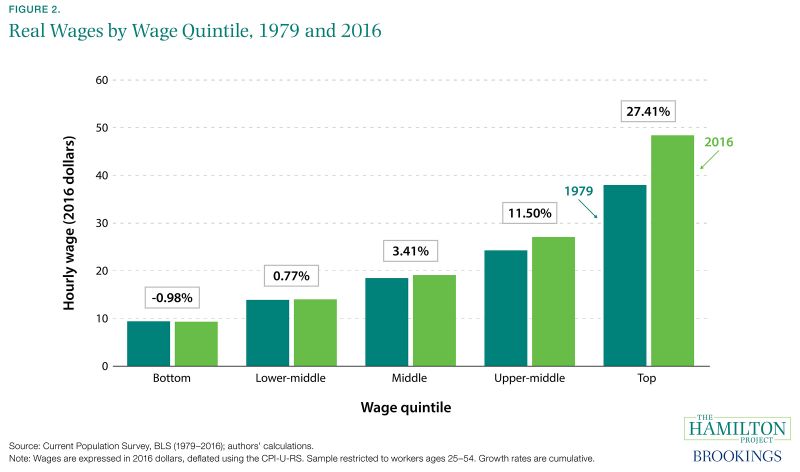
Fact 2: Wages have risen for those in the top of the distribution but stagnated for those in the bottom and middle.
Wage inequality has been on the rise over the past several decades. In figure 2 we examine wages rather than total compensation, which include nonwage benefits. (Compensation has also exhibited increasing inequality; see Pierce 2010.) This permits a sharper focus on wages, which are of particular interest to many workers.
Much of the growth in wages has been concentrated at the top, with wages in the top quintile growing from $38 per hour in 1979 to $48 per hour in 2016—a 27 percent increase. Wages in the upper-middle quintile increased by 12 percent, from $24 per hour to $27 per hour. In the bottom fifth, real wages fell slightly over the same period.
Recent research has shed light on how inequality is evolving between and within firms. For smaller firms, the rise in wage inequality has largely occurred across businesses, rather than within: some firms systematically pay higher wages than others. By contrast, wage inequality within the largest firms has increased considerably (Song et al. 2015).
Some researchers have tied increases in wage inequality to globalization (Haskel et al. 2012), while others have explored the role of technological progress (Autor, Katz, and Kearney 2008; Goldin and Katz 2010). Labor market institutions, discussed in fact 6, have also had important effects on the distribution of wages.
However, widening inequality has not always been a feature of the U.S. economy. As recent work by Piketty, Saez, and Zucman (2016) has shown, overall income growth (including both labor and capital income) was tilted toward the lower end of the distribution from 1946 through 1980. Incomes rose faster in the bottom half of the income distribution than in the top 10 percent or top 1 percent. Since 1980, that process has clearly reversed.
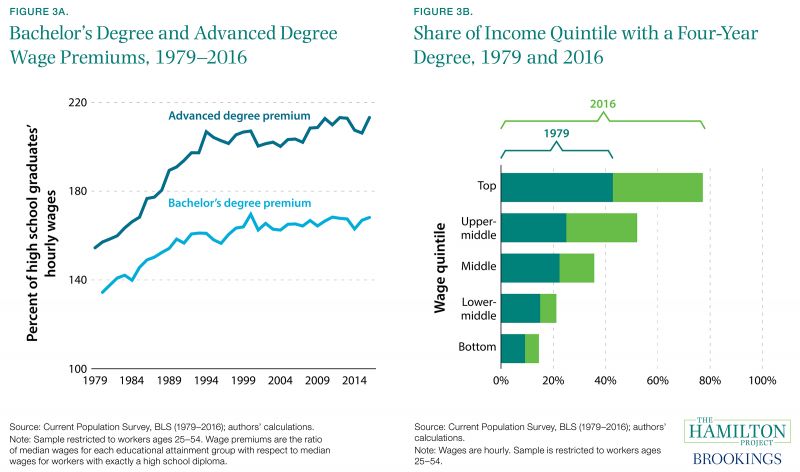
Fact 3: The education wage premium rose sharply until about 2000, contributing to rising wage inequality.
The wage benefit to a college degree increased remarkably during the last two decades of the 20th century, leveling off around 2000 at a historically high level (see figure 3a). Bachelor’s degree holders ages 25 to 54 in 1979 could expect to earn 134 percent of the wages received by those with only a high school education, and advanced degree holders could expect to earn 154 percent. By 2016 the wage premiums for a bachelor’s degree and an advanced degree had risen to 168 and 213 percent, respectively.
At the same time, the percent of workers with at least a four-year college degree also rose dramatically—from 23 percent in 1979 to 40 percent in 2016. As shown in figure 3b, workers across the wage distribution have become more educated, but the increases have been larger for those with higher wages. Workers with a college education are now the majority in the top two income quintiles: their shares doubled or nearly doubled from 1979 to 2016. By contrast, college-educated workers represent just 15 percent of the bottom quintile. These changes in college attainment and the college wage premium reflect an evolving mix of individuals attaining college degrees as well as shifts in the relative demand for high-skilled labor (Abel and Deitz 2014).
Because wages fell for those workers with only a high school diploma, the increase in educational attainment did not lead to sharply rising wages for the typical worker, despite the education wage premium and rising attainment. However, increasing educational attainment still further could have important economic payoffs. By one estimate, increasing men’s college attainment by 10 percent would eliminate nearly all of the decline in median annual earnings observed from 1979 to 2013 (Hershbein, Kearney, and Summers 2015).
Fact 4: Globalization and technological change have likely put downward pressure on less-educated workers’ wages.
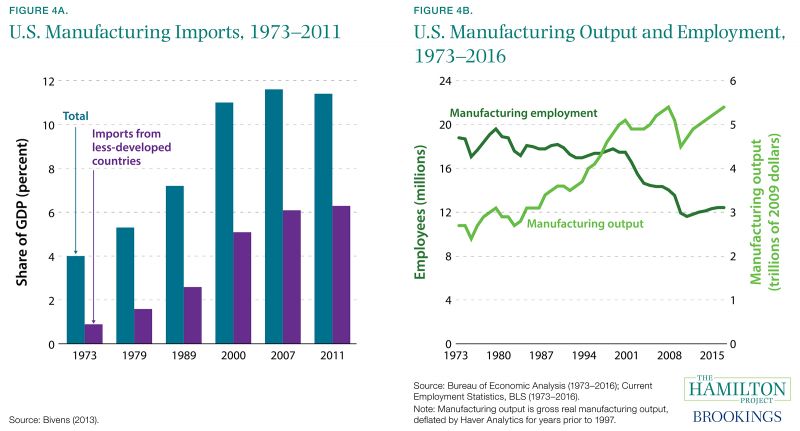
While theory and evidence suggest overall gains to an economy when opening to trade, some groups may suffer negative consequences. Basic trade theory implies that when a country with abundant capital and high-skill workers (like the United States) trades with a country abundant in low-skill labor, lower-skilled labor in the rich country will experience losses (Stolper and Samuelson 1941). As seen in figure 4a, the United States imports more manufactured goods today than in prior decades, an increasing share of which has come from low-wage countries. Recent work focusing on China’s entry into the world economy suggests that it resulted in manufacturing job losses in the United States, in particular during the steeper job losses after 2000 (Autor, Dorn, and Hanson 2016).
Of course, globalization has conferred a number of benefits for workers. Trade has lowered consumer prices, helping increase real wages; moreover, exports can be an important source of productivity and wage growth (Bernard et al. 2007). However, U.S. imports are more likely than U.S. exports to be produced by low-skilled workers (Katz and Murphy 1992; Borjas et al. 1997), suggesting that trade may put downward pressure on wage growth for low-skilled American workers.
While globalization plays a role, most research finds that it is not principally responsible for the decline in labor demand experienced by low-skilled workers (Helpman 2016). Technological change that raises the relative productivity of high-skill workers is another important factor (Goldin and Katz 2010; Autor, Katz, and Kearney 2008).
The manufacturing sector provides an example of how technological progress can affect particular groups of workers. As seen in figure 4b, U.S. manufacturing output has increased considerably since 1973—nearly doubling in 40 years—while manufacturing employment has fallen sharply. This increase in manufacturing productivity has been accompanied by a shift from low-skilled to high-skilled workers in the industry (Berman et al. 1994).
Globalization and technology have brought great gains to American workers as a group, but their benefits have been unequally shared. They have likely contributed to worsening labor market outcomes for low-skilled workers, helping to explain the stagnation in their wages.
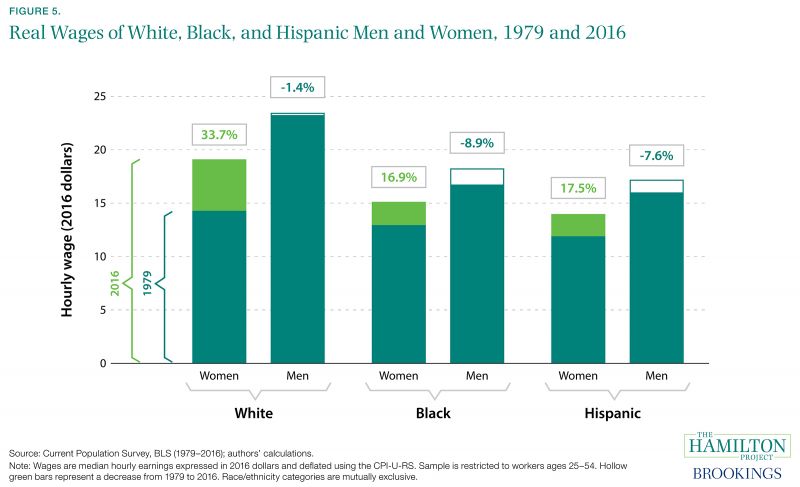
Fact 5: Wages have grown for women and fallen for men.
Wage inequality is closely linked to differences in earnings by gender and by race/ethnicity. In both 1979 and 2016, non-Hispanic white men earned more per hour than any other group. Relative to non-Hispanic black and Hispanic men, white men increased their advantage over that period. But within each racial/ethnic group, men’s wages have been stagnant or falling over time.
However, women have gained ground. White women have seen a wage increase of 34 percent, while black and Hispanic women have both experienced growth at around 17 percent. Women’s wage levels remain below those of men, but the gender wage gap has narrowed over time.
Much of this narrowing was driven by the increasing educational attainment of women. By the early 2000s, 25- to 54-year-old women had surpassed men in both four-year and advanced degree attainment (authors’ calculations; not shown). The segregation of men and women in different occupations—which accounts for some of the gender wage gap—diminished at the same time that more women obtained college degrees (Cortes and Pan forthcoming).
The gap in wages by race/ethnicity has proven harder to close. Labor market discrimination is an important part of this pattern (Bertrand and Mullainathan 2004; Charles and Guryan 2008), as are pre-labor market differences in the experiences of whites and people of color (Altonji and Blank 1999).
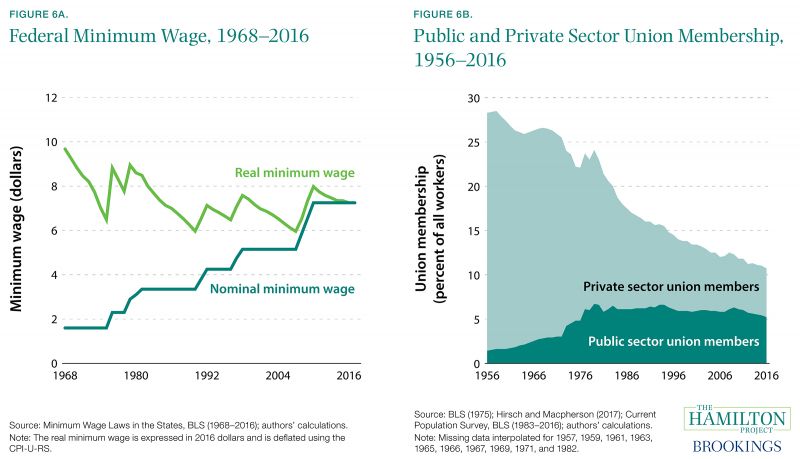
Fact 6: Declines in the real minimum wage and union membership have affected wage growth.
Although the increased demand for educated workers explains much of the rise in wages for workers in the upper part of the wage distribution, other factors account for wage stagnation among lower-income workers as well as the broader decline in the labor share of income.
One such factor is the decline in union membership. In 1956 about 28 percent of all workers belonged to a union; in 2016 that number was a little more 10 percent. This decline has occurred principally among private sector workers, only 5 percent of whom now belong to a union. With this fall in union membership has come an increase in wage inequality (Card 2001). The spread of other labor market institutions—such as noncompete contracts, and no-poaching and collusion agreements by firms—could also be contributing to weaker worker bargaining power.
In addition, decline in the real minimum wage has limited wage growth among low-wage workers. Autor, Manning, and Smith (2016) find that changes in the statutory minimum wage were one factor in explaining changes in the ratio of median wages and the 10th percentile of the wage distribution. Similar to the way that men were disproportionately affected by declining union membership (Fortin and Lemieux 1997), the falling real minimum wage in the 1980s disproportionately affected women, accounting for as much as half of the rise in wage inequality among women (Autor, Manning, and Smith 2016).
More recently, increases in state minimum wages appear to be raising wages at the bottom end of the wage distribution (Gould 2017). Raising the minimum wage could affect millions of workers with wages at or somewhat above the minimum wage (Kearney and Harris 2014).
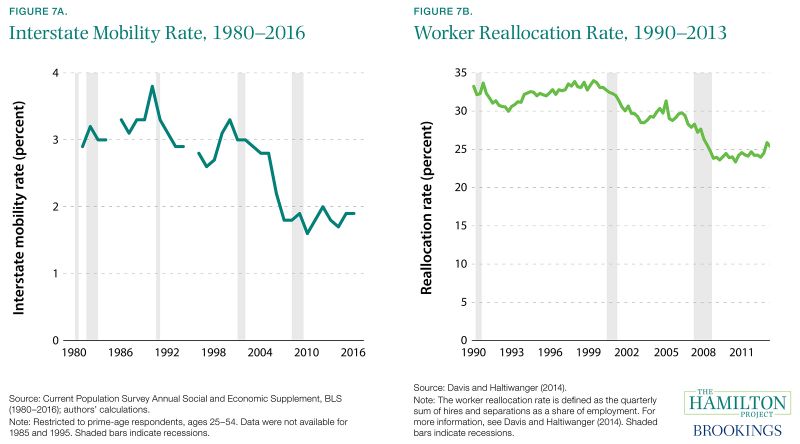
Fact 7: Workers have become less likely to move to a different state or to a different job, reducing wage growth.
In recent decades American workers have become less likely to move to new places and to new jobs. Since 1990, interstate mobility—defined as the percent of U.S. residents who move from one state to another in a given year—has declined by half, from 3.8 percent in 1990 to less than 2.0 percent in 2016 (see figure 7a). The labor market is a principal driver of migration, accounting for about half of interstate moves (BLS 1980–2016 authors’ calculations). Part of the explanation for the long-run decline in geographic mobility lies in economic diversification: as each region of the country attracts a wider range of industries, the regions become more alike, allowing workers to find jobs locally that they would have otherwise had to relocate to obtain (Kaplan and Schulhofer-Wohl 2017).
At the same time, workers are switching jobs less frequently and staying longer at the jobs they have. Figure 7b shows the decline in the worker reallocation rate, defined as the sum of hires and separations, both divided by total employment. After remaining approximately level through the 1990s, the rate subsequently fell by almost one-quarter. Worker reallocation rates have fallen for male and female workers, as well as for workers of all ages, education levels, and states of residence (Davis and Haltiwanger 2014).
Diminished worker mobility might have an important negative impact on workers’ wage growth. Under normal economic conditions, job-to-job mobility generates about 1 percent earnings growth per quarter. During recessions, this mobility declines and workers find it more difficult to climb the job ladder into higher-wage positions (Haltiwanger et al. 2017).
Public policy has likely contributed to the decline in both geographic and job-to-job mobility. Occupational licenses and noncompete contracts, for example, often hinder workers’ ability to pursue economic opportunity outside of their current state and employer (Starr, Bishara, and Prescott 2017; White House 2015). In addition, land-use restrictions that reduce new housing development contribute to a reduction in worker movement to high productivity areas, limiting both productivity and wage growth (Ganong and Shoag 2017).
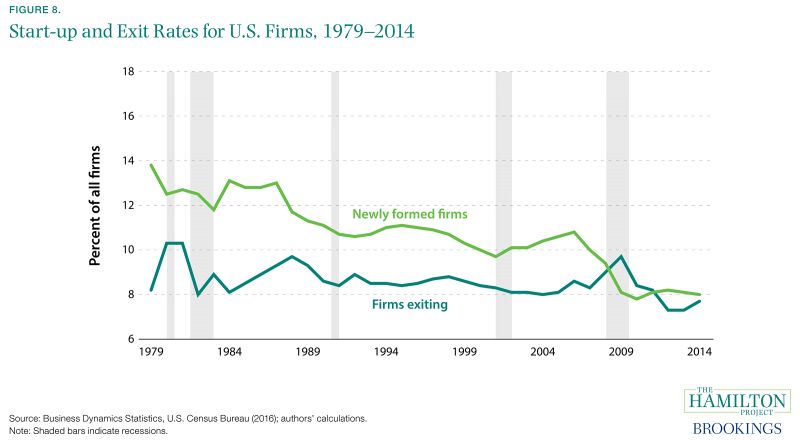
Fact 8: Business formation and closings have declined.
Over the past several decades, start-ups have become increasingly scarce, with their share of all firms falling from 14 percent in 1979 to 8 percent in 2014. At the same time, the rate at which businesses close down has declined slightly over the long run. Unsurprisingly, the Great Recession was a period of temporarily elevated business closings and depressed business start-ups.
Young firms now employ a smaller share of workers. Davis and Haltiwanger (2014) explain that the decline in young, fast-expanding firms has contributed to falling business dynamism and job churn.
More firms exited than entered during the Great Recession, and the typical firm’s age has continued to rise (Davis and Haltiwanger 2014). Researchers have linked the decline in the number of young firms to increased business consolidation and decreased rates of population growth (Hathaway and Litan 2014). The fall in start-ups and young firms has a negative impact on wages. Young firms tend to poach workers who are making job-to-job moves, which can help them to climb the job ladder and achieve stronger wage growth (Haltiwanger et al. 2017). As the average age of firms increases, job churn falls (Wiczer 2014), resulting in diminished economic growth (Lazear and Spletzer 2012).
Diminished dynamism can also impede the reallocation of resources to high productivity firms; recent research indicates that the decline in dynamism in the tech sector occurred at the same time as the decline in productivity growth (Decker et al. 2016). This lower productivity growth in turn restrains wage growth.
Chapter 2: How strong has wage growth been since the Great Recession?
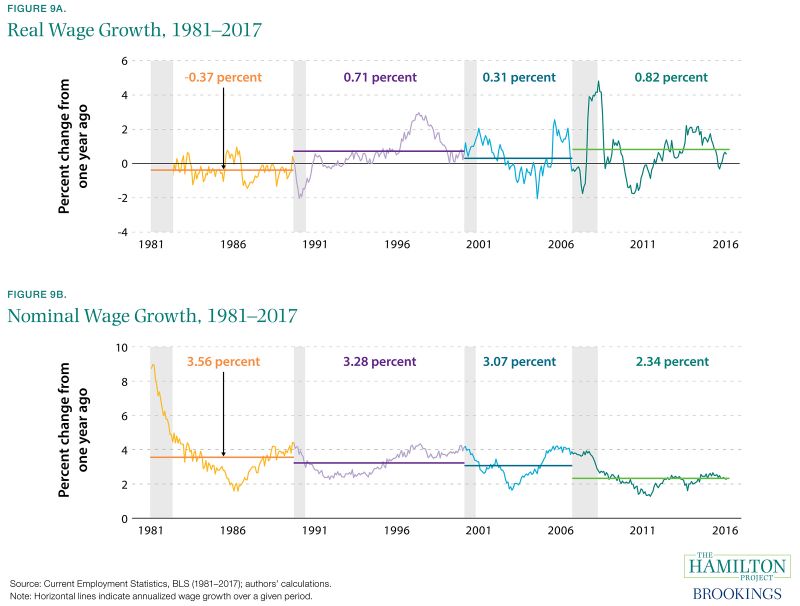
Fact 9: Inflation-adjusted wage growth was higher from 2007 to 2017 than it was during previous business cycles.
By comparison with the previous three business cycles, inflation-adjusted wage growth since 2007 has been relatively strong. It is slightly ahead of the growth seen during the 1990s or 2000s business cycles and is notably higher than growth in the 1980s. Figure 9a plots year-over-year growth in real average hourly earnings for production and non-supervisory workers, showing trend growth separately for 1981–90 (-0.37 percent), 1990–2001 (0.71 percent), 2001–7 (0.31 percent), and 2007–17 (0.83 percent). It is important to note that this recent real wage growth followed years of stagnation and has been accompanied by rising inequality, likely making it feel insufficient to many workers.
However, low inflation during this most recent period generates a starkly different story for nominal wage growth (i.e., wage growth without any adjustment for inflation). Figure 9b shows that nominal annual wage growth has been just 2.4 percent since the start of the Great Recession, contrasting with nominal wage growth above 3.0 percent in each of the previous business cycles.
Typically, nominal wage growth rises later in expansions and falls during recessions, while real wage growth may jump up or down with variation in inflation. But the most recent expansion has seen little uptick in nominal wage growth, especially in contrast to the previous three expansions.
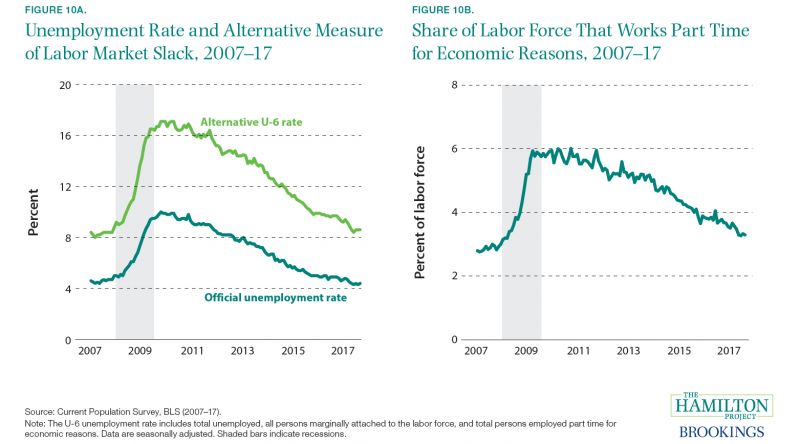
Fact 10: Labor market slack has declined during the recovery from the Great Recession, though some likely remains.
While in the long run real wage growth depends on productivity and the distribution of gains from productivity, over shorter time horizons wage growth can be determined by the supply and demand for labor. When there is extensive slack in the economy—such as during a recession or the early phase of a recovery, when labor and capital are underutilized—wage growth can be temporarily lower. At these times, there are more unemployed workers and hiring demand is low, both of which put downward pressure on wages.
The sizable slack in the U.S. labor markets early in the Great Recession likely put substantial downward pressure on wage growth for a number of years. By many measures, labor market slack is now at roughly its prerecessionary level. The unemployment rate was 4.3 percent as of July 2017, with several states experiencing record lows. The alternative U-6 rate—a broader measure of unemployment that includes the unemployed, people working part time who would like full-time work, and those who would like a job but are not actively looking (marginally attached workers)—is also at its lowest level since the Great Recession. A number of other measures tell a similar story, including the rise in workers’ job quits, job openings rate, and the length of time required for firms to fill job vacancies (Yellen 2017). Still, there might be slack remaining in the labor market: the number of people working part time for economic reasons remains elevated relative to the precrisis period, inflation remains unusually low, and the employment rate of prime-age workers remains below its prerecession starting point.
Diminishing slack in the labor market generally means that employers must pay higher wages to attract workers (Krueger 2015). Wage growth for less-educated workers is particularly sensitive to changes in labor demand (Katz and Krueger 1999), but thus far the large reduction in slack has not been accompanied by dramatically higher nominal wage growth.
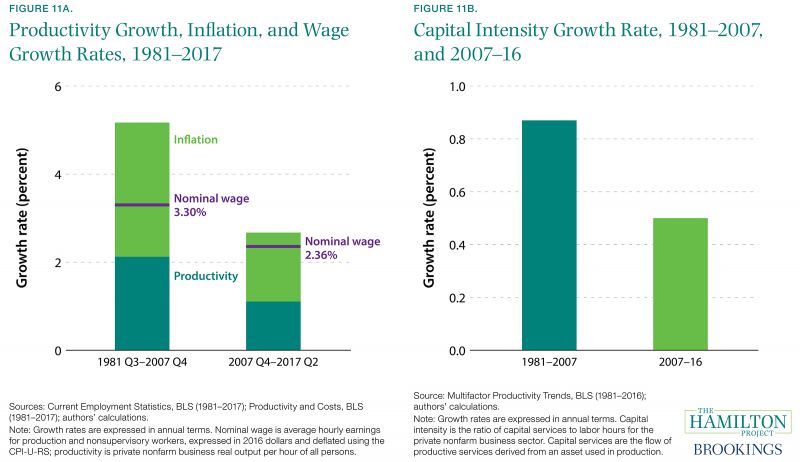
Fact 11: Recent labor productivity growth has been slow, restraining wage growth.
The period beginning with the Great Recession has been characterized by some of the weakest growth in labor productivity (1.1 percent annually) for a business cycle in the postwar era (Sprague 2017). However, this trend of reduced productivity growth emerged prior to the recession. Productivity growth began to slow in 2004, after the 1995–2004 technology boom, and has since slowed even more during the recovery from the Great Recession (Fernald 2015).
Given the importance of labor productivity growth for facilitating wage growth, the slowdown in productivity growth in the United States has likely had negative effects on workers. Figure 11a depicts real productivity growth, inflation, and nominal wage growth for the periods 1981–2007 and 2008–17. Wage growth from 1981 to 2007 clearly lagged behind inflation plus productivity growth, highlighting the fact that productivity growth is not always sufficient for wage growth. Lower productivity growth since 2007 could be limiting the upside to wage growth. As shown by the bottom portion of the stacked bars, real productivity growth fell from 2.1 to 1.1 percent. When added to inflation (the top portion of the stacked bars), this gives a sense of the maximum sustainable nominal wage growth rate.
Weak investment growth—as depicted in figure 11b—has played an important role. During the recovery from the Great Recession, growth in capital intensity (the ratio of capital services to labor hours) has fallen far short of historical norms, even contracting in 2011 and 2012. This means that workers have less capital to work with, which impairs their productivity and wages.
The reduction in capital investment growth is thought to be closely related to the broader slowdown in GDP growth (Council of Economic Advisers 2017 chap. 2; Furman 2015). As the economy continues to heal from the Great Recession, capital investment should increase, providing the foundation for sustained wage growth.
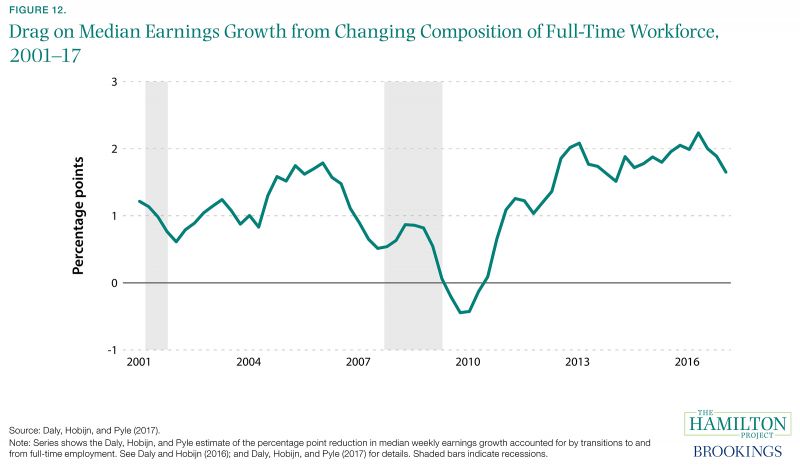
Fact 12: In recent years, measured wage growth has been depressed by changes in the workforce.
Measured wage growth reflects changes in wages for continuously employed workers as well as changes in the composition of the workforce. That latter component of wage growth evolves as workers of varying wage levels enter and exit employment. At any given time, those exiting employment might have wages that are quite different from (and typically higher than) the wages of those who enter, causing overall wage growth to differ from the wage growth of workers who were continuously employed (Daly and Hobijn 2016).
Figure 12 displays the drag on median weekly earnings growth from the changing composition of the full-time workforce. In normal times, entrants to full-time employment have lower wages than those exiting, which tends to depress measured wage growth. During the Great Recession this effect diminished substantially when an unusual number of low-wage workers exited full-time employment and few were entering (Daly and Hobijn 2016). After the Great Recession ended, the recovering economy began to pull workers back into full-time employment from part-time employment (see fact 10) and nonemployment, while higher-paid, older workers left the labor force.
Wage growth in the middle and later parts of the recovery fell short of the growth experienced by continuously employed workers, reflecting both the retirements of relatively high-wage workers and the reentry of workers with relatively low wages. In 2017 the effect of this shifting composition of employment remains large, at more than 1.5 percentage points.3 If and when growth in full-time employment slows, we can expect this effect to diminish somewhat, providing a boost to measured wage growth. Given that the gap has been roughly stable for the past five years, this composition effect does not explain the lack of pick-up in wages as the labor market has tightened, but rather helps account for the overall slow pace of growth in nominal wages during the entire recovery.
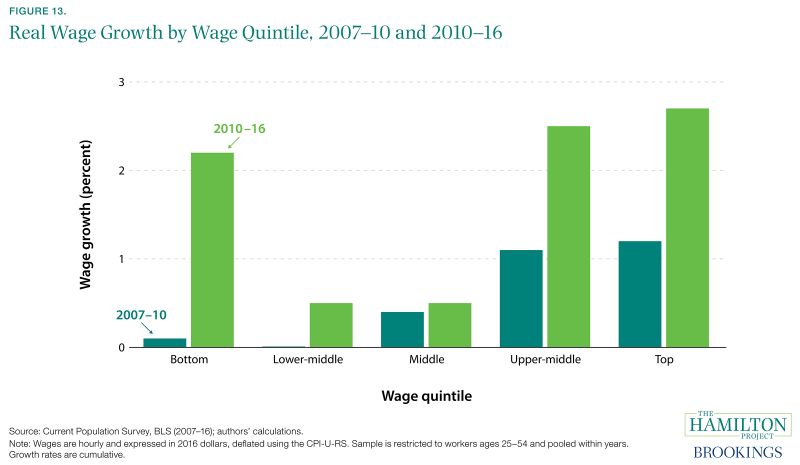
Fact 13: Wage growth during the Great Recession occurred among top earners, but has since become more broadly shared.
During the Great Recession workers with wages in the bottom three income quintiles—60 percent of all workers—experienced limited or no growth in their wages. For the top-earning 40 percent of workers, wages increased by more than 1 percent over the same period.
Since 2010, however, wage growth has accelerated for all workers, and particularly for the lowest-paid workers. One explanation for recent wage growth among low-wage workers is the legislated increase in the minimum wage in many states (Gould 2017). Comparing changes in state minimum wages from 2015 to 2016, Gould (2017) shows that workers in the 10th percentile experienced real wage growth of 5.2 percent in states that raised their minimum wage, compared to an increase of 2.5 percent in states that did not.
Despite the more rapid increase at the bottom of the income spectrum, along with continued growth at the top, wage growth for workers in the middle quintiles has continued to be sluggish. One possible factor limiting wage growth in the recovery is that, during the recession itself, wages were to some extent prevented from falling (e.g., by employee reluctance to accept wage reductions). If wage rigidities prevented wage cuts, employers might have limited raises during the recovery to rebalance (Daly and Hobijn 2015). However, as time passed after the end of the recession, the wage-dampening influence of this factor weakened.
Authors


-
Footnotes
- Cumulative real wage growth is sensitive to the particular method of inflation adjustment. Some researchers use the Consumer Price Index for All Urban Consumers (CPI-U) deflator, which implies even lower real wage growth, or the Personal Consumption Expenditures (PCE) deflator, which implies higher real wage growth (Bivens and Mishel 2015; Sacerdote 2017).
The Brookings Institution is committed to quality, independence, and impact.
We are supported by a diverse array of funders. In line with our values and policies, each Brookings publication represents the sole views of its author(s).