
Contents
The history of Black people’s contributions to the catalog of inventions that marked the Industrial Revolution has been largely muted. This period is considered one of the most innovative eras in world history, seeing the birth of major advances in agriculture, transportation, communications, manufacturing, and electricity that fueled rapid economic growth. With the exception of a few notable inventors who are regularly elevated during Black History Month—e.g., George Washington Carver (peanut products) and Madam C. J. Walker (hair products)—the disregard of many of the era’s Black inventors not only whitewashes the historical record, but biases who we perceive to be innovators in the present.
Using a new database of inventors, this report demonstrates that Black contributions to the Industrial Revolution were influenced by the disproportionate number of Black Americans who lived in the U.S. South in the late 19th and early 20th century, where their opportunities to acquire and apply skills were severely limited by oppressive institutions. Still, Black Americans living outside the South invented nearly as frequently as white Americans, and at rates that would be considered extremely high by historic or global standards of invention even today. We use a novel database created by Sarada, Michael Andrews, and Nicolas Ziebarth that matches inventors listed on patent records in decennial years from 1870 to 1940 to complete census records, which include demographic information for the named inventors.1
The data reveals the following:
- From 1870 to 1940, Black people living in the North were eight times more likely to be awarded a patent than Black people living in the South. White people in the North were three times more likely to invent a patented technology than white people in the South, but regional effects were weaker for white people and they were much less concentrated in the South than Black people.
- In the North, Black people’s share of patents equaled their share of population. Black people accounted for 1.6% of the North’s population and 1.6% of patents across the decades studied. The rate of patenting per capita among northern Black and white residents was extremely high (0.31 per 1,000 residents for Black people and 0.39 for white people). Both of these rates exceed the U.S. rate of invention for most of the country’s history and approach the highest rates observed around the world today at the country level.2
- With 50,000 total patents, Black people accounted for more inventions during this period than immigrants from every country except England and Germany. In our database, 87% of inventions were traced to people born in the United States, and 2.7% of the U.S. total were invented by Black Americans, which is a larger share than nearly every immigrant group. After accounting for patents during nondecennial years, we estimate that Black people accounted for just under 50,000 total patents during this period.
Given the vast differences between the North and South in providing both skill-generating and skill-using opportunities, this historical research points to the importance of linking political equality and social opportunity to innovation and economic growth. It also provides a reassessment and revaluation of the extraordinary contributions of Black people in the development of the United States as well as global technological advancements.
Introduction
In leading theories of economic growth, technology and innovation are the driving forces of long-term gains in living standards.3Ideas—developed and commercialized—are key to innovation, and economics literature has long recognized that patents offer a valuable measure of invention. Patents were particularly important during the so-called Golden Age of Invention (1870 to 1940), or the second phase of the Industrial Revolution, which was characterized by an unprecedented flowering of economic growth and advances in living standards.4 As historians have documented, people living in the United States contributed disproportionately to this rise.
It is widely believed that Black Americans did not participate in the Industrial Revolution, as suggested by several recently published papers.5 Likewise, contemporary estimates report that Black people are much less likely to become inventors than whites, Asian Americans, and immigrants.
Our estimates for total patents by Black people during the Golden Age of Invention are similar to those previously published. We use the same database as used in Sarada et al., but we emphasize the importance of regional differences and how legal and cultural institutions in the South were particularly harmful to Black people. In this way, we build on the research of economist Lisa Cook, who is the only scholar we know of who has systematically analyzed how Jim Crow laws suppressed invention among Black people.6 We extend her work by using a more comprehensive measure of inventors, one that links patent records to newly released digital data from the U.S. Census Bureau for relevant years during the 1870 to 1940 period.
Our conclusion supports the arguments developed in Jonathan Rothwell’s A Republic of Equals, which concluded that educational achievement, innovation, and entrepreneurship were widespread in the North’s Black community in the decades between the end of slavery and beginning of Jim Crow.7
Methods
This article draws on a more detailed analysis from Jonathan Rothwell and Mike Andrews, recently published as a working academic paper. Interested readers should consult the methods section of that paper and see the discussion for further information.8
Patent records do not record the race of the inventor or other demographic information, other than their name and address. The key benefits of the Sarada, Andrews, and Ziebarth database is that it links these records to census data, unlocking valuable demographic information.
This database is extremely useful for comparing across groups of people and regions to understand where patented inventions came from and who developed the technologies. However, it is not a complete record of every patent developed during the period. Census records are not available for nondecennial years, and while many people identified in the decennial census would also be identified in interdecennial years, the fact that many would have changed addresses complicates direct matching.
Even during decennial years, matching a patent record to a census record is far from guaranteed. State and local geographies often use abbreviations or uncommon spellings. The name of the inventor may be abbreviated or misspelled. Overall, our database accounts for 19% of domestic patents for the relevant years, with nine years of missing data during each decade.
Because of these information gaps, we impute actual domestic utility patents from the U.S. Patent and Trademark Office to groups identified in our database using the group share for the relevant year and geography. For example, we find that 2.7% of all patents went to Black inventors, so a good estimate of the total number of inventions by Black inventors is .027 times the total number of recorded inventions of U.S. residents. In practice, the 2.7% share varies by year, so we assign the nearest decennial year estimate to the years in between to get a more precise estimate. A rule of thumb is that the number of patents observed in our database should be multiplied by 5.4 to account for missing matches, which we have reason to believe are largely random by group. The statistics below are careful to distinguish the estimated actual numbers from the lower numbers derived from the database.
Findings
From 1870 to 1940, Black people living in the North were eight times more likely to be awarded a patent than Black people living in the South. White people in the North were three times more likely to invent a patented technology than white people in the South, but they were much less likely to live in the South than Black people.
White Americans were 4.6 times more likely to patent than Black Americans during the entire period of 1870 to 1940, as other scholars have documented. That rate fluctuated somewhat, but remained fairly constant. A superficial interpretation of this result is that Black Americans faced enduring obstacles throughout the country that resulted in consistently low rates of patenting.
However, underlying this pattern is the fact that during this period, Black Americans were born and raised mostly in the U.S. South, where the institutional environment was radically different with respect to both race and invention. The share of African Americans living in the South went from 90% in 1870 to 77% in 1940. Meanwhile, only one-quarter (26%) of white Americans lived in the South throughout the period. Despite the lopsided share of African Americans living in the South, northern African Americans filed the majority of patents (58% is the average for the entire period), with the North’s patenting share reaching 71% by 1940. Most patents filed by white Americans also came from northern residents (90%), reflecting regional differences in education and industrial concentrations.
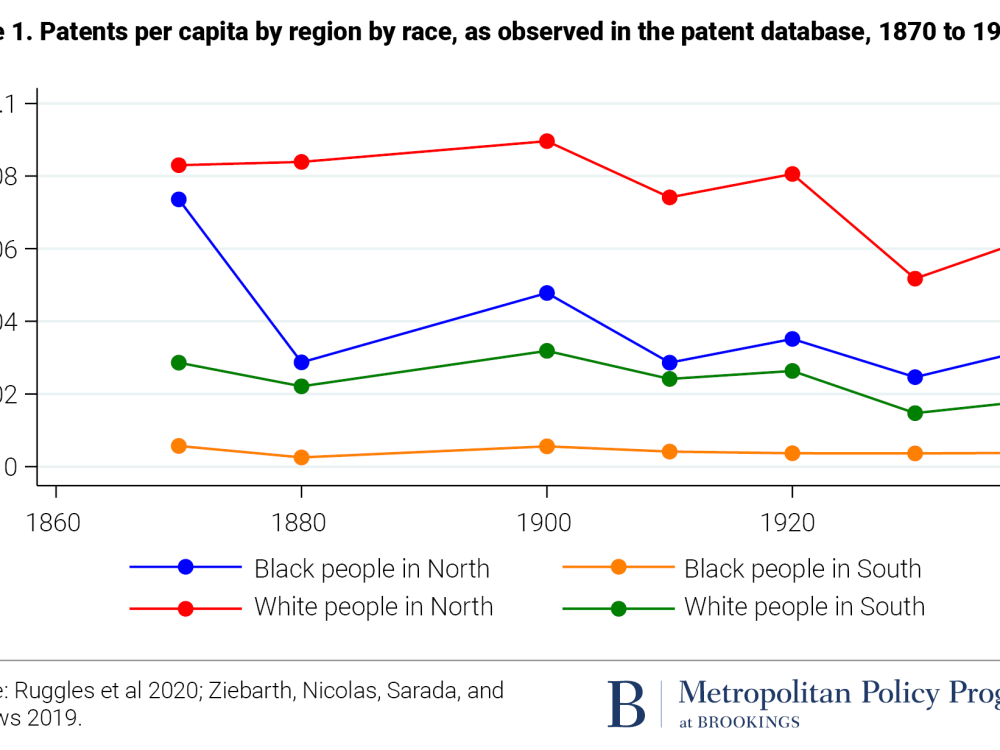
The data suggests these regional institutional differences explain quite a lot. Across the period, Black people living in northern U.S. states were eight times more likely to patent than Black people living in southern states (Figure 1). The regional gap for white inventors is also large, in that northern white people were three times more likely to patent than their southern counterparts—but that is only one-third as strong as the effect on Black invention. A simple interpretation of these facts is that poor social and economic resources (e.g., lack of education, research and development, and industry) limited invention in the South by a factor of three, whereas systemic racism had an even larger effect—albeit only on the Black population. Black people in the North were almost as likely to file a patent as white people in the North, and they were far more likely to patent than white people in the South.
To put in perspective the extraordinary number of patents given to Black people in the North in the decades after the end of slavery, consider that patenting in northern Black communities was equal to white Americans nationally. During this era, the United States was arguably the most inventive place on Earth at what was arguably the most inventive era in world history. This puts northern Black people in the global vanguard of invention in the late 19th and early 20th century.
We also considered what these patenting rates look like by region of birth. This distinction is important in analyzing the causes of different patenting rates by region. A state could be better at providing Black people learning opportunities, practice opportunities, or both. A state that provides only practice opportunities may provide no advantages to people born there, but may be a welcoming destination to highly skilled migrants.
The patenting rates by region of birth are largely consistent with patenting by region of residence. For both races, patenting rates are slightly higher by region of residence, consistent with there being both learning and practice opportunity effects in northern states. Whether using state of birth or residence, the broad regional distinctions are still evident, and the data is clear that northern Black patenting rates were high by either definition.
In the North, Black people’s share of patents equaled their share of population. Black people accounted for 1.6% of the North’s population and 1.6% of patents from 1870 to 1940. The rate of patenting per capita among northern Black and white residents was extremely high (0.31 per 1,000 residents for Black people and 0.39 for white people). Both of these rates exceed the U.S. rate of invention for most of the country’s history, and approach the highest rates observed around the world today at the country level.9
On average, Black patenting rates are lower than white patenting rates in the same state, but there are several notable exceptions (Table 2). In Washington, Maine, Colorado, Pennsylvania, and Indiana, both patenting by residents and patenting by those born in the state are higher for Black people than white people. In Wisconsin, Black patenting rates are roughly the same as white rates for residents, but Black patenting is much higher by birth—suggesting that Wisconsin provided especially advantageous learning opportunities. In New York, Michigan, and Ohio, patenting rates were essentially the same between Black and white people, whether by residence or birth.
In southern states, patenting is almost uniformly lower for white and Black people, but some of the within-race comparisons are instructive. In states with heavy historical slave populations—such as Alabama, South Carolina, Georgia, Mississippi, Texas, and Florida—patenting was much higher for Black people who were born there than patenting by residence. This suggests that these states were especially bad at providing practice opportunities, but many Black people born there achieved inventive success elsewhere after migrating.
|
Table 1. Patents per million population observed in the patent database by race and state of residence and birth, 1870 to 1940 (cumulative) |
||||
|---|---|---|---|---|
| Black people | White people | |||
| State of residence | State of birth | State of residence | State of birth | |
| District of Columbia | 201.5 | 140.7 | 491.6 | 300.4 |
| Massachusetts | 188.3 | 120.4 | 222.9 | 179.9 |
| Washington | 151.6 | 117.9 | 87.0 | 33.5 |
| Maine | 111.0 | 413.3 | 65.0 | 137.7 |
| New York | 100.9 | 96.7 | 98.0 | 97.1 |
| Connecticut | 100.6 | 96.7 | 293.7 | 223.9 |
| Colorado | 79.7 | 70.1 | 71.4 | 51.1 |
| Delaware | 74.7 | 63.0 | 174.5 | 114.3 |
| Pennsylvania | 59.1 | 67.9 | 49.3 | 52.5 |
| California | 58.7 | 25.6 | 84.9 | 53.7 |
| New Jersey | 57.9 | 57.0 | 219.3 | 121.6 |
| Illinois | 57.2 | 39.0 | 53.4 | 44.2 |
| Maryland | 50.9 | 51.7 | 133.0 | 115.7 |
| Michigan | 41.1 | 40.7 | 48.0 | 45.5 |
| Ohio | 36.4 | 46.4 | 45.5 | 50.9 |
| Wisconsin | 34.8 | 77.4 | 38.6 | 39.9 |
| Indiana | 30.4 | 45.7 | 26.8 | 36.3 |
| Kansas | 19.6 | 19.6 | 12.9 | 35.6 |
| Utah | 14.8 | 513.1 | 84.9 | 58.2 |
| Minnesota | 14.7 | 10.1 | 28.9 | 31.9 |
| Missouri | 13.2 | 13.5 | 24.5 | 29.2 |
| Iowa | 9.5 | 102.9 | 16.2 | 28.5 |
| Oregon | 7.5 | 16.1 | 81.3 | 49.0 |
| Tennessee | 6.5 | 11.8 | 11.8 | 14.2 |
| Florida | 6.3 | 8.3 | 29.5 | 23.3 |
| Louisiana | 6.1 | 5.8 | 25.9 | 23.7 |
| Oklahoma | 5.8 | 9.7 | 17.1 | 11.6 |
| Kentucky | 4.5 | 9.2 | 10.4 | 19.0 |
| Alabama | 2.8 | 5.3 | 10.3 | 13.2 |
| Texas | 1.9 | 2.4 | 7.6 | 9.4 |
| South Carolina | 1.6 | 6.1 | 15.4 | 21.0 |
| Mississippi | 1.4 | 4.8 | 8.9 | 11.4 |
| Georgia | 1.0 | 4.7 | 7.6 | 13.9 |
| Arkansas | 1.0 | 2.4 | 6.1 | 7.8 |
| North Carolina | 0.4 | 5.2 | 7.0 | 12.9 |
| New Hampshire | 0.0 | 501.4 | 78.4 | 184.9 |
| Vermont | 0.0 | 158.2 | 88.5 | 147.4 |
| Nebraska | 0.0 | 25.9 | 12.2 | 26.4 |
| Idaho | 0.0 | 0.0 | 42.1 | 19.9 |
| North Dakota | 0.0 | 0.0 | 19.0 | 20.0 |
| Arizona | 0.0 | 0.0 | 34.0 | 44.7 |
| South Dakota | 0.0 | 0.0 | 15.3 | 23.8 |
| Wyoming | 0.0 | 22.9 | 43.8 | 47.1 |
| New Mexico | 0.0 | 0.0 | 19.6 | 14.2 |
| Nevada | 0.0 | 0.0 | 73.5 | 79.6 |
| West Virginia | 0.0 | 7.8 | 1.1 | 13.1 |
| Hawaii | 0.0 | 0.0 | 18.3 | 23.8 |
| Montana | 0.0 | 0.0 | 0.0 | 36.7 |
| Rhode Island | 0.0 | 40.7 | 0.0 | 65.1 |
| Virginia | 0.0 | 20.9 | 0.0 | 31.5 |
| Alaska | 0.0 | 0.0 | 0.0 | 1097.7 |
To put these numbers in perspective, we can compare them to contemporary patent rates in America’s most prolific innovation hubs. To do so, we multiple by 5.4 to account for missing records. From 2007 to 2011, there were 296 patents granted per million residents of U.S. metropolitan areas, according to previous Brookings research.10From 1870 to 1940, adjusted Black patenting rates exceeded 300 per million in 12 states.
Compared to other states and territories, Black residents of Washington, D.C. had the highest rate of patenting during this golden age, with 1,088 patents per million Black residents, after adjusting for missing data. This rate is roughly equal to contemporary San Francisco and Seattle, though somewhat lower than contemporary San Jose, Calif. In recent years (2007 to 2011), only 16 metropolitan areas exceeded the rate of patenting reached by Black residents in Washington, D.C. from 1870 to 1940.
Other Brookings research allows us to put this in an international perspective. We estimate that northern Black Americans had a rate of 300 patents per million residents, after adjusting for missing records. Japan was the only country in the world to patent at a higher rate from 2010 to 2012.11With 50,000 total patents, Black people accounted for more inventions during this period than immigrants from every country except England and Germany. In our database, 87% of inventions were traced to people born in the United States, and 2.7% were invented by Black Americans—a larger share than nearly every immigrant group. After accounting for patents during nondecennial years, we estimate that Black people accounted for just under 50,000 total patents during this period.
It is widely known that immigrants to the United States contributed disproportionately to entrepreneurship and innovation, and continue to do so today. Yet it is also the case that during the Golden Age of Invention, most inventions (87%) came from people born in the United States. Black people were among the most important contributors to this, accounting for more patents than immigrants from any country except Germany and England.

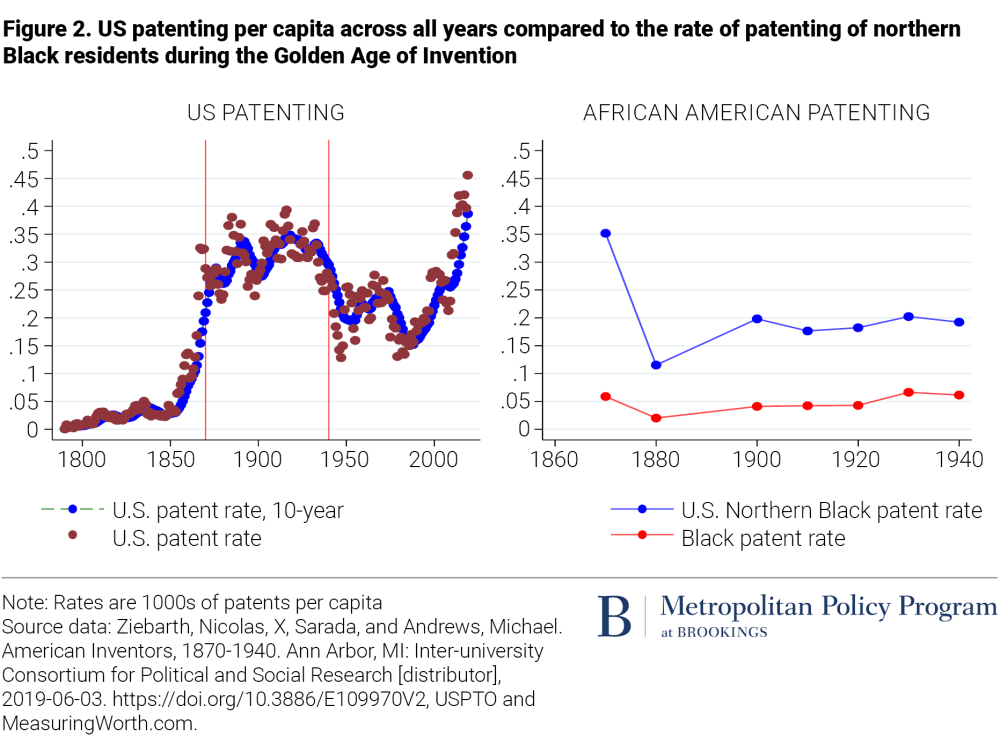
To understand the rate of patenting by northern Black Americans during this period, we compare it to the average rate of patenting throughout U.S. history. A few observations stand out (Figure 2).
First, the Golden Age truly was remarkable for its rate of innovation. No other time in the 19th or 20th century saw rates of patenting matched by the period from 1870 to 1940. In the late 20th and early 21st century, the introduction of software patents has contributed to the increase in patenting, along with much higher rates of postsecondary education and research and development spending per capita.12 Second, Black patenting by northern residents during this period should be considered extremely high relative to the national rate at any time in U.S. history. Simply put, from the period after the end of the Civil War to start of World War II, northern Black people were among the most inventive people in world history.
Discussion
Perhaps the earliest and most ambitious attempt to measure the contribution of Black people to U.S. invention was made by Henry Baker, who worked at the U.S. Patent Office. In 1913, he surveyed approximately 8,000 registered patent attorneys, found 1,200 inventions attributed to people of African American ancestry, and was able to confirm 800 of them.13 He emphasized that this was a large undercount, as attorneys reported failing to recall the names or inventions of some of their Black clients. Our database suggests that Black people were producing roughly 800 patents per year during the decade of Baker’s work.
“We can never know the whole story,” Baker wrote in a 1913 pamphlet. “But we know enough to feel sure that if others knew the story even as we ourselves know it, it would present us in a somewhat different light to the judgment of our fellow men, and, perhaps, make for us a position of new importance in the industrial activities of our country.”
In this spirit, we follow Baker’s lead and describe some of the Black inventors who shaped the history of technology:
Lewis Latimer was born in Massachusetts in 1848 to escaped former slaves. He became a leading electronics engineer, making technical drawings for Alexander Graham Bell, contributing to the development of telephones, and later working for Thomas Edison on improvements to lighting.14
Elijah McCoy was also the son of African American parents who escaped slavery. He was born in Canada but raised in Michigan, before being sent to study in Scotland at age 15. McCoy was denied work as an engineer based on his race, and had to settle for work as a railway technician. In that context, he developed and patented an automated system for wheel lubrication, greatly improving the efficiency of train travel. He went on to have a lengthy career as an inventor.15
Granville Woods was another influential Black inventor of the era, born in Ohio in 1856. He made fundamental innovations to railways, especially in the form of communication systems and the distribution of electricity to the rail cars.16
Sarah Boone invented the ironing board, winning a patent in 1892. She was raised in New Haven, Conn. by African American parents who escaped from slavery in North Carolina through the Underground Railroad.17
Despite living and working in the North, these and other Black inventors, entrepreneurs, and workers of all kinds faced discrimination and professional and financial barriers that white people did not.18 Obtaining a patent was more difficult for Black people, because it often involved working with a white lawyer who may be tempted to engage in unfair dealings. These obstacles, no doubt, suppressed the wealth, fame, and influence of Black inventors—and yet, many succeeded in making important contributions to American technological and economic development. What is striking is that even while lacking complete liberty, Black people in the North acquired and practiced cutting-edge creativity, science, and technical skills at very high rates for a substantial period of U.S. history.
Several important institutions changed in the North that help explain why opportunities for Black advancement seem to have stalled and even reversed after the Golden Age of Invention. The 1920s saw the birth of zoning laws and other government-backed institutions that closed off real estate markets to Black people, leading to rapid increases in racial segregation which did not reach their peak until the 1970s.19 With racial segregation made either an explicit goal or viewed as an unavoidable side effect, governments around the country fostered segregation and corralled Black people into areas that were targeted for disinvestment in important public resources, including education.20 Meanwhile, powerful professional associations—including the American Bar Association and American Medical Association—gained prominence in the early 20th century and used their emerging power, in part, to officially discriminate against Black people for decades.
Throughout northern states, the Golden Age of Invention in America provided a tantalizing glimpse into what Black people could accomplish if given robust opportunities to learn and practice in highly skilled fields. These accomplishments negated the assumption—once held by many in America—that Black people cannot thrive just as well as any other group at the most challenging cognitive activities. National leaders should apply this historical lesson to today’s institutional landscape, and seek out and eliminate barriers to the full participation of Black people in American life.
Related Content


Related Books

Authors


-
Footnotes
- Sarada, Sarada, Michael J. Andrews, and Nicolas L. Ziebarth. “Changes in the demographics of American inventors, 1870–1940.” Explorations in Economic History 74 (2019): 101275.
- Mark Muro and others, “America’s Advanced Industries: What are they, where are they, and why they matter” (Washington: Brookings, 2015)
- Jones, Charles I. “The facts of economic growth.” In Handbook of macroeconomics, vol. 2, pp. 3-69. Elsevier, 2016.
- Gordon, Robert J. 2016. The Rise and Fall of American Growth: The U.S. Standard of Living since the Civil War (Princeton University Press); Deaton, Angus. 2014. The Great Escape: Health, Wealth, and the Origins of Inequality (Princeton University Press).
- Akcigit, Ufuk, John Grigsby, Tom Nicholas. 2017. “The Rise of American Ingenuity: Innovation and Inventors of the Golden Age” NBER Working Paper No. 23047; Sarada, Sarada, Michael J. Andrews, and Nicolas L. Ziebarth. “Changes in the demographics of American inventors, 1870–1940.” Explorations in Economic History 74 (2019): 101275.
- Cook, Lisa D. 2014. “Violence and economic activity: evidence from African American patents, 1870–1940.” Journal of Economic Growth 19 (2): 221-257.
- Jonathan Rothwell, A Republic of Equals: A Manifesto for A Just Society (Princeton University Press, 2019).
- Mike Andrews and Jonathan Rothwell, “Reassessing the Contributions of African American Inventors to the Golden Age of Innovation” (SSRN Working Paper, 2020)
- Mark Muro and others, “America’s Advanced Industries: What are they, where are they, and why they matter” (Washington: Brookings, 2015)
- Jonathan Rothwell, Jose Lobo, Deborah Strumsky, and Mark Muro, “Patenting Prosperity: Invention and Economic Performance in the United States and its Metropolitan Areas” (Washington: Brookings Institution. 2013).
- Mark Muro and others, “America’s Advanced Industries: What are they, where are they, and why they matter” (Washington: Brookings, 2015)
- Jonathan Rothwell, Jose Lobo, Deborah Strumsky, and Mark Muro, “Patenting Prosperity: Invention and Economic Performance in the United States and its Metropolitan Areas” (Washington: Brookings Institution. 2013); Bloom, Nicholas, Charles I. Jones, John Van Reenen, and Michael Webb. 2020. “Are Ideas Getting Harder to Find?” American Economic Review, 110 (4): 1104-44.
- Baker, Henry 1913, “The colored inventor: A Record of Fifty Years” (Project Gutenberg, https://www.gutenberg.org/files/21281/21281-h/21281
- Lewis Latimer, National Inventors Hall of Fame, available https://www.invent.org/inductees/lewis-latimer (accessed October 24, 2020).
- Elijah McCoy, National Inventors Hall of Fame, available https://www.invent.org/inductees/elijah-mccoy (accessed October 24, 2020).
- Granville Woods, National Inventors Hall of Fame, available https://www.invent.org/inductees/granville-woods (accessed October 24, 2020)
- Ainissa Ramirez, “New Haven’s Hidden Figure: Sarah Boone” February 22, 2019New Haven Independent, https://www.newhavenindependent.org/index.php/archives/entry/new_havens_hidden_figure_sarah_boone/
- Fouché, Rayvon. Black Inventors in the Age of Segregation: Granville T. Woods, Lewis H. Latimer, and Shelby J. Davidson. (Johns Hopkins University Press, 2003).
- Rothwell, Republic of Equals.
- Trounstine, Jessica. Segregation by design: Local politics and inequality in American cities. Cambridge University Press, 2018.
The Brookings Institution is committed to quality, independence, and impact.
We are supported by a diverse array of funders. In line with our values and policies, each Brookings publication represents the sole views of its author(s).