
The Center on Children and Families at Brookings has used a model for the past three years to predict the U.S. poverty rate before the official figure was released by the Census Bureau. As the table below shows, our track record is reasonably good although we caution that predictions are just that and can be wrong.

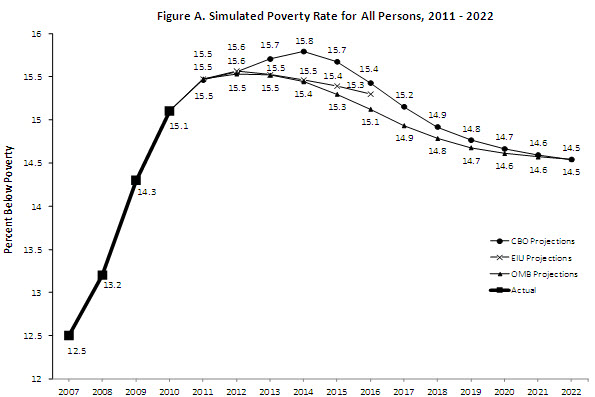
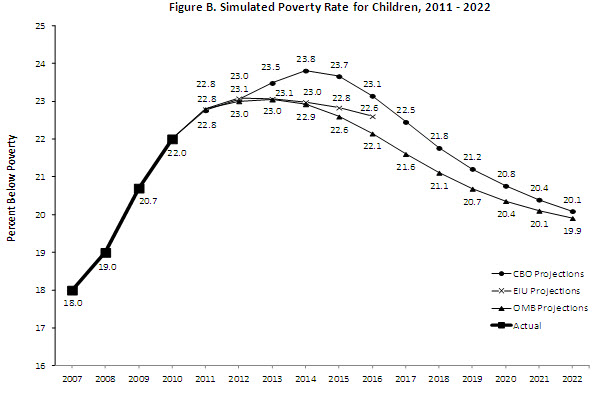
For the latest year (2011) we predict a rate of 15.5 percent for adults and 22.8 for children[1] (see accompanying figures below). On Sept. 12, 2012 the Census Bureau will release the actual numbers for 2011 and we will be able to compare them to our predictions.
The predicted poverty rate translates to 48.3 million people in poverty in 2011, an increase of 1.6 million people from 2010. For children, we predict an increase from 16.3 million children in poverty in 2010 to 16.9 million in 2011.
The rate for 2011 compares to 12.5 percent of the population that was in poverty in 2007 before the recession began. An increase of 3 percentage points represents over 10 million people, larger than the entire population of New York City.
Poverty rates have not been this high since the early 1960s before the War on Poverty began.
Looking beyond 2011, we predict a rate of 15.6 for 2012 and a rate that remains above 15 percent for the next four years. By 2020, the poverty rate is expected to decline to around 14 percent, but our analysis suggests it will be many years before it returns to anything approaching the rate achieved before the recession began. With cuts in social spending for lower-income families slated to occur over the next decade, the outlook for the poor looks grim.
These increases in poverty are driven primarily by high unemployment rates. These are the primary drivers in our model, which is estimated using historical data and unemployment projections from CBO, OMB, and the Economist Intelligence Unit for future years.[2] When unemployment rates are high, some people fall into poverty as the result of losing a job. Others fail to climb out because of the difficulty of finding work. Unemployment insurance has played an important role in cushioning drops in income. The Supplemental Nutrition Assistance Program (SNAP, formerly Food Stamps), which does not affect official poverty rates but does affect a broader measure of poverty, has also helped the unemployed weather the recession. These programs will almost certainly shrink in 2013 and beyond – further exacerbating the problem of insufficient resources for those at the bottom.
Resources
Blank, Rebecca M. 2009. “Economic Change and the Structure of Opportunity for Less-Skilled Workers.” In Changing Poverty, Changing Policies, Maria Cancian and Sheldon H. Danziger, eds. New York: Russell Sage Press.
Congressional Budget Office. 2012. “An Update to the Budget and Economic Outlook: Fiscal Years 2012 to 2022.” Washington, DC.
Economist Intelligence Unit. September 4, 2012. Country Report for the United States of America.
Monea, Emily and Isabel Sawhill. 2009. “Simulating the Effects of the ‘Great Recession’ on Poverty.” The Brookings Institution. https://www.brookings.edu/papers/2009/0910_poverty_monea_sawhill.aspx (accessed September 4, 2012).
Monea, Emily and Isabel Sawhill. 2011. “An Update to ‘Simulating the Effects of the ‘Great Recession’ on Poverty.’” The Brookings Institution. https://www.brookings.edu/research/reports/2011/09/13-recession-poverty-monea-sawhill (accessed September 4, 2012).
Office of Management and Budget. 2012. “Mid-Session Review: Budget of the U.S. Government: Fiscal Year 2013.” Washington, DC.
U.S. Census Bureau. 2011. “Annual Estimates of the Resident Population for Selected Age Groups by Sex for the United States: April 1, 2010 to July 1, 2011.” http://www.census.gov/popest/data/national/asrh/2011/tables/NC-EST2011-02.xls (accessed September 7, 2012).
U.S. Census Bureau. 2012. “Poverty Status of People, by Age, Race, and Hispanic Origin: 1959 to 2010.” http://www.census.gov/hhes/www/poverty/data/historical/hstpov3.xls (accessed September 4, 2012).
[1] Given the unusual length and depth of the current downturn, and the fact that there is no historical analogue for which we have data, it is likely that our estimates underestimate poverty and thus are conservative estimates of the number of people affected.
[2] Future poverty rates are predicted based on historical and projected unemployment rates and historical poverty rates. For further explanation of the methodology used to calculate predicted poverty rates, see Monea and Sawhill (2009).
The Brookings Institution is committed to quality, independence, and impact.
We are supported by a diverse array of funders. In line with our values and policies, each Brookings publication represents the sole views of its author(s).