Executive summary
Of all the rules that the U.S. Department of Education will have to formulate for the Every Student Succeeds Act, the proposed regulations to monitor that states and districts spend comparable amounts for schools eligible and not eligible to use Title I funds are attracting the most attention. Currently, districts can show comparability based on the number of teachers per student. The Department has proposed that teacher salaries be used to assess comparability.
We used data from various sources to explore how comparable teacher salaries are for schools that are eligible and not eligible to use Title I funds. We found nationally that higher school poverty rates and Title I status are not associated with lower spending on teachers when the analysis controls for the districts and states in which schools are located. In addition, detailed data for teachers in Wisconsin indicates that in districts that have Title I and non-Title I schools, years of teaching experience and highest degree earned are about the same in both kinds of schools.
The comparability debate is a distraction from the more important issue of how Title I can best close gaps. As we wrote previously in this series, Title I spends most of its resources on programs and services that don’t do much to help students. A more fruitful discussion would focus on how states and districts can spend their money effectively, by using evidence to identify programs that work on which Title I funds should be spent.
The U.S. Department of Education (ED) is preparing regulations to implement the Every Student Succeeds Act (ESSA, Public Law 114-95). Large and complex pieces of legislation require agencies to write regulations about how the law is to be implemented, and ESSA is no exception. Of all the regulations that ED will have to formulate for ESSA, the proposed regulations to monitor that states and districts spend comparable amounts for schools eligible and not eligible to use Title I funds are attracting the most attention.
“Comparability” may sound wonk-ish, but it is at the heart of what Title I is trying to accomplish, which is to provide funds to help close achievement gaps between advantaged and disadvantaged students. If states and districts reduce state and local funds for schools receiving Title I funds, those schools will not have more resources to close gaps.
In pushing for its version of comparability, ED finds itself in a debate with Congress. In hearings, Senator Lamar Alexander (R-TN), one of the primary authors of the law, admonished the Secretary of Education for drafting regulations that did not stay within the words of the law.[i] But what the Secretary proposed makes so much sense that readers may wonder why it had to be proposed at all. The Secretary proposed that when districts assessed comparability of spending, they include actual spending on teachers.
Wait…they didn’t already? No—longstanding Federal regulations allow districts to assess comparability using the number of teachers (and other staff such as guidance counselors and aides) per student, rather than how much is actually spent on teachers. A district need only show that its high-poverty schools have about the same number of full-time equivalent teachers as its low-poverty schools, relative to enrollments in the schools.
But a district might be spending much less in its high-poverty schools if teachers in those schools were less experienced and had fewer graduate credits. Teacher salaries are typically determined by contracts that specify salaries by years of teaching experience and postgraduate credits. A teacher with 20 years of experience and a master’s degree might make twice as much or more than a teacher just starting out.
These differences can translate into large differences between schools, as a simple example shows. If a low-poverty elementary school has 400 students and 20 teachers, and 80 percent are experienced and receive $70,000 in salary, and 20 percent are new and receive $35,000 in salary, the school spends $3,150 per student for teachers. If, in contrast, a high-poverty school has 80 percent new teachers and 20 percent experienced teachers, the school spends $2,100 per student for teachers. In this example, the high-poverty school is spending $460,000 less a year on its teachers than the low-poverty school.
That’s a big spending difference for a key education resource. Research consistently has found that more experienced teachers contribute more to student learning, at least when comparing novice teachers with those with a few years on the job.[ii] The heated and ongoing disagreement between the Obama administration and Congress on the proposed regulations on comparability of funding assumes that the scenario in our example is rampant and requires regulation to fix. But, in fact, how common is it for schools to spend differently on teachers based on the income levels of the families of the students they serve? If teacher spending is different, a comparability requirement based on it will require districts to act. If teacher spending is not different, requiring it to be comparable is pushing on a string. Not much happens.
We linked several data sources to explore this issue. The U.S. Department of Education’s Office of Civil Rights (OCR) recently released data from the 2013-2014 school year that includes how much public schools spent on their teachers and specifically how much schools spent on teachers from local and state sources. That excludes funds that might come from Title 1, Race to the Top, or other Federal sources. We linked OCR data with the National Center for Education Statistics Common Core of Data (CCD), which includes school enrollment, numbers of students participating in the free or reduced price lunch program, and whether a school was eligible for Title I and the kind of program it operated (schoolwide or targeted). For teacher experience and postgraduate credits, we linked OCR and CCD data with data from the Wisconsin Department of Public Instruction that includes years of teacher experience and highest degree attained for every teacher in the state (such detailed information on teachers is not available in the federal data).
High-poverty schools appear to spend less on teachers, except they don’t
We focus on elementary schools, where most Title I dollars are spent. Nationally, our data show that the average elementary school has 472 students, 27 teachers, and 265 students in the free and reduced price lunch program. The average elementary school spends $3,295 on teachers per student.
We first estimated a simple correlation between teacher spending per student and school poverty rates for all the elementary schools in our data. We used the percent of students enrolled in the free-lunch program as a proxy for a school’s poverty rate, a common if not entirely satisfactory procedure.[iii] We found a negative correlation: teacher spending was lower when schools had higher poverty rates. An increase in the school poverty rate of ten percentage points reduced teacher spending per student by about $100.
This correlation is consistent with conventional wisdom but it ignores a key aspect of the data: schools are in districts and districts are in states. From a statistical perspective, states, districts, and schools form ‘levels,’ and it is within those levels that people are taxed for schools and decisions are made about how to distribute funds among schools. Correlations should be estimated accounting for these levels if the findings are to be relevant to practical policy and management issues.
When we account for levels, the correlation is reversed. An increase in the poverty rate of ten percentage points increased teacher spending per student by about $30, and the correlation was not statistically significant at conventional levels.[iv] Teacher spending is about the same regardless of school poverty.
This reversal is a symptom of what is known as Simpson’s paradox, or, in some settings, the ‘ecological fallacy.’ Think of it this way—if we had only two states, say, New Jersey and Mississippi, we would notice that New Jersey has a low poverty rate (it’s 38 percent) and spends a lot on its teachers per student ($5,206). Mississippi has a higher poverty rate (78 percent) and does not spend a lot on its teachers per student ($2,400). It would appear that poverty is negatively correlated with teacher spending.
From this information, what can we infer about the relationship between poverty and teacher spending within each state? The answer is—nothing. Both states might have exactly equal spending on teachers regardless of school-level poverty. In fact, when we estimated correlations within the two states, that’s what we found—both states had a statistically insignificant correlation between teacher spending at individual schools and the poverty rate of those schools’ student populations.
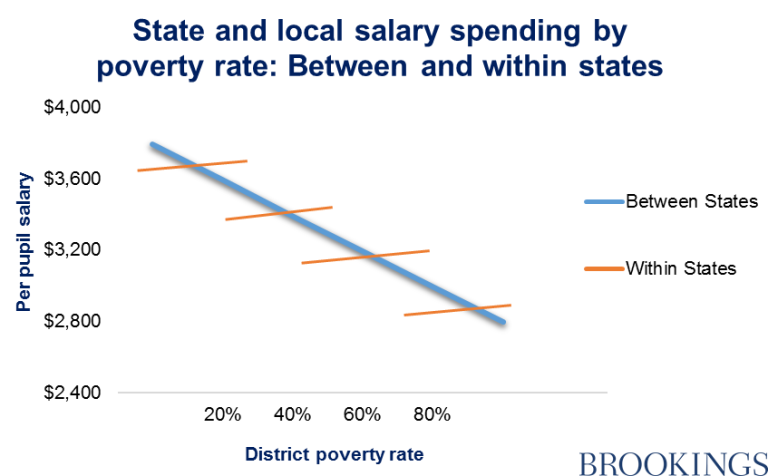
The figure depicts what we found. Overall, the blue line shows a negative relationship between poverty and spending when states are the unit of analysis. The orange lines depict what is happening within states—they are slightly positively sloped. (In fact, the lines we estimated have different slopes depending on the state, which is too much detail to show in a figure.) We also could substitute districts for states and schools for districts in the figure—low-spending and high-spending districts could dominate a correlation that ignored schools being within districts (districts would be the blue line), while the correlation within districts could be in the other direction (schools would be the orange line).[v]
We did the same calculations substituting whether schools were eligible for Title I in place of the poverty rate. Because eligibility for Title 1 is a function of a school’s poverty rate, not surprisingly we found the same patterns. Accounting for levels in the data, schools that were eligible for Title I had about the same spending on teachers regardless of their poverty rates (the estimate was positive and insignificant).
Simpson’s paradox is a caution to researchers that relationships observed at aggregated levels are not necessarily true at disaggregated levels. When we add levels to the analysis, what is observed for the nation as a whole or when comparing states—poverty is associated with lower spending on teachers—is not observed within states and districts.
Within Wisconsin districts, teacher experience is not correlated with school poverty
What about the conventional wisdom that teachers with more experience are more likely to be in low-poverty schools? We turned to the Wisconsin data, which includes years of teaching experience and highest degree, whereas federal data does not. We continue to use the OCR teacher spending data because Wisconsin does not separate Federal funds from state and local funds in reporting teacher salaries. Within Wisconsin, we identified 86 districts that had elementary schools that were and were not eligible for Title I. Having eligible and ineligible schools enables us to model what the comparability provision requires, which is that districts show they spend comparably at Title I schools and non-Title I schools. Some districts have no eligible schools and others have only eligible schools. Both kinds of districts drop out of this calculation.
We calculated average differences between eligible and ineligible schools on three items: teacher spending per student, years of teacher experience, and highest degree earned. Conventional wisdom would have all three being lower in Title I schools. It’s not what we see. Teacher spending shows a difference of $54 favoring Title I schools. Years of teaching experience are very close, a difference of a third of a year. And highest degree earned is nearly identical. Based on these averages, Wisconsin districts have nearly identical distributions of teachers in elementary schools that are eligible and not eligible for Title I.
We do not have data for all states enabling us to do this same comparison of teacher salaries, experience, and education, and maybe Wisconsin is unusually equitable among states. The point is that the prevailing view that teacher experience is lower in high-poverty schools is not borne out here. Perhaps new teachers are more likely to start teaching in high-poverty districts. But within those districts, the Wisconsin data suggest they are equally likely to teach in Title I schools or non-Title I schools.
|
Wisconsin elementary schools |
Title 1 |
|
|
Not eligible |
Eligible |
|
|
Teacher spending per student |
$3,275 |
$3,329 |
|
Years of total teaching experience |
13.9 |
13.6 |
|
Highest degree earned* |
5.6 |
5.5 |
Source: Authors’ calculations using data from Office of Civil Rights, the Common Core of Data, and Wisconsin Department of Public Instruction teacher files.
*Wisconsin codes highest degree between 2 and 8. A value of 5.6 means the average teacher has a master’s degree and some teachers have higher degrees.
Spending differences in Wisconsin varied considerably between districts. The standard deviation of the spending difference is $838. A similar calculation for New Jersey yielded a larger standard deviation of $1,223. That means teacher spending in Title I and non-Title I schools differed substantially in some districts (and in both directions). Understanding the basis for these differences will be useful if policymakers are debating whether to require comparability of teacher spending.
Effectiveness is more important than comparability
From a political perspective, the debate about how districts demonstrate comparability is part of a power struggle between two branches of government. From our empirical perspective, the debate is much ado about nothing—the typical district already spends about the same on teachers in schools that are and are not eligible for Title I. The Wisconsin data also indicate that teacher experience is about the same.
ESSA creates a legal requirement that districts show comparability, and so they have to. But the debate about how to show it is a distraction from the more important issue of how Title I can best close gaps. As we wrote previously in this series, Title I has not shown it is effective in closing gaps. It spends most of its resources on programs and services that don’t do much to help students.[vi] A more fruitful discussion would focus on how states and districts can spend their money effectively, by using evidence to identify programs that work on which Title I funds should be spent.
[i] An analysis by the Congressional Research Service supported Senator Alexander’s view that the proposed regulations exceeded the law’s intent. See www.edworkforce.house.gov/uploadedfiles/sns_and_negotiated_rulemaking_5-5-16.pdf, accessed July 5, 2016.
[ii] Sass and Harris review the extensive literature on experience and effectiveness, and provide estimates using Florida data. Tim Sass and Doug Harris, “Teacher training, teacher quality and student achievement,” Journal of Public Economics, vol. 95, Issues 7-8, August 2011, pp. 798-812.
[iii] https://www.brookings.edu/research/reports/2016/06/30-no-more-free-lunch-for-education-policymakers-and-researchers-chingos.
[iv]Technically, we estimated a three-level model with poverty and school enrollment as fixed effects, and state and districts within states as random effects.
[v] The Center for American Progress’s analysis of comparability appears to rely on these kinds of analyses of schools within states. https://cdn.americanprogress.org/wp-content/uploads/2015/03/ESEAComparability-brief2.pdf, accessed July 5, 2016.
[vi] Dynarski and Kainz, “Why federal spending on disadvantaged students (Title I) doesn’t work,” https://www.brookings.edu/research/reports/2015/11/20-title-i-spending-disadvantaged-students-dynarski-kainz
Authors

The Brookings Institution is committed to quality, independence, and impact.
We are supported by a diverse array of funders. In line with our values and policies, each Brookings publication represents the sole views of its author(s).