

In 2017, Brookings published its first analysis of Black-majority cities. This report updates that publication using the most recent American Community Survey data, averaged over the period from 2015 to 2020.
The “Black Panther” comic book and film series tells the story of the fictional African kingdom of Wakanda, which must protect itself from countries seeking to extract its rare natural resources. This narrative can be seen as a metaphor for historic colonization and present-day wealth extraction in Black-majority communities. But just as white supremacy, colonization, and apartheid occurred in different regions of the world, the metaphor doesn’t apply only to Africa and people of African ancestry. Hence, the recently released second installment to the film franchise, “Wakanda Forever,” introduces the kingdom of Talokan—another resource-rich, technologically advanced civilization, this time steeped in Mesoamerican culture.
In “Wakanda Forever,” filmmaker Ryan Coogler asks audiences to see that Black and brown-majority places share a common challenge, as modern-day colonizers seek to strip them of their resources. This similarity is more fact than fiction when considering that some of the cities with the greatest economic output in the U.S. are mostly populated with people who identify as Black and Latino or Hispanic. This is the case for the top three cities in terms of economic output: New York City, Los Angeles, and Chicago, which estimates show had a combined gross metropolitan product representing 16% of the nation’s total gross domestic product in 2021.
Just as in the fictional nations of Wakanda and Talokan, the demographic trends in these communities here in the U.S. present real opportunities for racial coalitions that can shift the balance of power around critical quality of life areas such as housing, employment, education, and political representation. Black and Latino or Hispanic cities reflect America’s rapidly shifting demographics, which demand a more strategic recognition of the value of racial diversity in our cities and towns.
This report and interactive data visualization updates Brookings’s 2017 Black-majority cities map by including Latino-majority and Black and Latino-majority places, where there is the potential for racial coalitions to drive community well-being.1
Black-majority and Latino-majority cities and towns
This interactive map shows the location and total population of Black-majority places (in purple), Latino-majority places (in yellow), and places with a combined Black and Latino-majority population (in orange). The size of each dot shows the relative size of the city.
While these places are spread out across most of the U.S., Black-majority places tend to be clustered in the Southeast while Latino-majority places are in the Southwest.
Note: To avoid double counting respondents who identify as both Black and Latino or Hispanic, we use the “non-Hispanic; Black alone” ACS designation here.
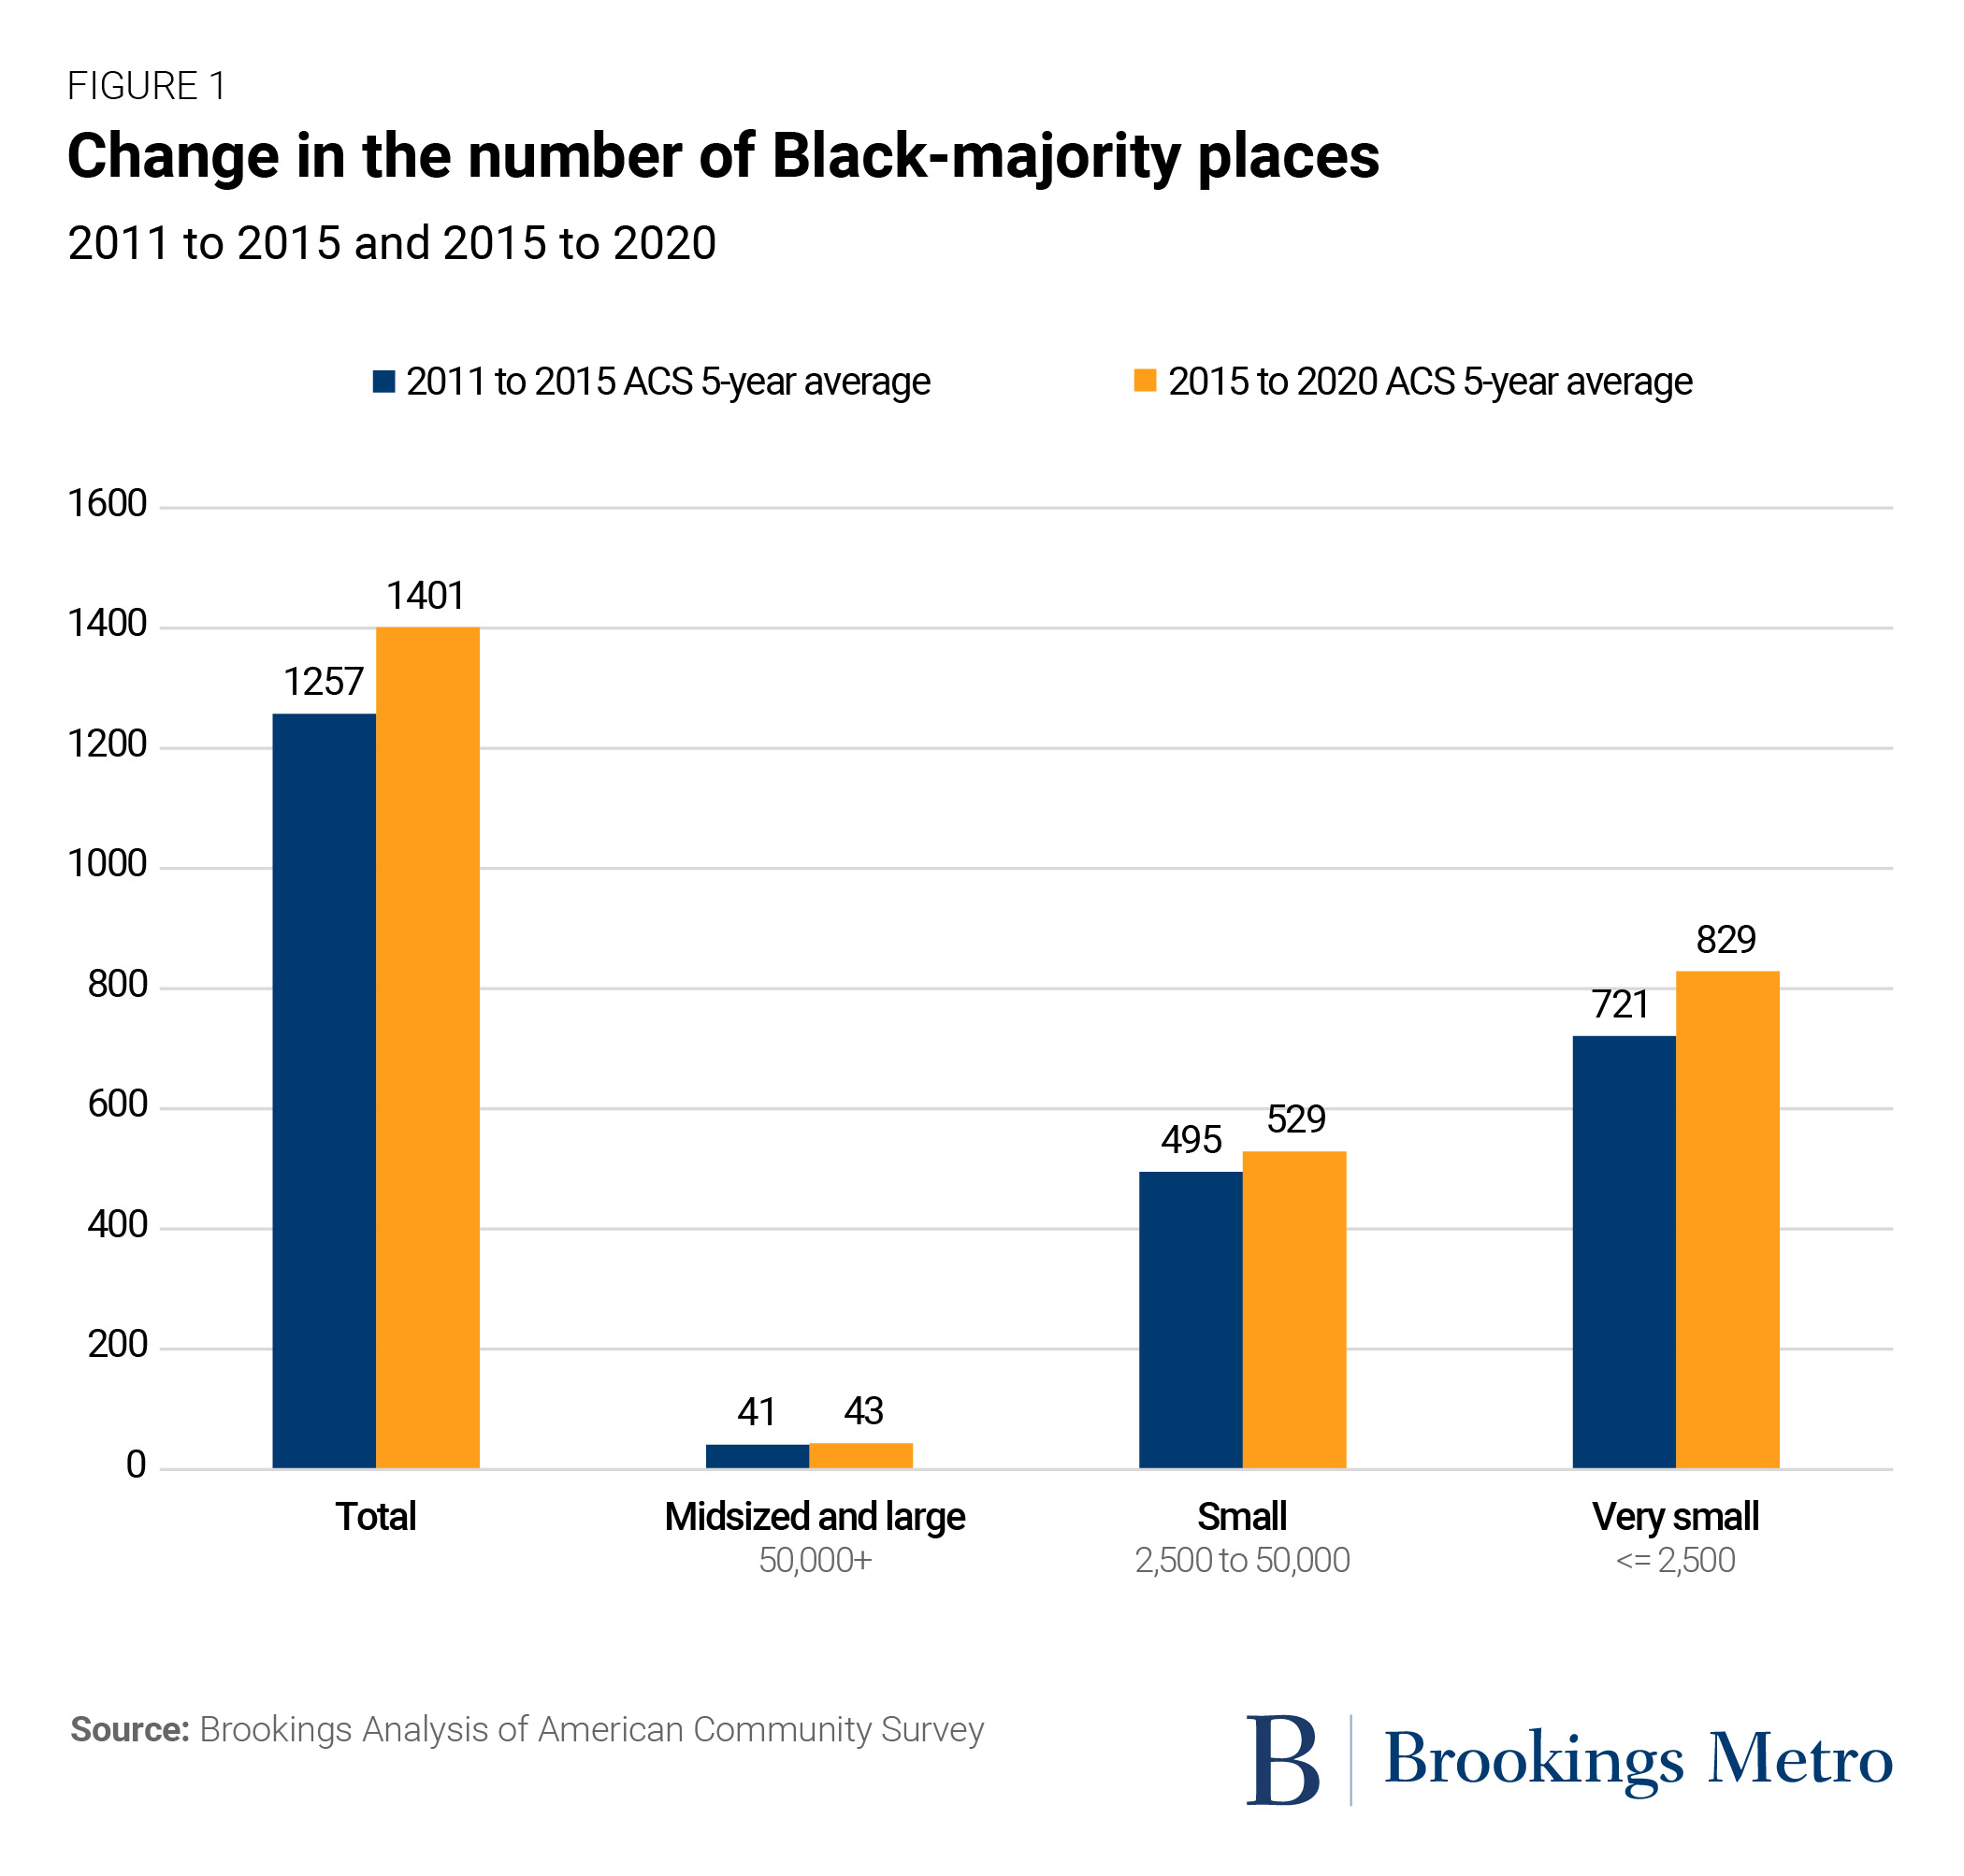
Black-majority places continue to grow
Despite a small decrease in the number of Black residents in larger cities overall, the number of Black people living in Black-majority places continues to grow, increasing by 1.3% overall.2 Reflecting larger trends that saw a population exodus from large metropolitan areas during the pandemic, large and midsized Black-majority cities showed a loss of roughly 200,000 Black residents in total (a 2.28% decrease).3 This was accompanied by aggregate increases in the Black population in small and very small places (7.3% and 12%, respectively). Detroit remains the largest Black-majority city, followed by Memphis, Tenn., Baltimore, and Atlanta.
The aggregate loss of Black residents from larger cities and increases in small and very small places may have more to do with shifts in the relative proportion of Black residents to other racial groups than population changes. While several cities are now Black-majority (Brockton, Mass.; Hempstead, N.Y.; Wilson, N.C.), some notable cities are no longer. For example, Washington, D.C.—the third-largest Black-majority city from 2011 to 2015—is now less than 50% Black (although with its Latino or Hispanic population, it is still one of the largest Black and Latino-majority cities). Similarly, Richmond, Va.—the 10th-largest Black-majority city from 2011 to 2015—is no longer Black-majority. These places and similar cities such as Compton and East Palo Alto, Calif. have been gradually gentrifying, with a mix of white and/or non-Black residents supplanting the Black population.
Black and Latino-majority cities are driving America’s growth
In addition to being centers of cultural diversity and creativity, Black and Latino-majority cities are some of the nation’s greatest economic engines and centers of employment and wealth.
From 2015 to 2020, there were over 5,200 majority-minority U.S. cities—roughly 22% of all places in the Census Bureau’s American Community Survey, which this report draws from. These places included 364 midsized cities, 1,950 small cities, and close to 3,000 very small places. Majority-minority cities tend to be larger, with 17 large cities with over 500,000 residents and 10 very large cities with over 1 million residents. Close to 36 million people living in majority-minority places (73%) reside in cities with populations greater than 50,000.
The scatter plot above shows the percentage of Black and Latino or Hispanic people within each place. In the top left (in yellow) are Latino-majority communities; in the bottom right (purple) are Black-majority communities. The bottom-left quadrant represents majority-minority cities, with orange circles being cities with a combined Black and Latino-majority population and blue circles being majority-nonwhite.
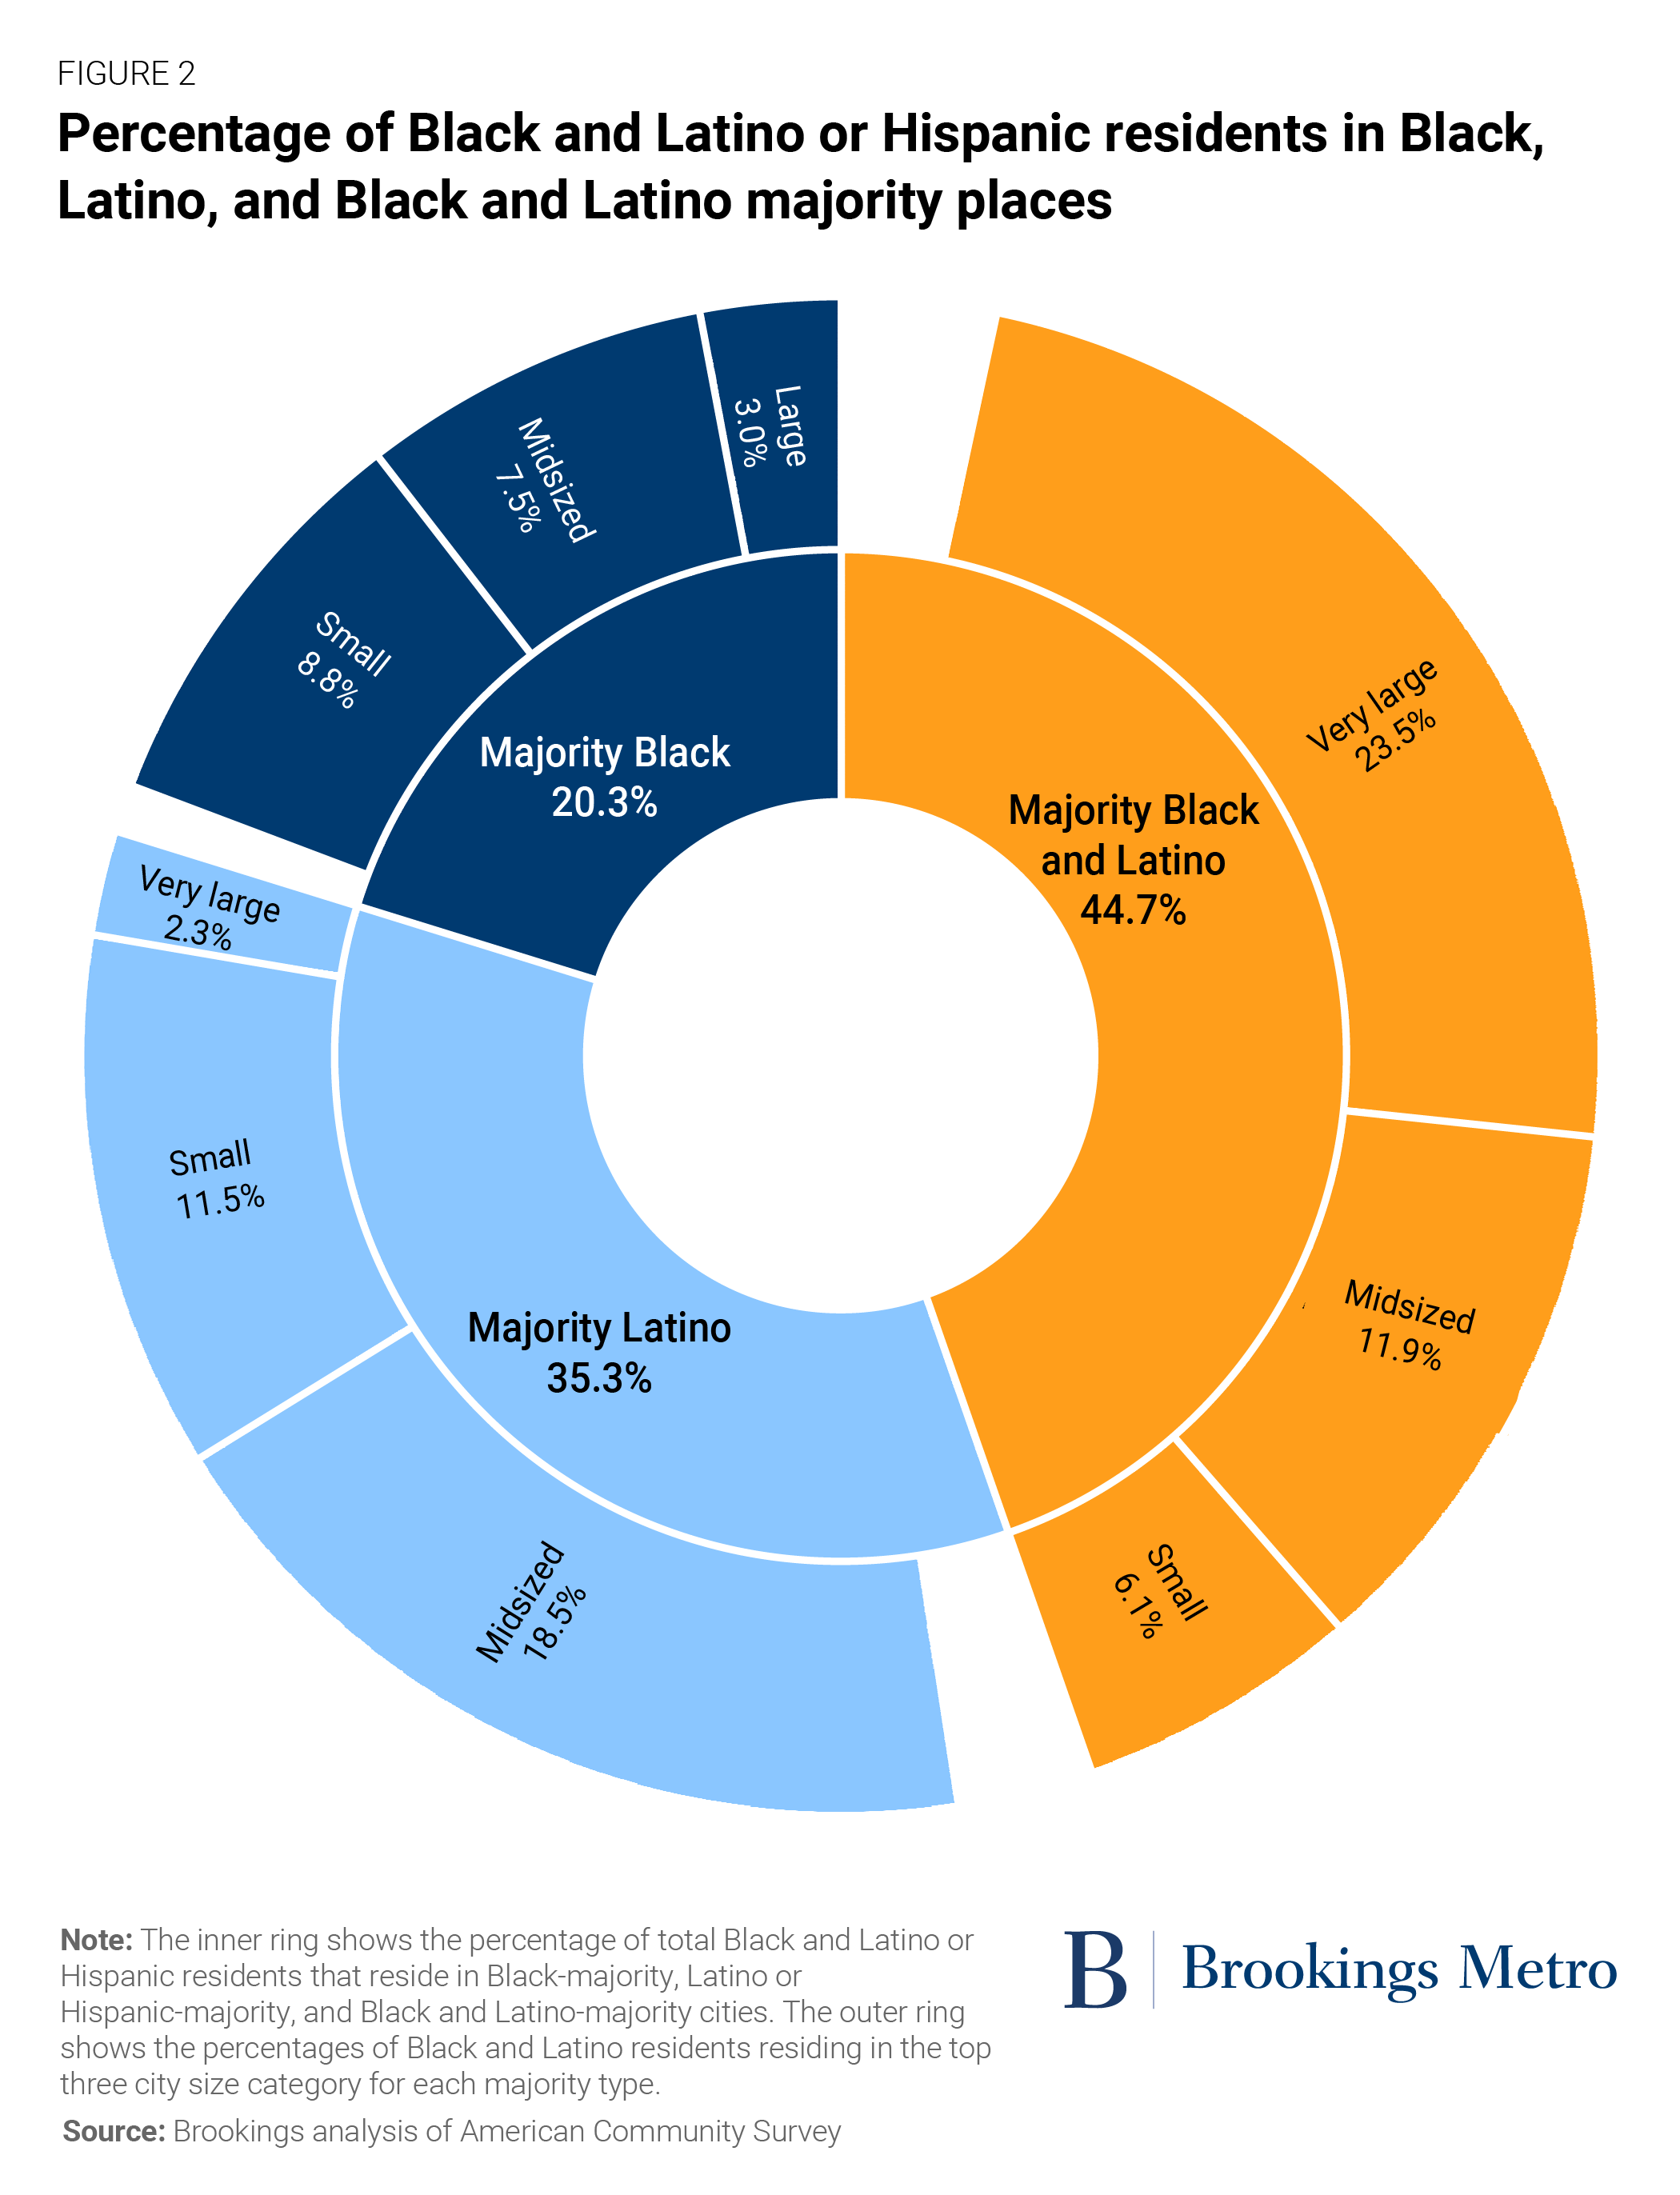
There is a value in naming these places not just as economically dominant U.S. cities, but also as places where racial and ethnic diversity thrive and form the character of the place itself. Figure 2 shows that most Black and Latino or Hispanic residents in majority-minority places are not only living in cities that are majority nonwhite but that also include a broader diversity of racial and ethnic groups. For example, 44.7% of Black and Latino or Hispanic residents in majority-minority cities live in combined Black and Latino-majority cities—a figure that is lost if we focus only on Black-majority or Latino-majority places in isolation.
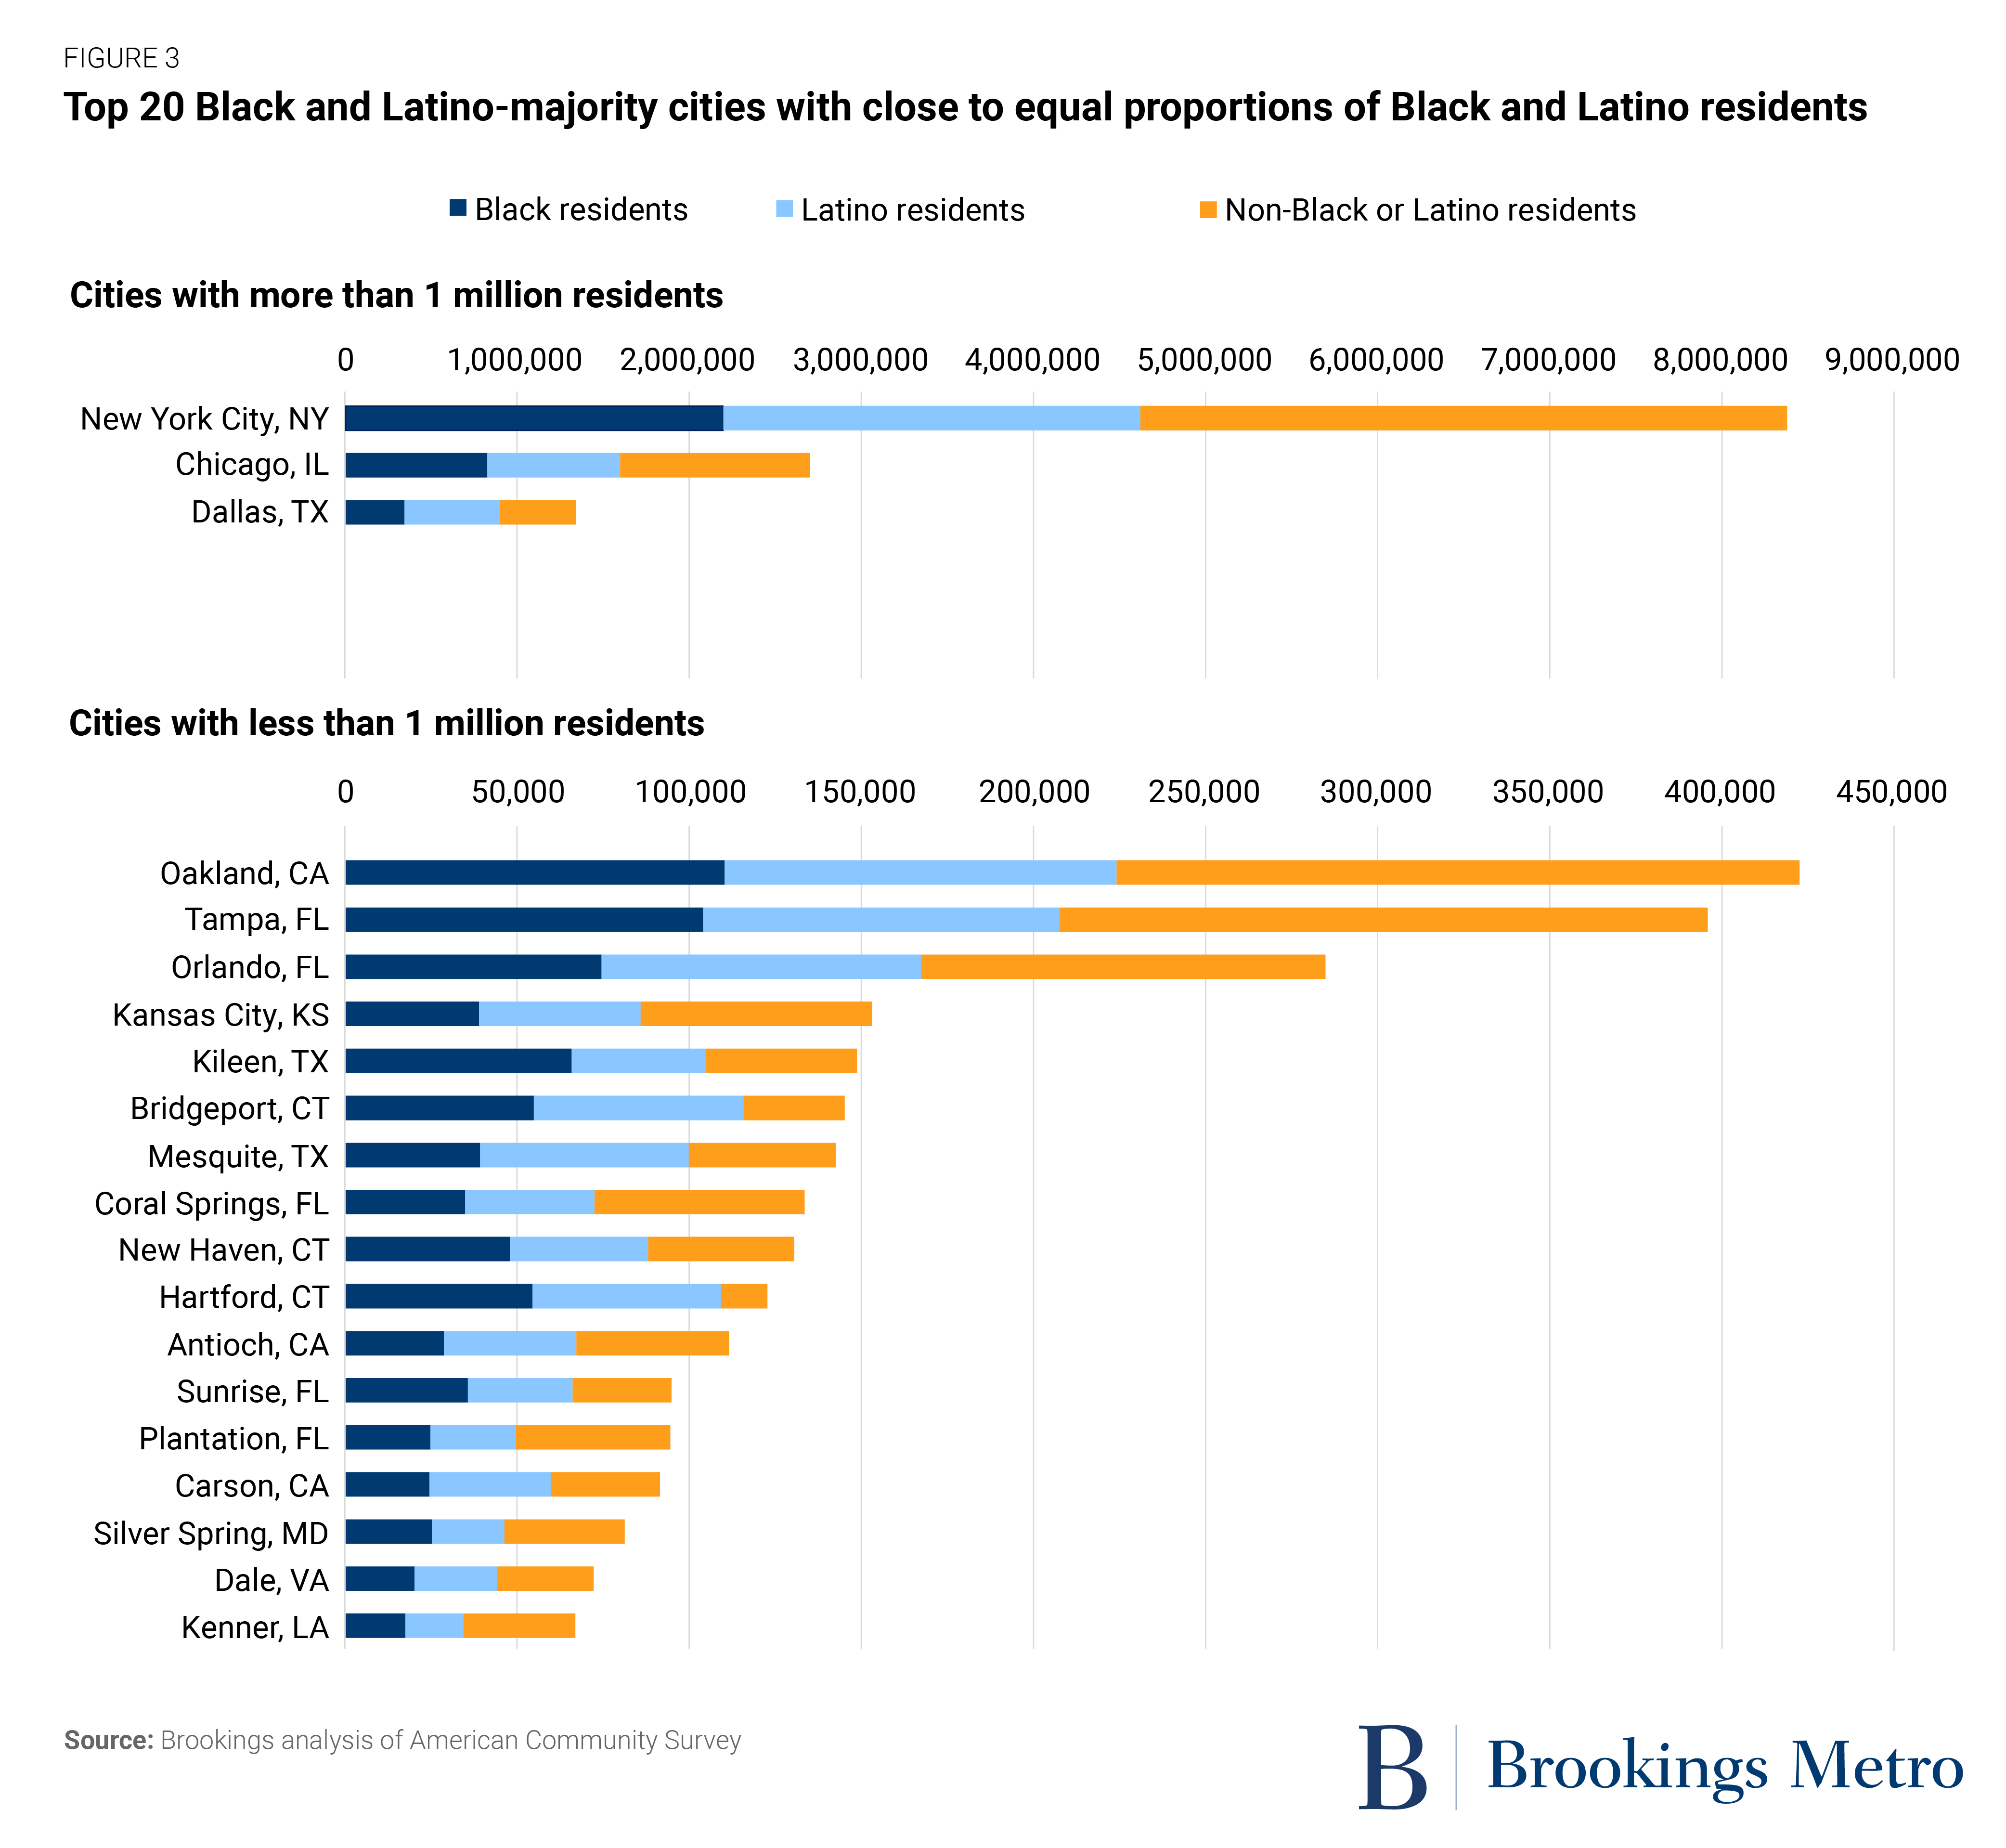
Many of the largest combined Black and Latino-majority cities have near equal proportions of Black and Latino or Hispanic residents—indicating the potential for racial coalitions, and thus greater opportunities to improve local prosperity through shared initiatives. For example, in Figure 3, New York City, Chicago, and Dallas—which have over 1 million residents—also have relatively balanced proportions of Black and Latino or Hispanic residents.
Place-based coalition-building can advance shared interests
While the saying “demography is destiny” can be an overstatement, there is certainly power in numbers in a democracy. For disempowered minority groups of all kinds, coalition-building has been an essential strategy for advancing shared interests.
Related Books
For decades, activists have tried to build coalitions between African American and Latino or Hispanic populations on issues such as housing discrimination, poverty, and workers’ rights. While many organizers and politicos have seen the potential of such coalitions to advance various agendas, getting these populations to join forces has been difficult. For instance, the bombshell recording of three Latino Los Angeles City Council members and a local union president spewing racist language widened the divisions organizers had been trying to bridge and prompted some pundits to ask, “Is the Black and Brown Coalition a Myth?”
“Wakanda Forever” is certainly a work of fiction, but the filmmakers understand the potential of Black and brown coalitions. Mapping America’s most racially diverse cities is the first step to valuing these places and the people inhabiting them—as well as recognizing where racial coalitions could contribute to building more livable and just communities.
Authors

-
Footnotes
- Continuing from the 2017 publication, this report defines “Black-majority” places as those where over 50% of 2015-2020 American Community Survey (ACS) respondents answered that they are “Black or African-American; alone or in combination with one or more other races.” This wide scope ensures that we are capturing Blackness as an array of intersecting racial demographics, rather than just the proportion of people identifying as Black alone. Similarly, to capture the widest possible estimate of minority ethnic or racial respondents, “majority-nonwhite” places are defined by the total proportion of respondents not identifying as “white alone.” For Latino or Hispanic ethnicity, the same level of nuance is not available, so we define Latino-majority places as those where over 50% of ACS respondents answered they are “Hispanic or Latino (of any race).” For combined Black and Latino-majority places, to avoid double counting respondents who identify as both Black and Latino or Hispanic, we use the “non-Hispanic; Black alone” ACS designation.
- We use the census designation “place,” which includes incorporated and unincorporated places to capture a wide array of cities. However, not all U.S. residents live in areas designated as “places.” Thus, we also include six townships we have identified as having no or negligible overlap with “places” and a population density that indicates they are city-equivalents.
- We stratify city and town size using designations of “very small” (less than 2,500 population); “small” (2,500 to 50,000 population); “midsized” (50,000 to 500,000 population); “large” (500,000 to 1 million population), and “very large” (over 1 million population). These differ from Brookings Metro’s usual designations to better fit the data on majority-minority places, which are dominated by smaller-sized cities.
The Brookings Institution is committed to quality, independence, and impact.
We are supported by a diverse array of funders. In line with our values and policies, each Brookings publication represents the sole views of its author(s).