

Newly released Census Bureau data confirm that, four years into an official economic recovery, the nation’s largest metro areas continued to struggle with stubbornly high poverty levels even amid improving employment numbers. An analysis of the 2013 American Community Survey data on residents living below the federal poverty line (e.g., $23,834 for a family of four in 2013) reveals that:
The poor population in the 100 largest metro areas grew by 10 million between 2000 and 2013.
In 2013, 30.8 million people in the nation’s largest metro areas lived below the poverty line, which translated into a poverty rate of 15.0 percent—more than 3 percentage points higher than the 2000 metro area poverty rate of 11.6.
More than two-thirds of the increase in major metro poverty from 2000 to 2013 occurred in suburbs.
Within these regions, the suburban poor population grew more than twice as fast as the urban poor population between 2000 and 2013 (66 percent versus 30 percent). By 2013, the suburbs accounted for 56 percent of the poor population in the nation’s largest metro areas, with the number of poor in suburbs outstripping the urban poor by 3.5 million.
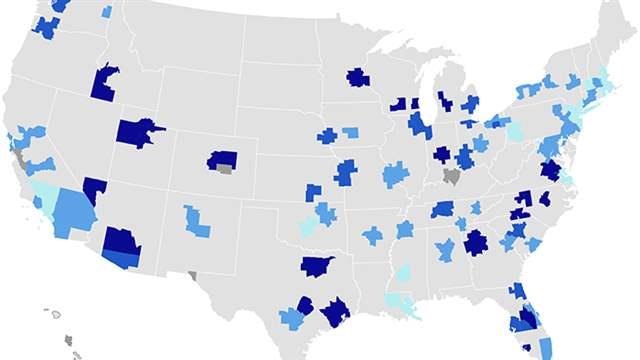
Metro areas that experienced the fastest increases in their suburban poor populations during this time period exemplified the economic challenges facing the country during and before the Great Recession. They included Sun Belt regions hit hard by the collapse of the housing market, such as Austin, Atlanta, Cape Coral, Fla., and Las Vegas-Henderson. Suburban poverty also rose rapidly in Midwestern metro areas that had yet to fully recover from the 2001 downturn before the later, deeper recession set in, such as Grand Rapids, Mich., Indianapolis, and Milwaukee. (For detailed metro area data, see the Appendix.)
Percentage Change in the Suburban Poor Population
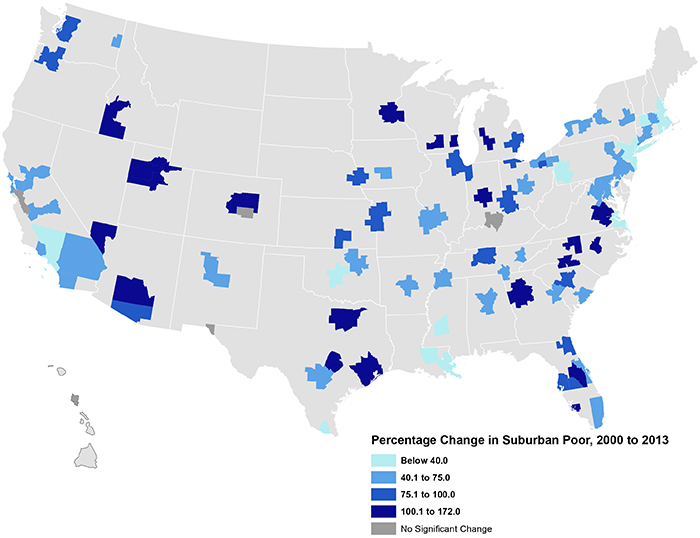
Source: Brookings Institution analysis of Census and American Community Survey data
Almost every major metro area had a larger poor population in 2013 than before the recession.
For the 68 large metro areas for which comparable data are available (see the note on methods below), 67 recorded significantly larger poor populations in 2013 compared to 2007. (The 9 percent increase in Springfield, Mass.’s poor population was not statistically significant.)
Even as the recovery proceeded, most major metro areas did not see poverty fall significantly. Between 2012 and 2013, Colorado Springs was the only metro area that managed a statistically significant decline in its poor population. At the same time, six regions—Albany, Allentown, Pa., Seattle-Tacoma-Bellevue, Spokane, Wash., Winston-Salem, N.C., and Worcester, Mass.—registered a significant uptick in the number of residents living below the poverty line.
The poverty rate in cities dropped slightly from 2012 to 2013.
Taken together, primary cities in the 68 large metro areas registered a significant (albeit small) decline in their poverty rate of 0.5 percentage points between 2012 and 2013. Still, more than one in five residents (21.1 percent) of these cities lived below poverty in 2013.
Of the 68 regions, six metro areas experienced significant declines in their city poverty rates in 2013. In three (Charleston, San Antonio, and San Francisco-Oakland-Hayward), the number of poor residents actually dropped. In Allentown, Pa. and Chattanooga, Tenn., however, the poor population and the city poverty rate rose.
The poverty rate in suburbs remained unchanged from 2012 to 2013.
Suburbs in the 68 metro areas experienced no change in their aggregate poverty rate between 2012 and 2013. It remained stuck at 12.8 percent, much lower than in big cities, but also significantly higher than its pre-recession level (9.6 percent).
Among individual metro areas, only two experienced significant declines in their suburban poverty rates (Deltona, Fla. and Riverside-San Bernardino-Ontario, Calif.), and in only one (Riverside-San Bernardino-Ontario) did the total number of suburban residents living in poverty fall from 2012 to 2013. At the same time, poverty rates rose in the suburbs of Albany and Charleston, and poor populations grew in those two suburban areas and three others—Seattle-Tacoma-Bellevue, Winston-Salem, N.C., and Worcester, Mass.
Four years into the recovery, America’s metro areas—like the nation overall—had achieved only modest progress toward reducing poverty to its pre-recession levels. Where gains did occur, they tended to happen in big cities, further accelerating a long-term trend in the suburbanization of U.S. poverty and the challenges that accompany it.
A Note on Methods
With the release of the 2013 data, the Census Bureau adopted the 2013 metropolitan area statistical definitions as opposed to the 2009 delineations used in previous iterations of the ACS. These new definitions incorporate more recent data on population and commuting patterns that, in some cases, change the counties that make up a metro area.
To compare 2013 data with estimates from Census 2000, we compile county-level data from 2000 to match the 2013 delineations for the 100 largest metro areas. However, a similar approach is not always feasible for more recent estimates from the ACS (e.g., 2007). For metro areas that changed delineations in 2013, many contain counties with populations below 65,000, which means we cannot create comparable metropolitan level estimates using single-year estimates. Therefore, when analyzing trends between 2013 and earlier years of ACS data, we restrict the analysis to metro areas for which we can make “apples to apples” comparisons.
To identify primary cities we select the first named city in the official metropolitan statistical area title and any other city in the title with a population of 100,000 or more. The remainder of the metro area is treated as suburban. For three of the top 100 metro areas—Greenville, S.C.; Harrisburg, Pa.; and Northport, Fla.—the first-named city has a population of less than 65,000. Because estimates for these places are not available in the single-year ACS release, we exclude them for the city/suburban analysis. Thus, of the 100 largest metro areas, we can create comparable metro definitions and city/suburban estimates for 68 regions.
The Brookings Institution is committed to quality, independence, and impact.
We are supported by a diverse array of funders. In line with our values and policies, each Brookings publication represents the sole views of its author(s).