
This Hamilton Project policy paper provides a dozen facts on struggling lower-middle-class families focusing on two key challenges: food insecurity, and the low return to work for struggling lower-middle-class families who lose tax and transfer benefits as their earnings increase. These facts highlight the critical role of federal tax and transfer programs in providing income support to families struggling to remain out of poverty.
Read the full introduction »
Many American families whose incomes are not low enough to officially place them in poverty live in economically precarious situations. This struggling lower-middle class consists of the 30 percent of working-age families with children who have incomes between 100 and 250 percent of the federal poverty level (FPL), or between roughly $15,000 and $60,000, depending on family composition. Though not officially poor, these individuals and families experience limited economic security. One major setback could thrust them into economic chaos.
The struggling lower-middle class encompasses low- and middle-skilled workers whose wages have stagnated in recent decades (Autor, Katz, and Kearney 2008). More than half of these families are headed by married couples, and of these families, roughly half rely on two earners to make ends meet. While lower-middle-class families face many challenges, this policy paper focuses on two pointed struggles—food insecurity and low returns to work due to the design of tax and transfer programs.
Compared to families officially living in poverty, these struggling lower-middle-class families have substantially different characteristics: they have higher rates of marriage, more dual-earning spouses, and higher levels of educational attainment, yet they face some of the same challenges faced by families living in poverty. For example, these households are often unable to meet the most basic requirement of obtaining a sufficient diet. In 2012 more than 24 percent of struggling lower-middle-class children ages twelve to seventeen (or approximately 1.7 million children) lived in a household identified as being food insecure. Many of these families also rely on government programs for income support. In 2012 approximately one in three struggling lower-middle-class families (approximately 3.7 million families) relied on at least one major federal government transfer program. In fact, more than 20 percent of families (approximately 2.4 million families) relied on food stamps in that year alone.
An array of tax and transfer programs—including food stamps, Medicaid, and the Earned Income Tax Credit (EITC)—strengthen the resources available to struggling lower-middle-class families and provide a safety net for families in need. Income support programs undoubtedly improve the economic well-being of families on the cusp of poverty, but they often come with unintended consequences. One major problem, highlighted in this paper, is the implicit tax on families who receive reduced benefits as a result of higher earnings. Transfer program benefits phase out as family earnings rise, which reduces the return to work and makes it difficult for these families to work their way firmly into a better economic life.
A founding principle of The Hamilton Project’s economic strategy is that long-term prosperity is best achieved by fostering economic growth and broad participation in that growth. This principle calls for economic security among a thriving and prosperous middle class, which has been a long-celebrated feature of our nation’s social and economic fabric. In this spirit, we offer “A Dozen Facts about America’s Struggling Lower-Middle-Class” to bring attention to who these families are, to highlight two particular challenges facing this broad group of American society, and to set up a framework to consider what policies would be appropriate for strengthening their economic security and well-being.
These facts focus on those who are above the federal poverty level, and yet are still quite economically insecure, relying on government transfers, facing high levels of anxiety about being able to feed their families, and facing extremely high marginal tax rates as they try to work themselves securely away from poverty.
Chapter 1 describes the group we define as made up of struggling lower-middle-class families. Chapter 2 focuses on the challenge of food insecurity and provides information about the nation’s most-important and wide-reaching government program focused to address this issue, the Supplemental Nutritional Assistance Program (SNAP). Chapter 3 presents evidence about the relevant set of tax and transfer programs facing the struggling lower-middle class, highlighting how this panoply of programs can inadvertently make the climb into middle-class security more difficult.
Chapter 1: A Snapshot of Struggling Lower-Middle-Class Families
Many families in America’s struggling lower-middle class—defined to include those with income between 100 and 250 percent of the federal poverty level, or between roughly $15,000 and $60,000, depending on family size and composition—live in economically precarious situations. Though not officially poor, these families experience limited economic security; one major setback in income could push them into poverty.
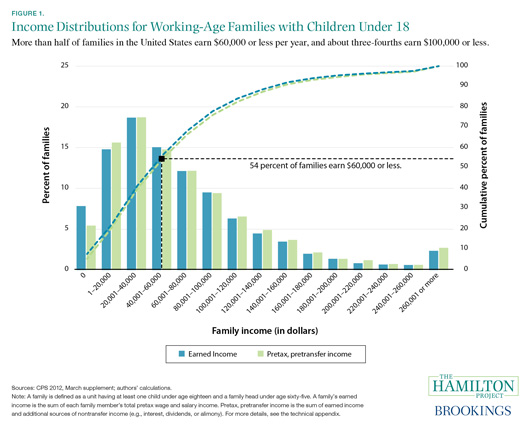
1. More than half of families in the United States earn $60,000 or less per year.
More than half of America’s working-age families with children under age eighteen (approximately 20.1 million families) have annual incomes of $60,000 or below. This is true whether we consider only earned wages and salary, or if we use a broader definition of pretax, pretransfer income, which also includes some unearned sources of income, such as investment income and alimony payments. Figure 1 shows the distributions for working-age families by (1) earned income, and (2) pretax, pretransfer income. (Neither of these measures includes taxes or transfer payments.).
The blue and green dotted lines in figure 1, corresponding to the right axis, show the cumulative share of families with income under various thresholds. Around 40 percent of families earn $40,000 or less each year, 54 percent of families earn $60,000 or less (demonstrated by the black dotted line), and 76 percent of working-age families earn $100,000 or less. For working-age families with children, earning over $100,000 is the exception, not the rule.
The vertical bars in figure 1, corresponding to the left axis, show the percent of families that fall within various income ranges. About 15 percent of working-age families (or approximately 5.6 million families) earn between $1 and $20,000 a year, while 19 percent of families (approximately 7.1 million families) earn between $20,001 and $40,000. On the opposite end of the distribution, fewer than 3 percent of families earn $260,001 or more.
2. Nearly half of families in the United States live below 250 percent of the federal poverty level.
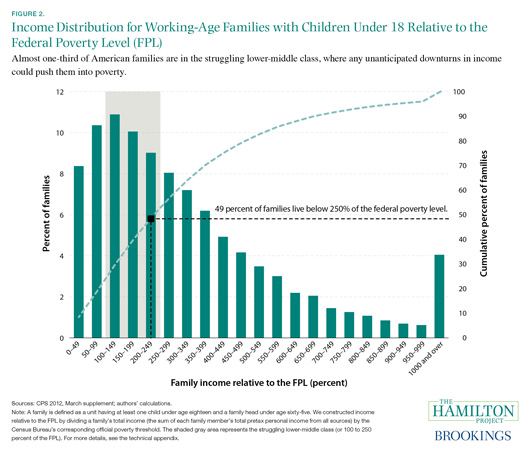
Nearly one in five American working-age families with children lives in poverty, officially defined as being below 100 percent of the federal poverty level (FPL). Approximately 30 percent of families have incomes that place them between 100 and 250 percent of the FPL. Federal poverty thresholds vary by family size and composition, meaning that families with the same income, but with different household compositions, can be in different positions relative to the FPL.
The U.S. Census Bureau defined the FPL in 2012 for a family made up of one adult and one child to be $15,825 (250 percent of the FPL for this family was therefore $39,563); for a family with two adults and one child, the FPL was $18,480 (250 percent of the FPL was $46,200); for a family with two adults and two children, the FPL was $23,283 (250 percent of the FPL was $58,208); and for a family with two adults and three children, the FPL was $28,087 (250 percent of the FPL was $70,218) (U.S. Census Bureau 2012).
These families’ proximity to the poverty line means that any unanticipated downturns in income could push them into poverty. For this reason, we could reasonably consider these families to be the struggling lower-middle class. Figure 2 illustrates the income distribution relative to the FPL for working-age families with children under age eighteen. Together, these statistics (represented by the dotted black line) reveal that nearly half of American families live either in poverty or in the struggling lower-middle class.
3. Struggling lower-middle-class families are almost equally headed by single parents and married couples.
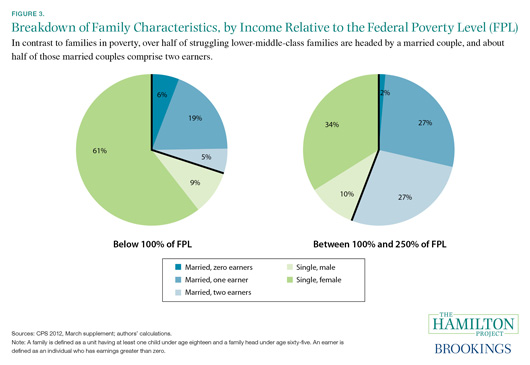
As illustrated in figure 3, household composition of families in the struggling lower-middle class varies substantially from the household composition of families in poverty. Of families with income below the federal poverty level (FPL) (approximately 7.1 million families), 70 percent are headed by a single parent (61 percent are single female parents), 24 percent are headed by a married couple with one or two earners, and 6 percent are headed by a married couple with no earners.
The composition of the struggling lower-middle class—defined here as working-age families with children under age eighteen whose income places them between 100 and 250 percent of the FPL—is markedly different from families in poverty in terms of marriage and presence of earners. Of families in the struggling lower-middle class (approximately 11.4 million families), 44 percent are headed by a single parent (34 percent are single female parents), 27 percent are headed by a single-earner married couple, another 27 percent are headed by a dual-earner married couple, and 2 percent are headed by a married couple with no earners.
4. Nearly one out of two families in the struggling lower-middle class is headed by an adult who has attended college.
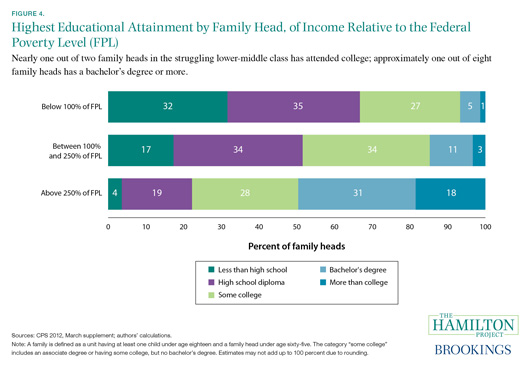
College attainment differs markedly by poverty status. As illustrated in figure 4, 33 percent of household family heads below 100 percent of the federal poverty level (FPL) attended at least some college, although just 6 percent of those family heads have a bachelor’s degree or higher. Among household family heads with income between 100 and 250 percent of the FPL, 48 percent have attended some college, and14 percent have a bachelor’s degree or higher.
In stark contrast to those living at or below 250 percent of the FPL, 77 percent of household family heads above 250 percent of the FPL attended at least some college, and about half have a bachelor’s degree or higher. Only a very small share of this group (4 percent) did not earn a high school diploma.
5. Nearly one-third of struggling lower-middle-class families rely on income support from a government program.
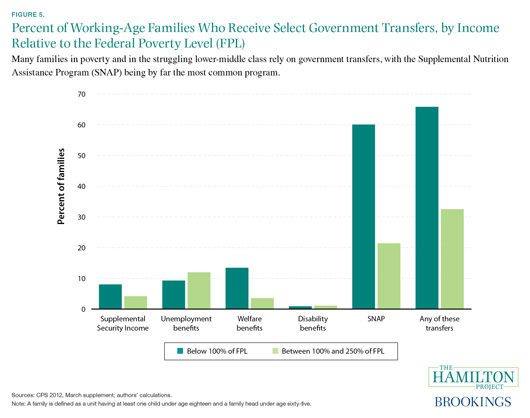
A majority of working-age families with children living below the federal poverty level (FPL) receive federal transfer programs. Of the families that rely on at least one government transfer program, almost all receive food stamp benefits through the Supplemental Nutrition Assistance Program (SNAP). Federal transfer programs are not just for the very poor, however. As shown in figure 5, approximately 33 percent of families with incomes between 100 and 250 percent of the FPL depend on at least one government transfer program for income support. SNAP is by far the most prevalent transfer program for this group, with 21 percent of these families (approximately 2.4 million families) depending on SNAP for food assistance at some point during the year. It is important to note that families only receive benefits when their income is low, such as during spells of unemployment, but not in months when their income is higher than SNAP’s income threshold of 130 percent of the FPL. This highlights the role of SNAP in supporting families through temporary downturns, and the short-term dependence on the program for many beneficiaries.
Figure 5 shows only the share of families who depend on various transfer programs in a single year; a much larger share will rely on transfers at some point in their lives. For example, while in any given year most Americans will not have to rely on food stamps—approximately 17 percent of children under age eighteen participated in SNAP in 2007 before the Great Recession—between the ages of twenty and sixty-five, more than half of Americans will receive SNAP benefits (Leftin and Wolkwitz 2009; Rank and Hirschl 2005; U.S. Census Bureau 2008). In addition to these transfer programs, tax credits, such as the Earned Income Tax Credit (EITC) and the Child Tax Credit (CTC), are important sources of income support for low- to moderate- income families. These two programs transferred 59 billion and nearly 57 billion dollars, respectively, in 2012 (The Joint Committee on Taxation 2013).
Chapter 2: The Struggling Lower-Middle Class, Food Insecurity, and the Supplemental Nutrition Assistance Program (SNAP)
Similar to families living in poverty, many families in America’s struggling lower-middle class are not comfortably able to afford a sufficient diet. Food insecurity in households with children is widespread, existing in every state. The Supplemental Nutrition Assistance Program (SNAP) serves a fundamental role in mitigating food insecurity and providing food assistance to both poor and struggling lower-middle-class families.
6. Roughly 40 percent of children in the struggling lower-middle class experience food insecurity or obesity, or both.
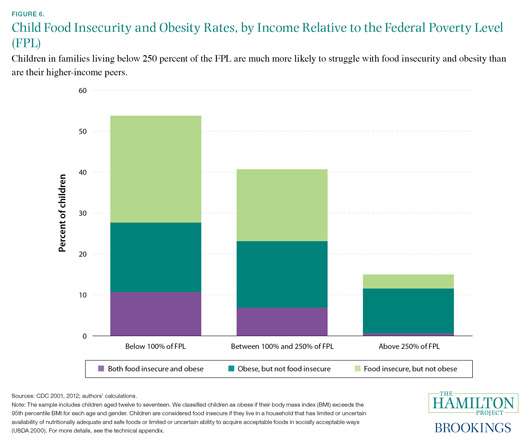
Children from low-income households have high rates of food insecurity or obesity, or both. The U.S. Department of Agriculture (USDA) classifies a household as food insecure when it has limited or uncertain availability of nutritionally adequate and safe foods or limited or uncertain ability to acquire acceptable foods in socially acceptable ways (USDA 2000).
Figure 6 illustrates the differing nutritional circumstances of children based on their family’s income. More than 10 percent of children in households below the federal poverty level (FPL) are both food insecure and obese, and more than 50 percent have at least one of these conditions. Unfortunately, children in the struggling lower-middle class—children whose family income places them between 100 and 250 percent of the FPL—more closely resemble children in poverty than they do children in higher-income groups (above 250 percent of the FPL). More than 24 percent of children (or approximately 1.7 million children) in the struggling lower-middle class are food insecure and approximately 23 percent are obese; almost 7 percent of these children simultaneously face both obesity and food insecurity. In stark contrast, approximately 85 percent of children (or more than 9.3 million children) living above 250 percent of the FPL face neither challenge. These statistics highlight the diverging nutritional conditions of children by socioeconomic status.
Food insecurity, especially among children, is particularly worrisome given the potential negative effects of hunger during childhood. Indeed, literature in economics and medicine has documented the importance of early-life events, such as nutrition, on adult outcomes such as earnings and mortality (Almond and Currie 2011). Almond, Hoynes, and Schanzenbach (2011) found that during the initial rollout of the program in the 1960s children whose families had access to food stamps while they were in utero and during their childhoods had higher birth weight overall. Recent academic research has also shown that individuals who had access to food stamps had markedly better long-run health (as measured by self-reported health status, obesity, and reported diagnoses of diabetes and other chronic conditions) than individuals who did not have access to food stamps (Hoynes, Schazenbach, and Almond 2012). Among women, this study also found that access to food stamps during childhood improved adult economic outcomes, ranging from increased likelihood of attaining a high school diploma and higher lifetime earnings, to reduced likelihood of being reliant on federal safety-net programs during adulthood.
7. More than one in five children faces food insecurity in thirty-seven states and the District of Columbia.
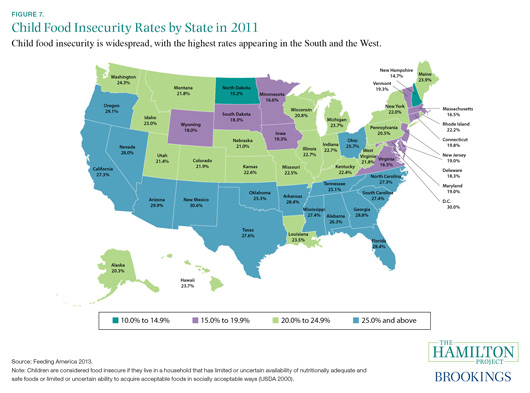
Food insecurity exists everywhere in the United States, with more than 16 percent of individuals living in households reporting conditions indicating food insecurity. The share of children living in food-insecure households, approximately 22 percent, is even higher. The highest rates of child food insecurity in the country are found in New Mexico and Washington, DC, where roughly three out of ten children live in households that are food insecure. Even in North Dakota, the most food-secure state in the country, one in ten children is food insecure. Furthermore, in thirty-seven states and the District of Columbia more than one child in five is food insecure, as represented in figure 7.
There are regional patterns with regard to child food insecurity: the most food-insecure states are consistently located in the South and the West. Indeed, with the exception of Ohio, all of the states with child food insecurity rates above 25 percent are located in these two regions.
8. Nearly 90 percent of Supplemental Nutritional Assistance Program (SNAP) recipients live in a household with at least one child, one disabled individual, or one elderly individual.
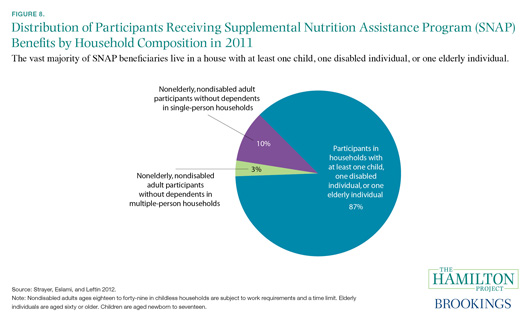
The Supplemental Nutritional Assistance Program (SNAP) caseload overwhelmingly comprises families with at least one child, one disabled individual, or one elderly individual. As illustrated in figure 8, 87 percent of SNAP participants in 2011 lived in such a household. The remaining 13 percent of participants lived either in single-person or multiple-person households that did not include at least one child, one disabled individual, or one elderly individual.
SNAP participants who are aged eighteen to forty-nine, who are not disabled, and who do not live with children are commonly referred to as able-bodied adults without dependents, or ABAWDs; they constitute roughly 10 percent of SNAP participants (Lee 2013). Most, but not all, of these ABAWDs are included within the 13 percent of participants in figure 8. (ABAWDS can be in the 87 percent if they themselves are able-bodied, aged eighteen to forty nine, and live with an elderly or disabled person, but with no children.) SNAP program rules typically require able-bodied adults aged eighteen to forty-nine to satisfy work requirements, however, and impose a time limit on the receipt of benefits for those who are not employed or in a work program at least half time. Some of these policies can be suspended for areas with high unemployment, and as a result, were suspended during the Great Recession in most of the country, but have begun to be reinstated throughout the country as the economy recovers.
Many of the participants (nearly 37 percent) live in single-parent households with at least one child, but a sizable share (more than 18 percent) live in households comprising married adults with at least one child (Strayer, Eslami, and Leftin 2012). In the year 2011 approximately 82 percent of SNAP participants lived at or below the FPL in the month of SNAP receipt, and these individuals received more than 91 percent of all monthly SNAP benefits (ibid.). In the same year, 45 percent of SNAP participants were children, and 9 percent were elderly individuals. SNAP’s benefit expenditures were proportional, with children receiving 44 percent of prorated SNAP benefits and elders receiving 7 percent (ibid.).
Chapter 3: The Struggling Lower-Middle Class, Taxes, and Transfer Programs
A variety of government tax and transfer programs augment the resources available to struggling lower-middle-class families. The phase-out of these transfer programs, however, makes it difficult for these families to work their way into a more stable economic life.
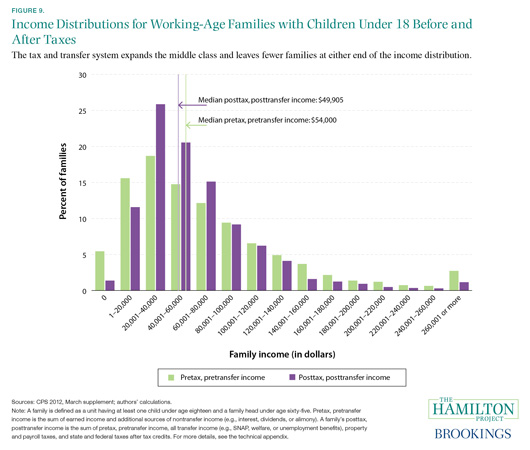
9. America’s tax and transfer system expands the middle class.
In the United States the system of taxes and transfers plays an important role in determining the amount of income a family ultimately has at its disposal. Taxes (such as federal and state income taxes, payroll taxes, and property taxes) typically reduce family income, but the federal tax system also provides credits (such as the Earned Income Tax Credit [EITC] and the Child Tax Credit [CTC]) that can increase the cash income for qualifying families.
Transfer program and targeted tax benefits protect families against economic hardship and supplement low earnings, which for some families could be zero. Some transfer programs provide cash payments, such as Temporary Assistance for Needy Families (TANF), and Supplemental Security Income (SSI); others are in-kind programs, paying a nonmonetary benefit, such as a food voucher in the case of the Supplemental Nutrition Assistance Program (SNAP).
Figure 9 illustrates how the tax and transfer system changes the distribution of income for working-age families with children. Before taxes and transfers, about 5 percent of families have no income, but this share falls to about 1 percent after accounting for taxes and transfers. Similarly, the share of families with income between $1 and $20,000 falls from over 16 percent to about 12 percent. On the other end of the income distribution, there are fewer families in all of the income groups at $80,001 and above. The direct effect of the tax and transfer system is to expand the middle class by compressing the number of families located at either end of the income distribution and raising the number of families in the middle range.
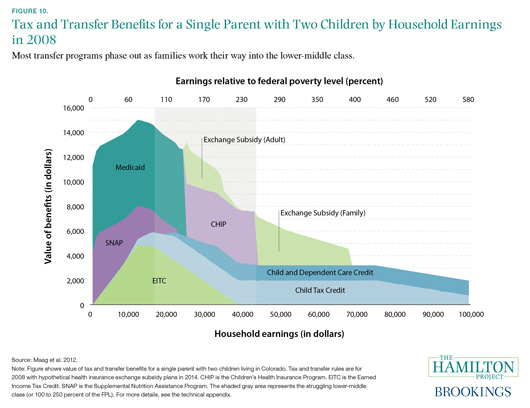
10. Struggling lower-middle-class families depend on an array of tax and transfer benefits.
Families living in poverty and among the struggling lower-middle class have access to a number of income-support programs. The nature and level of support of these programs changes throughout the income distribution. For families below the federal poverty level (FPL), the major transfer programs are designed to provide for basic needs such as food and health care. In addition, the Earned Income Tax Credit (EITC) is designed to subsidize earnings. At higher levels of income, families have access to child-related tax credits and health insurance exchange subsidies implemented by the Affordable Care Act (ACA).
As shown in figure 10, struggling lower-middle-class families benefit from the EITC, Medicaid, and the Supplemental Nutritional Assistance Program (SNAP), among other tax and transfer benefits. For the single-parent family with two children illustrated in the figure, the total value of benefits falls from about $14,000 just below the FPL to about $7,500 at 250 percent of the FPL.
While these programs undoubtedly improve the economic security of low-income families, the programs’ impacts are not included in the official measure of poverty. A family’s official poverty status is based on pretax income, and thus does not include benefits received through the EITC or the Child Tax Credit (CTC), nor does it include in-kind transfers, such as food stamp benefits, Medicaid, or housing assistance. Consequently, official poverty estimates produced by the U.S. Census Bureau reveal little to policymakers about the effect of these programs on poverty and near-poverty rates. Additional measures of poverty are needed to reveal the impact of the social safety net on economic well-being in the United States (see Blank and Greenberg 2008; and Meyer and Sullivan 2012).
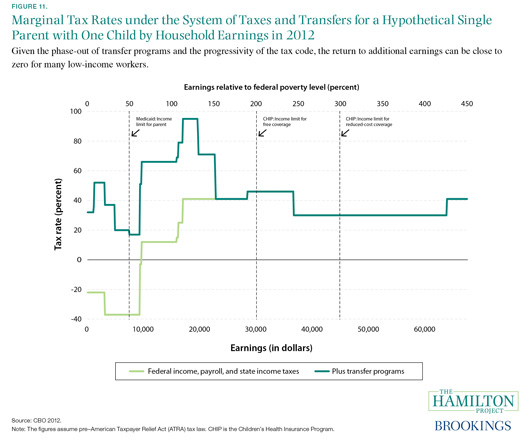
11. A low-income, single parent can face a marginal tax rate as high as 95 percent.
Marginal tax rates for low- and moderate-income families can be exceptionally high. Marginal tax rates are the taxes paid on additional work or investment. Effective marginal tax rates are determined by taxes paid, tax benefits received, and tax and transfer benefits lost due to extra income. For instance, as low- and moderate-income families see an increase in earnings, their transfer payments (such as Medicaid) and tax credits (such as the Earned Income Tax Credit [EITC]) are clawed back or phased out. This can raise effective marginal tax rates and make the after-tax return to additional earnings quite low.
In the absence of transfers, marginal tax rates tend to be low—and often negative—for low-income families. Through personal deductions or exemptions, the federal income tax code allows low-income families to exclude a substantial share of their income from taxation. In addition, refundable tax credits—tax credits that can drop a family’s tax bill below zero—often make marginal tax rates negative. For the hypothetical single parent with one child illustrated in figure 11, marginal tax rates including taxes, but not accounting for transfers, are around –40 percent, indicating that these taxpayers would receive an additional 40 cents for every extra dollar they earn. These marginal tax rates turn positive only at earnings of approximately $10,000.
The gap between the light and dark green lines in figure 11 shows the effects of transfer phase-outs on this particular taxpayer’s marginal tax rate. At the Medicaid limit, denoted by the first vertical black line, the phase-out of transfer benefits increases the taxpayer’s marginal tax rate by about 60 percentage points—from around –40 percent to about +20 percent. For this taxpayer, the impact of transfer phase-outs is dramatic and could discourage additional work that moves her earnings beyond roughly $8,000. Depending on family circumstances and program eligibility, there is a wide range of marginal tax rates facing low- and moderate-income households. As shown in this figure, a low-income, single parent can face a marginal tax rate as high as 95 percent.
Academic studies illustrate the complex impacts of tax and transfer programs on worker behavior. For example, the EITC has been shown to provide meaningful incentives for single parents with dependent children to work (Eissa and Liebman 1996; Meyer and Rosenbaum 2001). At the same time, however, the EITC tends to provide a disincentive for married mothers with children to work, since the combined income of a wife and husband reduces (and sometimes eliminates) a family’s EITC benefit (Eissa and Hoynes 2004a, 2004b).
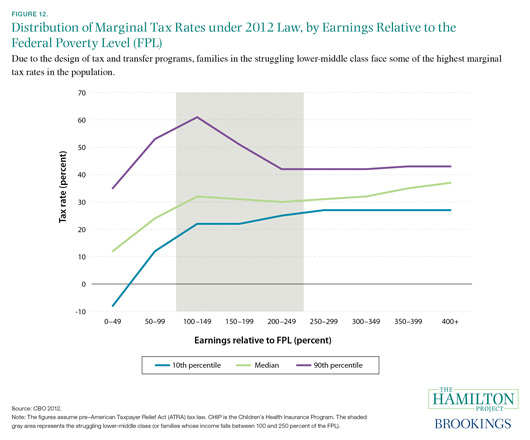
12. The highest marginal tax rates tend to fall on the struggling lower-middle class.
Marginal tax rates—the tax collected on an additional amount of income or earnings—are often highest for families at or just above the federal poverty level (FPL). Low- to moderate-income families see an increase in marginal tax rates as their transfer payments (such as Medicaid) and tax credits (such as the Earned Income Tax Credit [EITC] are clawed back or phased out.
As shown in figure 12, marginal tax rates are highest for those families with income at or above the FPL. For example, 10 percent of families with earnings between 100 and 149 percent of the FPL have marginal tax rates of 60 percent or higher—meaning that these families keep 40 cents or fewer of each additional dollar they earn. For the poorest families and for those with incomes above 250 percent of the FPL, the top 10 percent of marginal tax rates fall around 35–45 percent.
Figure 12 also illustrates that there is far more variation in marginal tax rates for families near the FPL than for families farther from it. This disparity is primarily due to the varying eligibility for transfer programs. Families that qualify for transfer programs will often lose their benefits if they earn additional income, while ineligible families face lower marginal tax rates because they do not have any benefits to lose. As a result, families with earnings higher up on the income distribution, who as a group tend to be ineligible for transfer programs, experience less variation in marginal tax rates.
High marginal tax rates for some low-income families are a byproduct of safety-net programs that aim to provide means-tested benefits—benefits aimed at low-income families—to the most vulnerable households. An unfortunate consequence is that some low-income households have little incentive to work because they risk losing significant benefits as they move up the income distribution.
High marginal tax rates can make the after-tax return to additional earnings quite low. This low return to work means that, ultimately, families with high marginal tax rates have limited ability to improve their own well-being.
Conclusion
Compared to families living in poverty, families in the struggling lower-middle class are more likely to be headed by a married couple, to have a second adult worker, and to be headed by an individual with some college education. Those in the struggling lower-middle class still face many of the same challenges as those in poverty, however, including food insecurity and a reliance on government programs for income support.
There are programs in place to assist the struggling lowermiddle class. In fact, nearly one-third of these families rely on at least one government transfer program for income support in any given year. For both the struggling lower-middle class and families living in poverty, the Supplemental Nutritional Assistance Program (SNAP) is by far the most prevalent program. Low-income families benefit from an array of tax credits and transfer programs, such as the Earned Income Tax Credit (EITC) and Medicaid. The phase-out of these programs at near-poverty levels of income leads to high marginal tax rates on low- to moderate-income families, however, lessening the return to work and making economic security more difficult for working families to achieve.
This policy paper presents a snapshot of America’s struggling lower-middle-class families and highlights their challenges with food insecurity and with barriers to work that are inadvertently created through the tax and transfer system. An important next step is to identify policies that can improve the well-being of these families.
Related Content


Related Books


Authors


The Brookings Institution is committed to quality, independence, and impact.
We are supported by a diverse array of funders. In line with our values and policies, each Brookings publication represents the sole views of its author(s).