The following is Part III of the 2017 Brown Center Report on American Education.

School discipline is a balancing act. Whether deciding school policy for an upcoming year or debating the consequences for an individual student arising from a single incident of misbehavior, educators juggle several factors: striking a balance between an orderly campus and a welcoming climate conducive to learning; protecting the safety of all students while recognizing the rights of individuals; treating students equitably but, when warranted, considering individual circumstances that influence behavior; and, in concert with every school’s educative mission, convincing students who are behaving badly to correct their behavior while also standing ready to banish anyone who interferes with the learning of others. Getting discipline right is an integral characteristic of a good school. Getting it wrong can be a disaster.
The U.S. Department of Education’s Office for Civil Rights caused a stir in 2014 when it released data showing that black students are suspended and expelled at three times the rate of white students. Two years earlier, a report from the Civil Rights Project at UCLA documented large racial disparities in California school districts’ disciplinary practices. The report noted that black students are disproportionately dealt the harshest exclusionary penalties—expulsions and out-of-school suspensions.1 In 2014, the California state legislature passed a state law (AB420) prohibiting public schools from expelling any student or suspending students in third grade or earlier grades for the offense of “willful defiance”—a catchall category of offenses (including disruption) ranging from shouting obscenities at a teacher to forgetting to bring a pencil to class. At the time of AB420’s signing by Governor Jerry Brown, willful defiance was the most common offense for out-of-school suspensions, particularly for minority students.2 However, its use was already in decline, as several districts, including Los Angeles and San Francisco, had previously taken steps to limit expulsions and out-of-school suspensions, regardless of the grade, for willful defiance.3
In 2015, just a few days after AB240 took effect, the California Department of Education issued a press release documenting sharp declines in suspensions during the previous two school years.4 The Department had been providing workshops and other resources on alternatives to out-of-school suspensions, with restorative justice and positive behavioral support programs leading the list.
California schools’ disciplinary policies are in transition. That offers a unique opportunity to examine the relationship between race and discipline in K-12 education. The study below is a correlational study. It takes no position on out-of-school suspensions or the interventions proposed as alternatives. The data cannot test causal hypotheses or determine whether students’ suspensions are just or unjust. The study examines how California schools have changed their practice in regards to out-of-school suspensions and investigates the characteristics of schools associated with both high and low suspension rates of black students.
STATE TRENDS
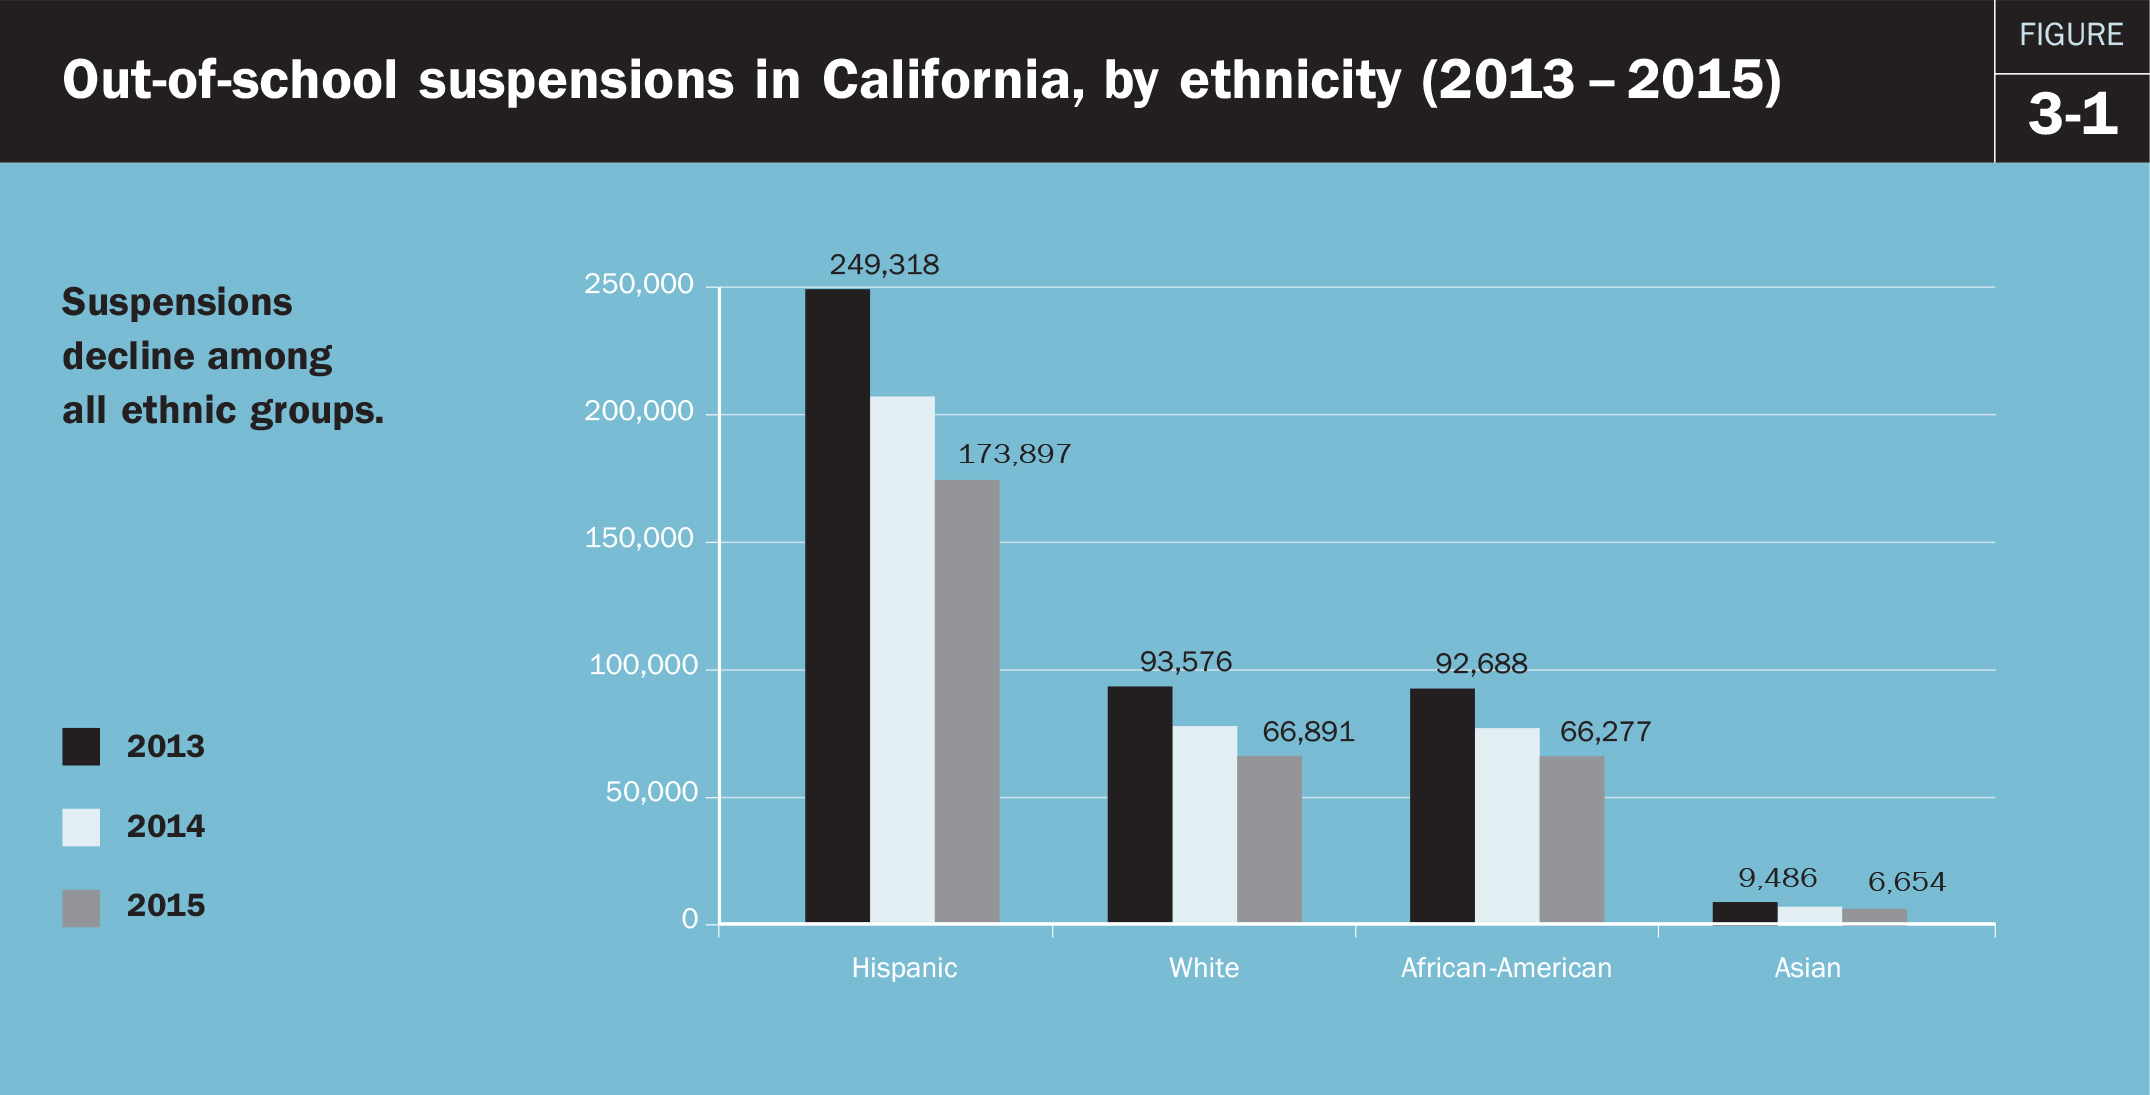
From 2013 to 2015, out-of-school suspensions declined dramatically in California. Figure 3-1 displays statistics for the state’s four largest ethnic groups, showing the number of suspensions for each group. In this case, a suspension is an event leading to the out-of-school suspension of a student, and even though the student may have committed multiple infractions, the event is counted as one incident. Suspensions of Hispanic students fell from 249,318 in 2013 to 173,897 in 2015, a decline of 30.3%. Suspensions of white (-28.5%), black (-28.5%), and Asian (-29.9%) students declined by similar amounts. Note that the chart begins with 2012 data. The statewide decline in suspensions began a year earlier for all four groups, falling by 12%-13% from 2011 to 2012.
Disparities associated with race or ethnicity cannot be gleaned from simple counts of suspensions. Figure 3-2 reports the ratio of suspensions to enrollment. In 2015, Hispanic students made up over half of California’s K-12 enrollment, with 3.3 million students (53.6%). White students constituted 24.6% of enrollment (1.5 million), followed by Asian students, 8.8% (about 550,000 students), and black students, 6.0% (about 370,000 students).5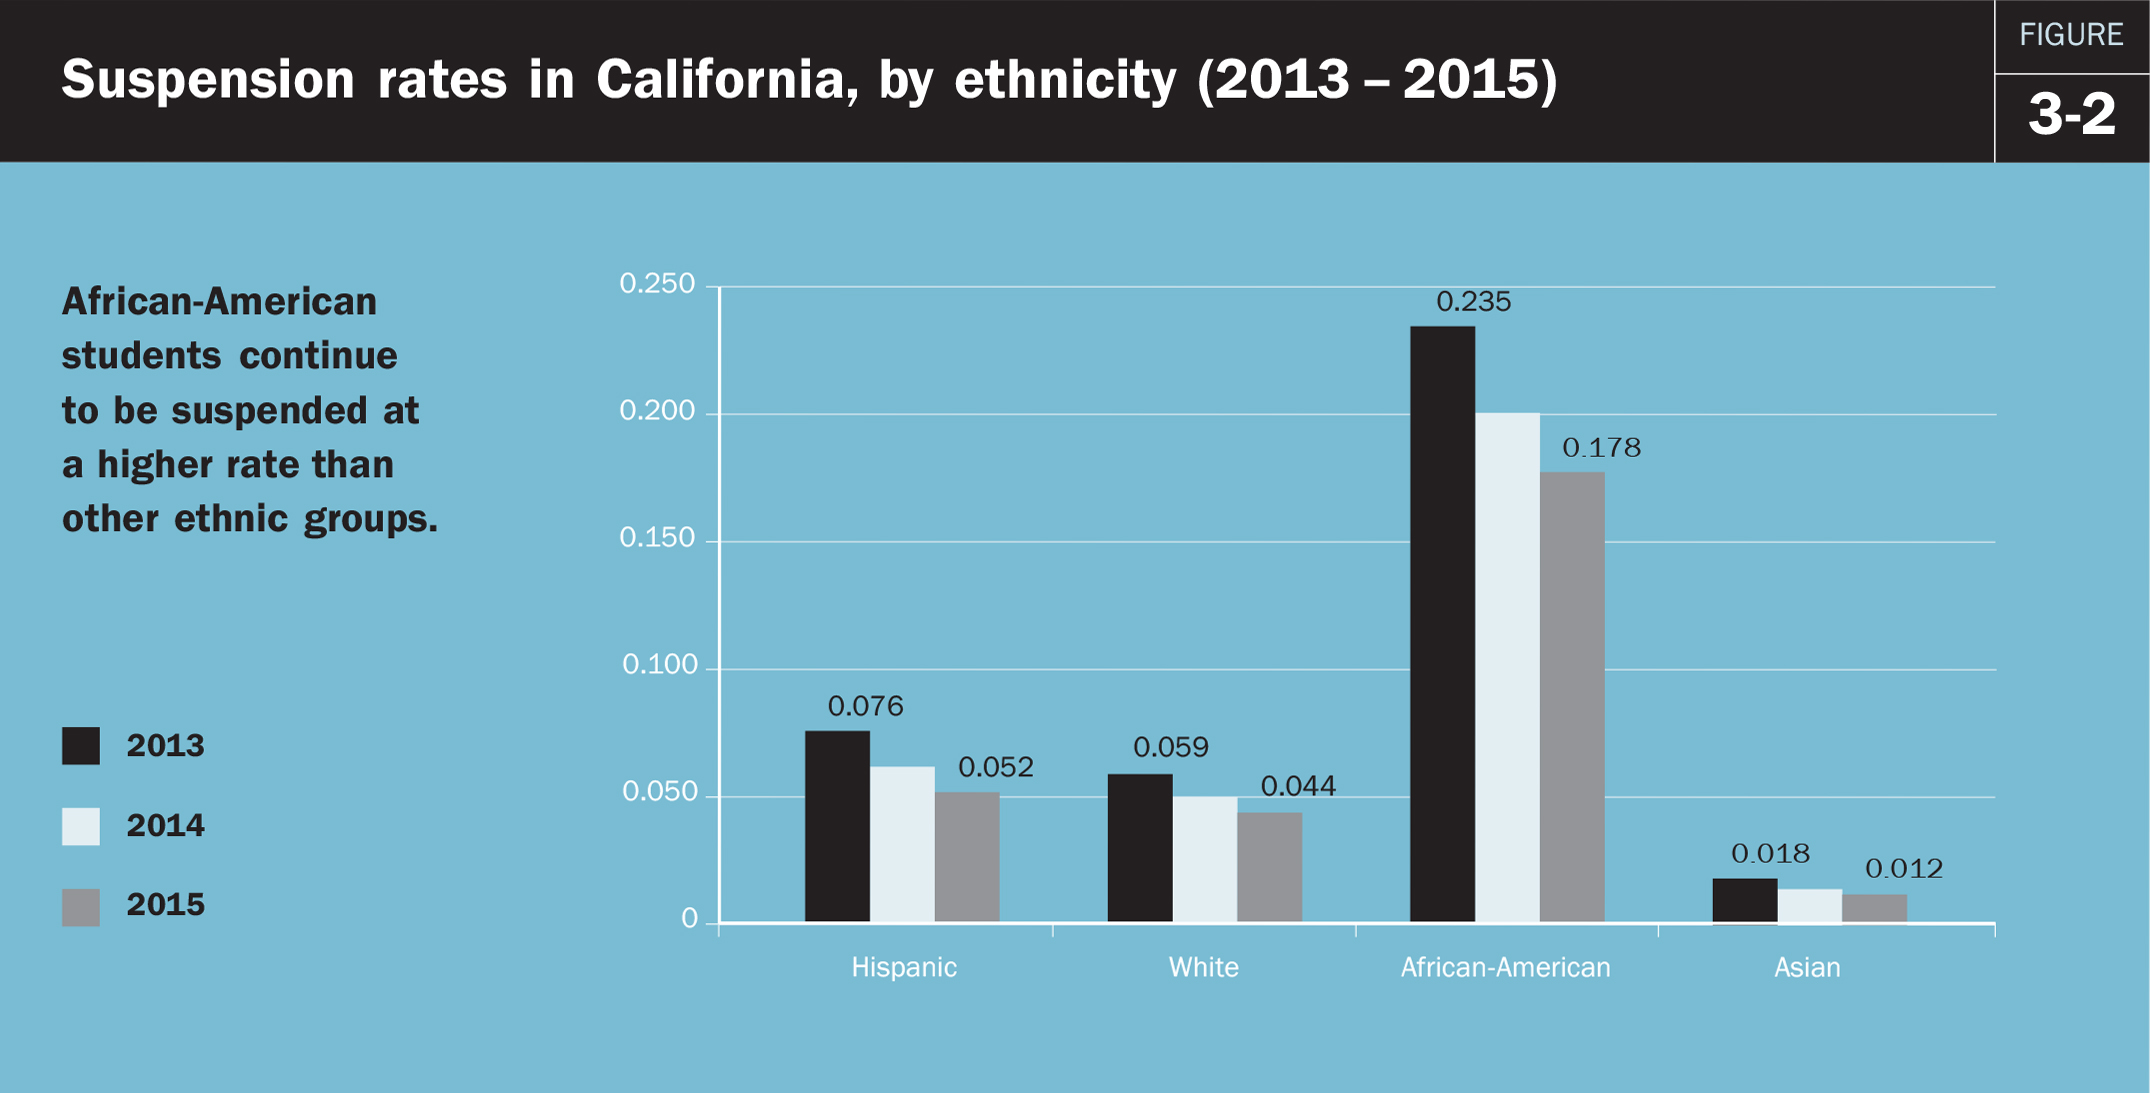
African-Americans stand out as disproportionately receiving suspensions. The 2013 rate of 0.235 means that for every 1,000 black students enrolled in California schools, black students received 235 out-of-school suspensions. That rate dropped to 0.178 in 2015, a decrease of 24.3%. Despite the decrease, the 2015 suspension rate for blacks remained much higher than for other ethnic groups; the other groups, also experienced declining suspension rates. The 2015 rates for Hispanic (0.052) and white (0.044) students were comparable—one-third to one-fourth the rate for blacks—and close to the state average for all students (0.54). The rate for Asians (0.012) was about one-fourth that of Hispanics and whites.
In sum, the black suspension rate stands out on the high side, the Asian rate stands out on the low side, and Hispanic and white rates are near the state average. The number of out-of-school suspensions fell dramatically between 2013 and 2015, but blacks were still disproportionately suspended compared to other ethnic groups in 2015.
SCHOOL-LEVEL ANALYSIS OF AFRICAN-AMERICAN SUSPENSION RATES
Let’s dig deeper into the disproportionate number of suspensions received by black students and see how schools with high suspension rates for black students differ from schools with low rates. School-level data were downloaded from the California Department of Education, California Longitudinal Pupil Achievement Data System (CALPADS) website.6 The following were dropped: schools with total enrollment of fewer than 50 students, special education schools, continuation high schools, schools in juvenile delinquency facilities, alternative schools, community day schools, and schools lacking a full panel of data for 2013-2015. A total of 7,180 schools remained available for analysis after the screens were applied.
In the discussion below, academic years are labeled by their June calendar year (e.g., the 2012-2013 academic year is “2013”). The analysis is limited to out-of-school suspensions, hereafter simply called “suspensions” to simplify wording. Suspensions that are deployed in school, which send a misbehaving student to a supervised “time-out” spot on campus, are less exclusionary than—and normally considered an alternative to—out-of-school suspensions. Each incident leading to a suspension is counted as one observation, even though a student may have been charged with more than one infraction during the incident. Suspensions occurring at different points in time and arising from different incidents are counted separately even though they may involve the same student. Note that other studies of school discipline may focus on students instead of suspensions and use what is known as “unduplicated counts” as the analytical unit. In those studies, for example, a student who has been suspended six times during a school year will count as one student, but in the analysis below, those six suspensions would all count towards a school’s total number of suspensions.
Table 3-1 sorts schools into two groups, those with high suspension rates (0.05 or greater) for African-American students and those with low rates (less than 0.05). A school’s suspension rate was calculated as the number of suspensions of black students divided by the number of black students enrolled at the school. The 0.05 suspension rate was used as the dividing line because it is the state average for all students of all races. Put in plain English, the definition of a high-suspension-rate school is a school that has reported five or more suspensions of black students for every 100 black students enrolled. The high-suspension-rate schools totaled 2,177 schools in 2013; 3,357 schools had a suspension rate below .05 and are designated low-suspension-rate schools. Most of the low-suspension-rate schools (3,240), in fact, did not suspend any black students in 2013.
Note: In 2013, 3,240 of LOW schools reported zero black suspensions. In 2015, LOW schools with zero black suspensions totaled 3,432. Schools reporting 1-10 suspensions are recorded with “*” in state data bases to protect student confidentiality. Total number of suspensions refers to known suspensions.
The contrast between the two groups is shocking. The high-suspension-rate schools, although the smaller group, suspended 51,795 African-American students in 2013 and 35,424 in 2015. The low-suspension-rate schools suspended only 202 black students in 2013 and 139 in 2015. The high-suspension-rate schools are where the most dramatic decline in the number of suspensions has occurred, but they are also where most suspensions of black students continue to occur. The high-suspension-rate schools enrolled about 130,000 black students in 2015, making their suspension rate (0.27) almost 160 times larger than the low-suspension-rate schools; their rate was approximately 0.0017 (black enrollment of approximately 80,000 students).
The third row, designated as “asterisk” schools, are schools that suspended between one and 10 black students, but the exact number is unknown. For the sake of shielding the confidentiality of students, California’s public databases report only a “*,” and not the number of suspensions, when the annual count is fewer than 11 suspensions. Despite that data constraint, many schools can still be identified as a high- or low-rate suspension school based on the number of African-American students enrolled at the school. An “asterisk” school with 20 or fewer black students was classified as a high-suspension-rate school (even the lowest possible count, one, puts them at a .05 rate), and a school with 201 or more black students was classified as a low-suspension-rate school (even with the highest possible count, 10, the rate is less than .05). In the tables below, statistics for the remaining “asterisk” schools (about 23.7% of the analytical sample in 2015) are reported. The “asterisk” schools remain in the analysis, but their individual suspension rates for black students cannot be determined from available data.
In sum, the analysis focuses on two groups of schools, one numbering nearly 2,000 and the other about 3,500, with profoundly different propensities toward suspending black students. Let’s examine some other characteristics that differentiate these schools.
GRADE CONFIGURATION
Table 3-2 exhibits the grade configuration of schools. The shaded cells indicate whether low or high suspension rates for blacks are dominant. Schools with younger children tend to have low suspension rates. The ratio of low (57.9%) to high (18.9%) in elementary schools is about 3-to-1. In K-8 schools, it is about 2-to-1—56.3% to 26.7%. The pattern reverses in middle schools and high schools.
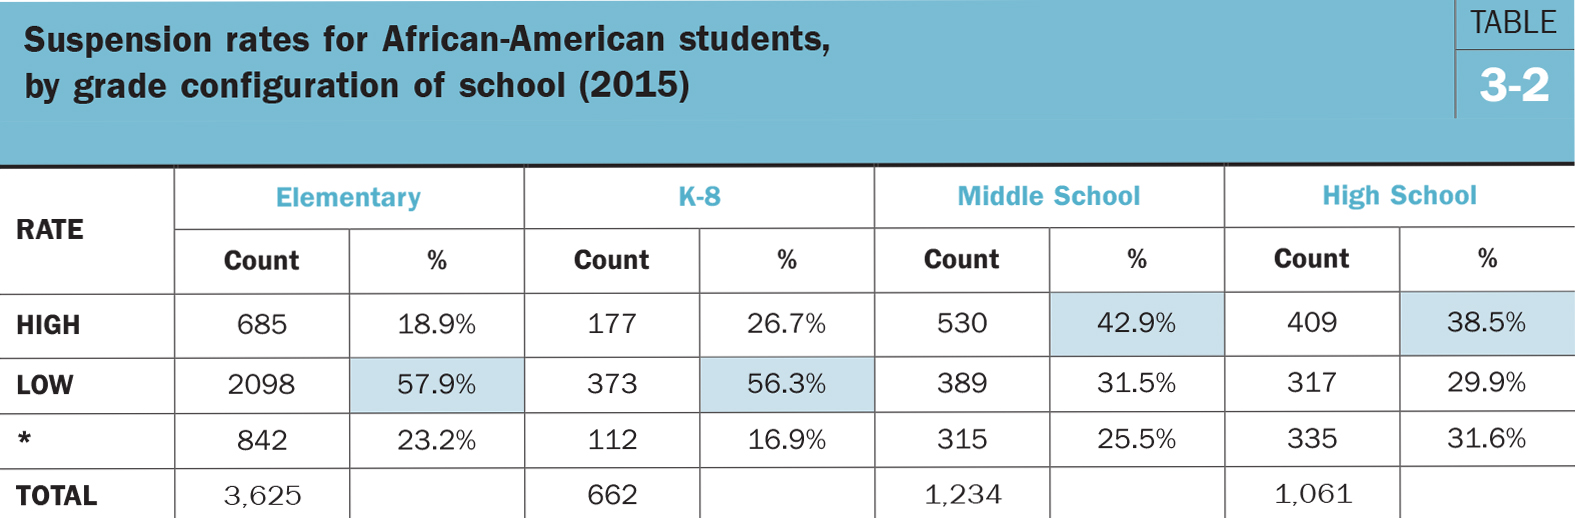 Note: Percentages shown are of column totals. Schools with other grade configurations are not shown (n = 598). The shaded cells indicate whether low or high suspension rates are greater.
Middle schools have the largest percentage of high-suspension-rate schools, 42.9%, surpassing the 31.5% of middle schools with a low suspension rate. Among high schools, 38.5% have high suspension rates, compared to 29.9% with low suspension rates. Middle school appears to be the chronological dividing line for when African-American suspension rates escalate. Elevated rates are also prevalent in high school, but not quite as pronounced as for middle schools. For both types of secondary schools, suspension rates declined from 2013 to 2015 (not shown in the table). Middle schools with high suspension rates were 50.9% of the middle school sample in 2013; for high schools, the figure was 41.5%.
SCHOOL SIZE
Large schools present management challenges that administrators in small schools do not face. A lot of kids sharing the same physical space can lead to problems. Researchers have long suspected that small schools are better able to cultivate personal connections between adults and students that promote positive social behaviors. Research suggests larger schools may face more serious behavior problems, but the literature is not definitive.7
Table 3-3 shows African-American suspension rates in California schools of three different sizes. More than three-quarters (78.0%) of small schools, those with fewer than 200 students, have low suspension rates, while only 16.7% have high suspension rates. The ratio is almost 5-to-1 favoring schools with low suspension rates. The middle size group in the table, schools with 201-1,300 students, are also more likely to evidence low suspension rates, with about twice as many lows as highs (51.3% v. 26.0%). Large schools stand out, with more schools identified as high-suspension-rate schools (38.2%) than low (22.4%). There are two caveats, however. School size is correlated with grade levels—middle and high schools are typically larger than elementary schools. As we just saw, schools serving adolescents are prone to more suspensions than schools with younger children. In addition, the large number of “asterisk” schools muddies the water in terms of schools with more than 1,300 students.
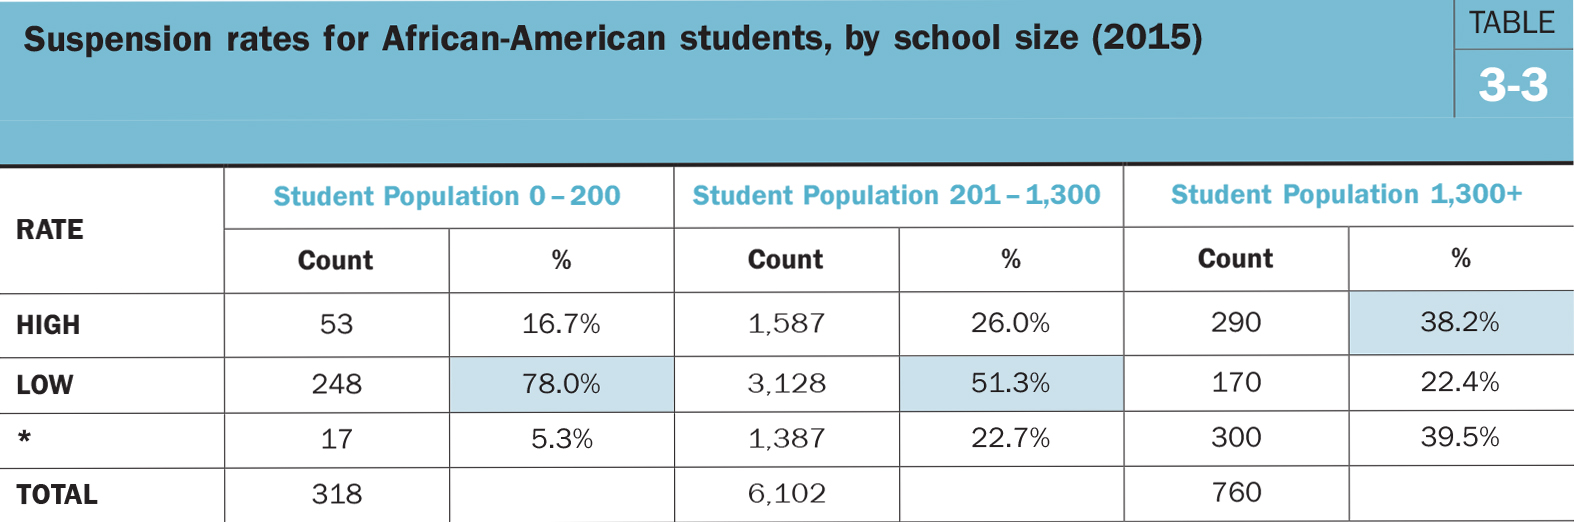 Note: School size sample mean = 749, SD = 543. The shaded cells indicate whether low or high suspension rates are greater.
FREE AND REDUCED PRICE MEALS
Table 3-4 presents suspension data broken out by the percentage of students qualifying for free and reduced price meals (FRPM), a traditional indicator of school poverty. The first column, FRPM 0-33%, represents schools in wealthier communities; the far right column, FRPM>89%, represents high-poverty schools; and the middle column represents schools that are closer to the state average on the indicator, ranging from one standard deviation above to one standard deviation below the mean.
Schools in wealthier communities are less likely to suspend African-American students than other schools. Almost two-thirds (64.4%) suspend blacks at a low rate, whereas only 16.3% suspend at a high rate. The proportion of high-suspension-rate schools increases in tandem with increased poverty. In the middle of the FRPM distribution, 29.2% of schools qualify as high-suspension-rate schools. Surprisingly, though, the pattern does not continue linearly. Schools serving the poorest students, in which 89% or more qualify for FRPM, exhibit similar suspension rates as schools near the FRPM mean: 45.5% are high-suspension-rate schools and 31.2% have low suspension rates. The proportion of students in poverty at a school appears to be associated with black suspension rates, but it is not as powerful a correlate as school size.
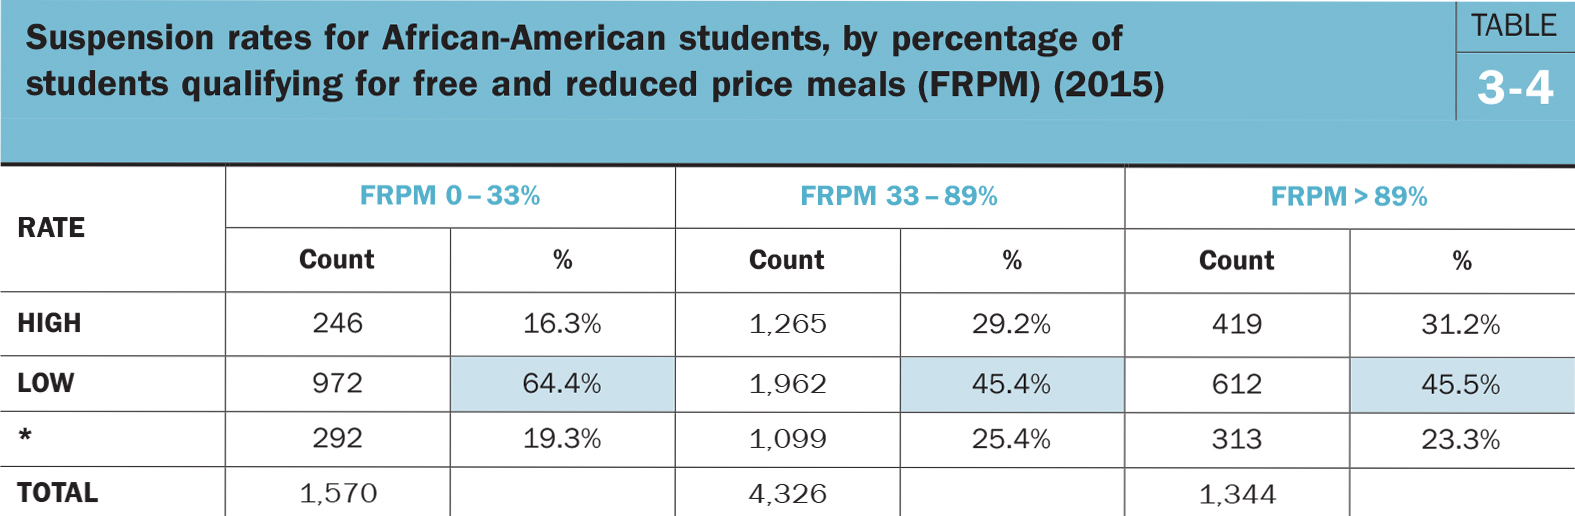 Note: FRPM sample mean = 61.2%, SD = 28.2%. The shaded cells indicate whether low or high suspension rates are greater.
Again, there are caveats. Free and reduced price meals (FRPM) is an imperfect proxy for school poverty. The federal meals program allows families with incomes up to 185% of the official poverty level to qualify for reduced price meals and families up to 130% of the poverty level to receive free meals. In addition, under the Community Eligibility Provision, non-poor students may receive FRPM if they attend schools in which a majority of students are poor.8FRPM is still the most widely available school-level indicator of poverty, but it is a noisy measure—and getting noisier.
BLACK PROPORTION OF SCHOOL ENROLLMENT
The harmful effects of racial segregation in public schools are well documented. In particular, black students who attend racially isolated schools are more likely to experience lower academic achievement, exposure to gangs, and disruptions during classroom instruction. One study labeled this the “Racial School Climate Gap.”9 A 2014 multilevel analysis of suspension data found the percentage of black enrollment to be the strongest school-level predictor of out-of-school suspensions. The analytical model also included student-level variables, including race, poverty status, and the severity of infractions. Surprisingly, attending a school with a high proportion of black enrollment only contributed slightly less to a student’s probability of being suspended as committing the infraction of fighting or battery.10
Table 3-5 displays suspension rates disaggregated by the proportion of black students enrolled in schools. Schools with the lowest percentage of black enrollment (0%-6%) do not suspend black students as frequently as schools with larger black populations. Almost two-thirds (62.2%) are low-suspension-rate schools, yet nearly half of the schools with black enrollment larger than 16% are high-suspension-rate schools (47.5%).
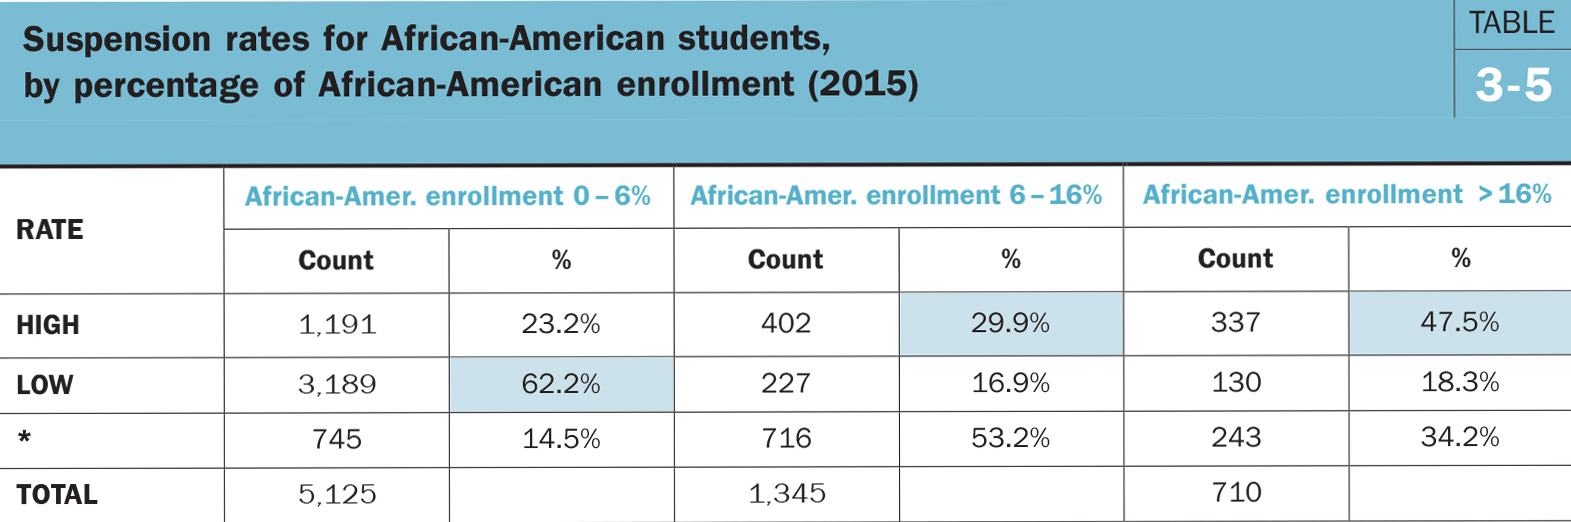 Note: Percentage black enrollment sample mean = 6.0%, SD = 9.4%. The shaded cells indicate whether low or high suspension rates are greater.
Why is this? One explanation is related to segregation. Schools with large black populations may be located in unsafe neighborhoods and consequently adopt tighter disciplinary policies (e.g., “zero tolerance”), with rules enforced by metal detectors, hallway cameras, and security guards. However, the data in Table 3-5 suggest that other factors are at work. A nearly 3-to-1 ratio favoring low-suspension-rate schools flips to a nearly 3-to-1 ratio favoring high-suspension-rate schools, and that reversal becomes apparent with schools in which African-American students are 16% or more of enrollment. Sixteen percent is not racial isolation.
Racial bias or stereotyping cannot be ruled out in either the development or implementation of school rules. Beginning in middle school, African-American students are more likely than Asian and white students to say they are treated unfairly when it comes to school discipline.11Black students are also more likely to come from family backgrounds associated with school behavior problems; for example, children ages 12-17 that come from single-parent families are at least twice as likely to be suspended as children from two-parent families. Almost two-thirds of black children in California live in single-parent households.12
DISCUSSION
State officials in California have been urging schools to reduce out-of-school suspensions. The number of out-of-school suspensions fell by more than 30% from 2013 to 2015. Declines of approximately equal magnitude were registered among students in all four of the state’s major racial/ethnic groups—Hispanic, white, Asian, and African-American. One objective of discipline reform has not been met: black students continue to be suspended at rates disproportionate to their share of the student population.
What can state data tell us about this disproportionality? The current study examined suspension data from 7,180 schools. The schools were divided into two groups, signifying high- and low-suspension rates, based on whether black student suspensions fell above or below five percent of black student enrollment. High-suspension-rate schools numbered 2,177 in 2015. They suspended more than 35,000 African-American students. The group of low-suspension-rate schools was much larger at 3,546 schools, but they suspended only 139 black students. These differences are stunning. How else do the schools differ? The analysis focused on two structural characteristics—grade configuration and size—and two demographic characteristics—the percentage of students qualifying for free and reduced price meals and the proportion of African-American student enrollment.
Middle schools and high schools are more likely to have high African-American suspension rates; elementary schools and K-8 schools tend to have low rates. Large schools have higher suspension rates for blacks than small schools. Schools with more students qualifying for free and reduced price meals, a proxy for poverty, have higher African-American suspension rates than schools in wealthier communities. Schools enrolling a greater percentage of black students exhibit higher suspension rates for black students than schools with fewer black students.
The study’s data cannot definitively confirm that the decline in suspensions came about because of state initiatives promoting discipline reform. The decline in suspensions for disruption/defiance is certainly in accord with state preferences, especially as encoded in state legislation, AB240, but as pointed out above, several districts had already taken their own steps to limit defiance suspensions before the law took effect. Like other policies, upper-level (state or federal) policy initiatives may ratify trends already underway rather than start new ones. UCLA’s Civil Rights Project calculated that 77% of the decline in state suspensions from 2012-2014 were in the disruption/defiance category.13 Reducing suspensions—and the disparate impact of suspensions on black students—has been the subject of national attention and discussion for several years.
ALTERNATIVES TO SUSPENSIONS
Suspended students may miss several days of schools and have long periods of time without adult supervision. Out-of-school suspensions are associated with low achievement, poor attendance, and juvenile crime—a combination of undesirable outcomes that can push students into what has been called the “school-to-prison pipeline.” Restorative justice has become a popular alternative to out-of-school suspensions, typically featuring a meeting of victims, perpetrators, parents, teachers, administrators, and a counselor or psychologist. The goal is to get misbehaving students to take responsibility for their behaviors and the consequences that others have suffered. Evaluations of the effectiveness of the intervention are scant. A 2016 study of longitudinal data from Denver Public Schools found restorative practices offered to students in one semester were associated with reductions in suspensions during the following semester. The authors noted that no randomized control trial (RCT) of the program has been conducted to date.14A 2016 research review from WestEd identified three RCTs of restorative interventions underway, with the earliest evaluation expected to be completed in 2018.15
Studies of disciplinary reform tend to focus on suspended students. What about their peers?
Research suggests that misbehaving students take a toll on the education of others. A 2014 report from Ofsted, the United Kingdom inspectorate of schools, estimated that each year, British teachers lose the equivalent of 38 days of instruction dealing with even low-level misbehavior. Carrell, Hoekstra, and Kuka (2016) investigated the long-term impact of classroom disruption on peers by linking Florida elementary school data to later outcomes. Exposure to a single disruptive peer in an elementary class of 25 students leads to a 1.6 percentage point reduction in college enrollment, a 2.6 percentage point reduction in the likelihood of receiving a college degree (including two-year degrees), and a three-to-four percent loss in earnings.
Discipline reform will rise or fall on whether disruptive behaviors, not just suspensions, are diminishing. Around the country, teachers have challenged the merits of discipline reform by warning about deteriorating safety and order at schools. In December 2016, The Fresno Bee reported that 70 of 85 teachers at McLane High School, a school publicly praised for its restorative justice program, signed a petition demanding stricter, more consistent discipline at the school.16 The petition claims the campus has experienced constant disruption and fighting—and that teachers have been both physically and verbally assaulted.
“This is unfair to students who come to school ready to learn and the teachers ready to engage them,” the petition states. “Our students are losing valuable classroom instructional time, which is depriving them of their right to an education, decreasing their chances at success in college and careers, and affecting the morale of staff members.”
Consider the data above on racial composition of schools. It is true that black students are suspended at disproportionately high rates, but the negative effects of disruptive students on rule-abiding peers almost certainly fall disproportionately on black students as well.
CONCLUSION
The foregoing analysis suggests that policymakers should consider altering the organizational characteristics of schools as a strategy for reducing disparities in black suspensions.
It will not be easy. Racial or socio-economic desegregation of schools has proven difficult since the 1970s. Breaking large schools up into smaller units may reduce suspension rates for all students—and especially for black students—but that means reassigning students to new schools. Researchers have questioned the merits of isolating middle school students in their own grade configuration for years. A North Carolina study found that students who attended sixth grade at a middle school were more likely to be suspended, and later to repeat a grade or drop out of school, compared to counterparts who attended sixth grade in an elementary school.17 A longitudinal study of New York City sixth graders found that attending sixth grade in a middle school, as opposed to a K-8 school, produced a negative impact on achievement that began in the first year and extended throughout the middle school years. In surveys of both students and parents, respondents described middle school campuses as less safe, peer behavior as more immature and antisocial, and the overall quality of education as lower than in K-8 schools.18
Restorative justice interventions or other discipline reforms may prove to be successful alternatives to out-of-school suspensions; however, their efficacy has not yet been evaluated in rigorously designed evaluations. Suspensions are declining, but reforms have also been unpopular with some teachers and principals. Policymakers need to consider a broader array of possible solutions to the problem of disciplinary equity and take policy guidance from studies that can assess causal impact. Those evaluations should include staff morale, the effect on learning environments, and the learning of rule-abiding peers as measured outcomes. Breaking up large schools to create smaller campuses and reconfiguring middle schools as K-8 schools, at least based on the correlational evidence presented here, appear to be low hanging fruit in terms of structural changes with the greatest potential to support disciplinary equity.
Related Content


Author

-
Footnotes
- Daniel J. Losen, Tia Martinez, and Jon Gillespie, Suspended Education in California (UCLA: The Civil Rights Project, 2012).
- The Governor had vetoed two earlier versions of the bill that banned willful defiance suspensions in all schools, including middle and high schools. The states two teachers unions opposed the earlier bills but took a neutral position on AB420.
- Susan Frey, “New Law Limits Student Discipline Measure,” EdSource, September 28, 2014.
- California State Department of Education, “State Schools Chief Torlakson Reports Significant Drops in Suspensions and Expulsions for Second Year in a Row,” January 14, 2015. Accessed at: http://www.cde.ca.gov/nr/ne/yr15/yr15rel5.asp. Also see similar press release from 2016: http://www.cde.ca.gov/nr/ne/yr16/yr16rel5.asp
- California has five other reporting categories for race and ethnicity: Flipino, Not Hispanic (2.5%), Two or More Races (2.4%), American Indian or Alaskan Native (0.7%), Pacific Islander, Not Hispanic (0.6%), and None Reported (0.7%). In this paper, Hispanic or Latino of Any Race is referred to as “Hispanic,” Asian, Not Hispanic as “Asian,” African American, Not Hispanic as “African American” or “Black,” and White, Not Hispanic as “White.”
- Data were combined from the following files for each year of analysis: Free and Reduced Price Meal Data, Enrollment Data: Enrollment by School, and Expulsion and Suspension Data. Except for suspension data, which are collected at the end of the year, all other data were collected on census day, the first Wednesday in October of the school year.
- Several papers on the effects of school and class size can be found in: Brookings Papers on Education Policy, 2006/2007 (Loveless T. and Hess, F.M., eds), (Washington, DC: Brookings Institution Press, 2007).
- Schools and districts qualify by using data from other means-tested programs to establish extensive poverty in the community. https://www.fns.usda.gov/school-meals/community-eligibility-provision
- Adam Voight. The Racial School-Climate Gap. (San Francisco: WestEd, 2013).
- Russell J. Skiba, Choong-Geun Chung, Megan Trachok, Timberly L. Baker, Adam Sheya, and Robin L. Hughes, “Parsing Disciplinary Disproportionality: Contributions of Infraction, Student, and School Characteristics to Out-of-School Suspension and Expulsion,” American Education Research Journal, August 2014, 52 (4), 640-670.
- Adam Voight. The Racial School-Climate Gap. (San Francisco: WestEd, 2013), p. 4.
- Kids Count Data Center, “Children in single-parent families by race,” 2015, accessed at: http://datacenter.kidscount.org/data/tables/107-children-in-single-parent-families-by#detailed/2/2-52/false/573,869,36,868,867/10,11,9,12,1,185,13/432,431
- Daniel J. Losen, Michael A. Keith II, Cheri L. Hodson, Tia E. Martinez, and Shakti Belway, Closing the School Discipline Gap in California: Signs of Progress (UCLA: The Civil Rights Project, 2015).
- A 2015 meta-analysis of twelve randomized control trials (RCT) of restorative interventions in UK and Australian criminal justice settings found reduced repeat offenses on a short –term basis but weaker long term effects. It is unclear whether restorative approaches with adults under the auspices of courts and police are applicable to school discipline.
- T. Fronius, H.Persson, S. Guckenburg, N. Hurly, and A. Petrosino, Restorative Justice in U.S. Schools: A Research Review (San Francisco: WestEd, 2016).
- Mackenzie Mays, “Restorative justice? Teachers say McLane High classrooms are spiraling out of control,” The Fresno Bee, December 10, 2016.
- P.J. Cook, R. MacCoun, C. Muschkin, and J. Vigdor, “Should Sixth Grade Be in Elementary or Middle School? An Analysis of Grade Configuration and Student Behavior,” NBER Working Paper #12471 (August 2006).
- J.E. Rockhoffand B.B. Lockwood, “Stuck in the Middle: How and Why Middle Schools Harm Achievement,” Education Next (Fall 2010), pp. 69-75.
The Brookings Institution is committed to quality, independence, and impact.
We are supported by a diverse array of funders. In line with our values and policies, each Brookings publication represents the sole views of its author(s).