The Vitals
Over the last 40 years, wage growth for typical American workers has been extraordinarily weak. The typical worker has certainly gained some ground—especially over the last 25 years—and different inflation adjustments can make those gains appear somewhat larger. But by any measure, wages at the middle have grown more slowly than at the top and more slowly than the economy overall. In addition, fewer Americans are earning more than their parents did at similar ages, perhaps explaining discontent with the economy despite the consistent economic growth and low unemployment rates. Many presidential candidates highlight this discontent.
-
Globalization, insufficient economic dynamism, the declining rate of private sector union membership, and other factors have contributed to weak wage growth for many Americans.
-
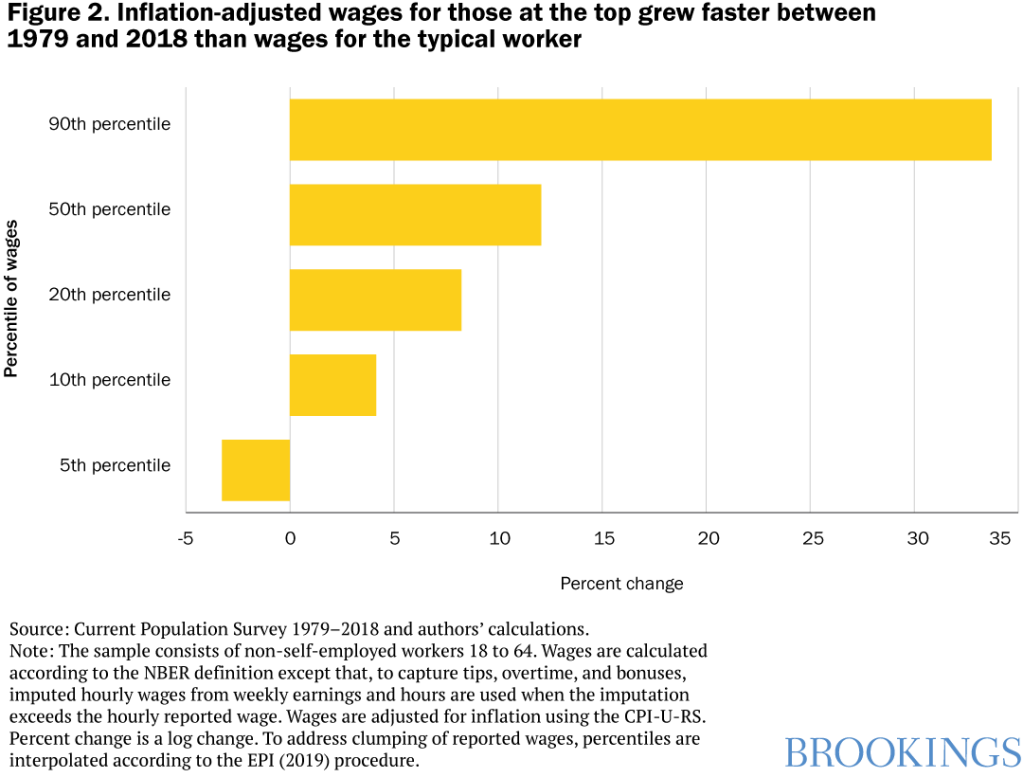
Hourly wages at the middle grew an inflation-adjusted 12% between 1979 and 2018; wages at the 90th percentile rose 34%.
-
Wage growth for typical workers has been weak for decades, but the tightening labor market along with state and local increases to minimum wages have recently boosted wages at the bottom.
A closer look
Adjusted for inflation, hourly wages of workers in the very middle (the 50th percentile, or the worker who makes more than half of all workers but less than the other half) grew 12% between 1979 and 2018 (figure 2). (1979 is a common starting point for analysis of wage trends, as it is the first year when higher-quality data become available.) In contrast, wages toward the top (the 90th percentile, the worker who makes more than 90% of all workers) rose 34 percent. Toward the bottom (the 10th percentile), wages have grown only 4%.
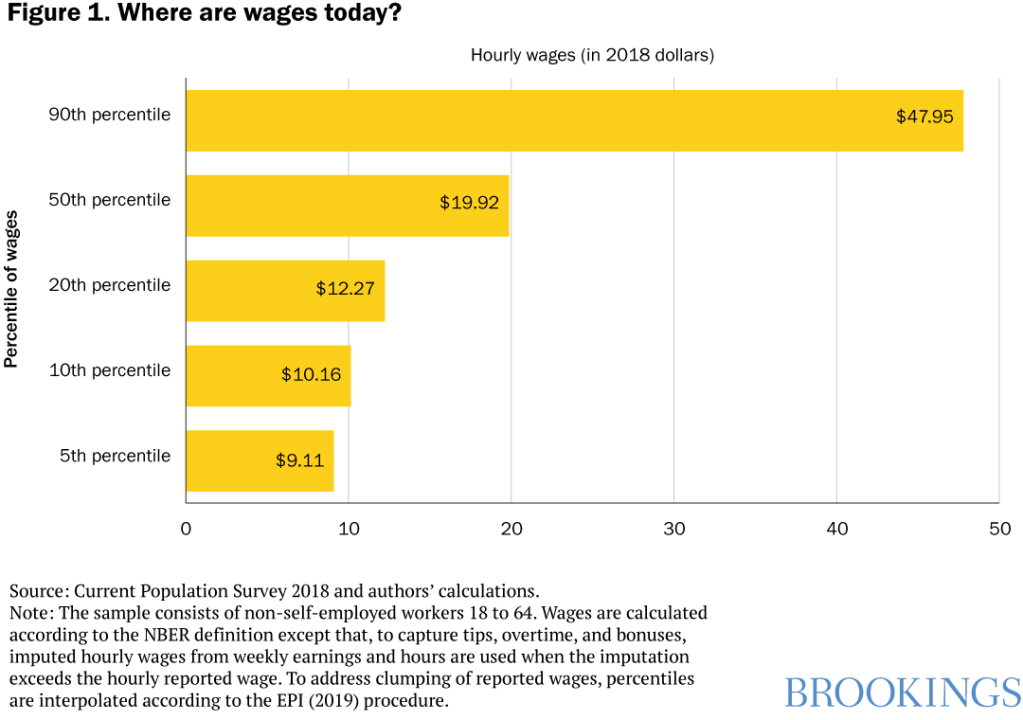
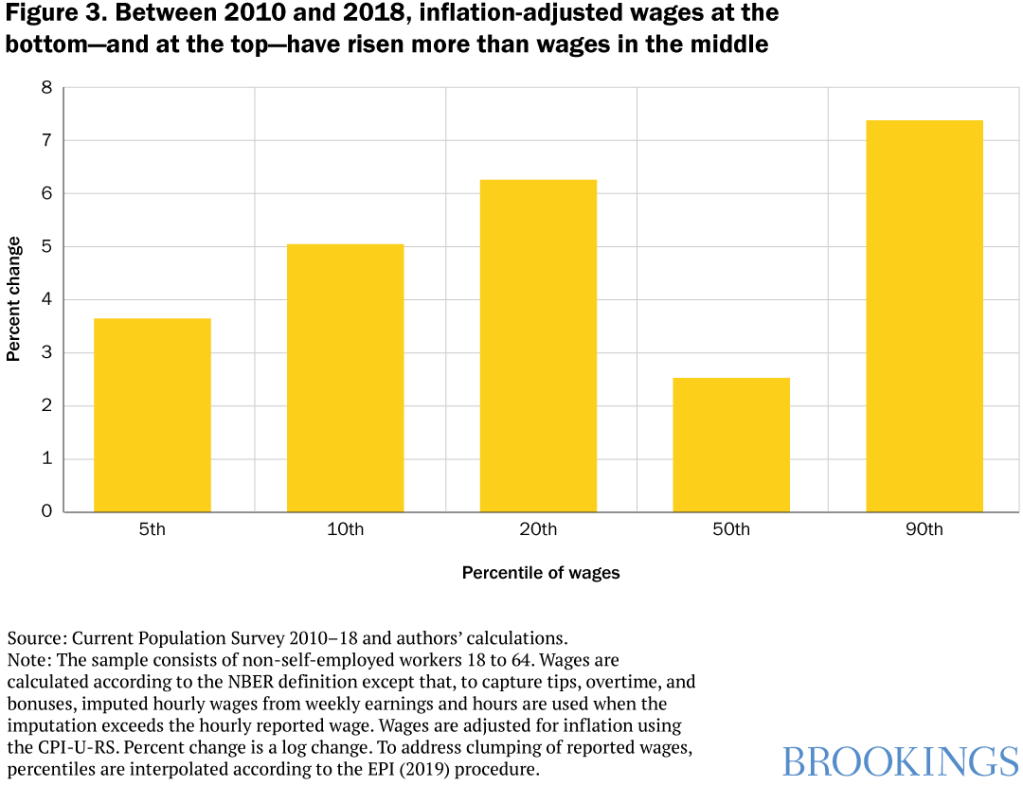
Somewhat more encouraging are the wage trends observed more recently. Since 2010—and especially since 2014—wage growth has been stronger for low-wage workers than it was previously. They still earn a lot less than others—$10.16 per hour at the 10th percentile versus $47.95 at the 90th percentile—but they are doing better. Figure 3 shows the cumulative percent growth in various percentiles of hourly wages for the 2010–18 period. From 2010–18, the 10th percentile of hourly wages grew 5.1%, which is better than the 50th (2.5%) but worse than the 90th (7.4%).
Why are workers at the bottom doing relatively better lately?
One reason that workers at the bottom are doing relatively
better recently is the recent increases in many state and local minimum wages. While
the federal minimum wage has not risen since 2009, many states—such as California and Massachusetts—and
cities, such as Seattle and New York City, have increased their legislated
minimums considerably. In all, 29 states and the
District of Columbia now have minimum wages above the federal $7.25 an
hour.
Recent wage trends at the bottom of the distribution point to this as a possible cause of the improvement—one that is a prominent component of some 2020 campaigns. The 5th and possibly the 10th percentiles of wage earners are affected by increases in state and local minimum wages, which have risen even as the real value of the federal minimum wage has been eroded by inflation—a point made by David Cooper, Elise Gould, and Ben Zipperer. (Indeed, Ernie Tedeschi showed that nearly 6 million workers are bound by state and local minimum wages in 2018.) On the face of it, the rise in 10th percentile wages relative to the 50th percentile (i.e., the declining 50/10 wage ratio) is what one would expect from an increased minimum wage. That ratio has declined, falling from 2.01 in 2010 to 1.96 in 2018, even as median wages grew.
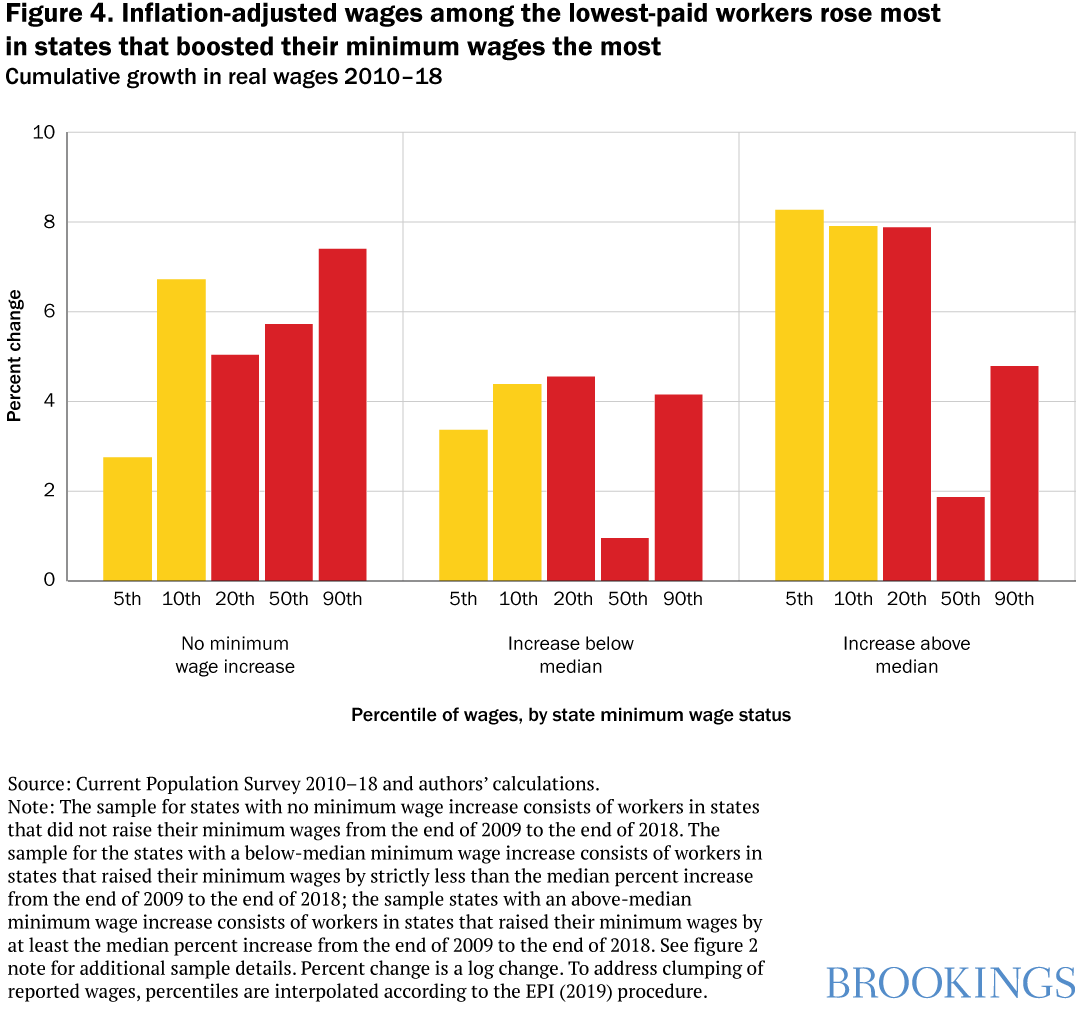
To explore the role of state minimum wage changes in
particular, we divide workers into three groups: those from the 22 states that
did not raise their minimum wage between the end of 2009 and the end of 2018, those
from the 14 states that raised their minimum wages by less than the median
percent minimum wage increase over the same period (an increase of 25 percent),
and those from the 14 states and the District of Columbia that raised their
minimum wages by more than the median. (Notably, this ignores changes in city
or county minimum wages, which are a less-important but still relevant wage
floor.)
Figure 4 shows cumulative percent growth in percentiles of hourly wages in all three groups. For states that did not change their minimum wages, the 5th percentile grew by less than 3%—well below growth at the middle and top of the distribution. The wage growth pattern in states that raised their minimum wages by a relatively large amount (i.e., more than the median increase) was starkly different. Growth of the 5th through 20th percentiles was markedly stronger than in other states, despite the fact that the minimum wage-raising states had slower growth at the 50th and 90th percentiles. In states that raised their minimum wages a relatively small amount, the pattern was more mixed: growth of the 5th percentile was slightly stronger than in states that did not raise their minimum wages, but growth at the 10th and higher percentiles was weaker.
One shortcoming of this analysis is that states with
especially strong (or strengthening) labor markets may be more likely to raise
minimum wages, generating a spurious association between state minimum wages
and overall wage growth. Another problem is that other policy changes may have
accompanied the increase in minimum wages, making it difficult to know which
policy change is responsible for shifts in wages. Still, the disproportionate strengthening
(in states that raised their minimum wages by larger amounts) of the bottom of
the wage distribution is suggestive of a role for policy changes. It is notable
that growth of the 50th and 90th percentiles was actually weaker for states
that increased their minimum wages than for states that did not, contrary to
what one would expect if minimum wage increases were simply markers of a
strengthening labor market.
What else could explain rising wages at the bottom?
Just as important as higher minimum wages is the tightening
labor market of 2014–18, which raised demand for low-wage workers and may have
complemented minimum wage increases by offsetting any tendency of employers to
hire fewer workers in response to the increases.
In the years immediately following the Great Recession, the large number of jobless workers likely held down wages, particularly at the bottom of the wage distribution. A growing body of research indicates that low-wage and disadvantaged workers benefit disproportionately from tighter labor markets. The prolonged slack after the Great Recession is evident from an unemployment rate that stayed above its prerecession low until late 2016 and a prime-age labor force participation rate that is still not quite back to its prerecession level. It took until 2016 for the 10th percentile of wages to exceed its 2009 level. By contrast, the 90th percentile of national wages declined very little and had already exceeded its 2009 level by 2011. In short, tighter labor markets in the last five years seem to have provided more benefits to those at the bottom.
But why have wages for the typical worker risen so slowly over the past 40 years?
The reasons for weak long-run wage growth include:
- the declining rate of private sector union membership,
- the proliferation of anti-worker labor arrangements like non-compete clauses in employment contracts,
- ongoing globalization and exposure to international competition,
- concentration in both output and labor markets, and
- declining business and labor market dynamism that resulted from several of these developments.
What government policies might raise wages?
Policies aimed at strengthening worker bargaining power could
all help low- and middle-wage workers, including the following.
- Increased wage transparency would put employers and workers on a more level playing field during wage negotiations.
- Reduced use of non-compete contracts would give workers more employment opportunities.
- Strengthened collective bargaining would boost pay and reduce inequality.
- Improved antitrust enforcement could diminish labor market monopsony — that is, places and occupations where a small handful of employers dominate — and would limit employer power over workers in some labor markets.
In addition, policies related to training
and education could lift the productivity of lower-wage workers and create
pathways to better high-paying jobs for those with less education.
But two lessons from the-recent wage data are:
- Recent minimum wage increases have likely improved wages at the bottom of the distribution.
- A tight labor market coming from sustained economic growth is supporting that wage growth.
These developments likely complement each other: tight labor
markets sustain hiring even as minimum wages allocate more of the benefits to
the lowest-wage workers, helping those workers to participate more fully in
economic growth.
Thanks to Emily Moss,
Jimmy O’Donnell, and Jana Parsons for excellent research assistance.
Authors


Dig Deeper


The Brookings Institution is committed to quality, independence, and impact.
We are supported by a diverse array of funders. In line with our values and policies, each Brookings publication represents the sole views of its author(s).


Commentary
Whose wages are rising and why?
January 21, 2020