After months of disappointing job reports, the country is finally seeing some promising numbers as the fragile recovery grows stronger. But a number of challenges continue to hold many poor and middle-class Americans back. Here are ten facts to keep in mind for 2015 and beyond.
1. Because the population and labor force are growing, it takes about 80,000 jobs a month just to keep pace with this growth, according to analyses by Dan Aaronson and Scott Brave, at the Federal Reserve Bank of Chicago. Anything above this level helps to reduce unemployment. That’s a lower threshold than the country needed to meet in the 80s and 90s—150,000 to 200,000 jobs a month—in part because the country is aging and population growth has slowed.
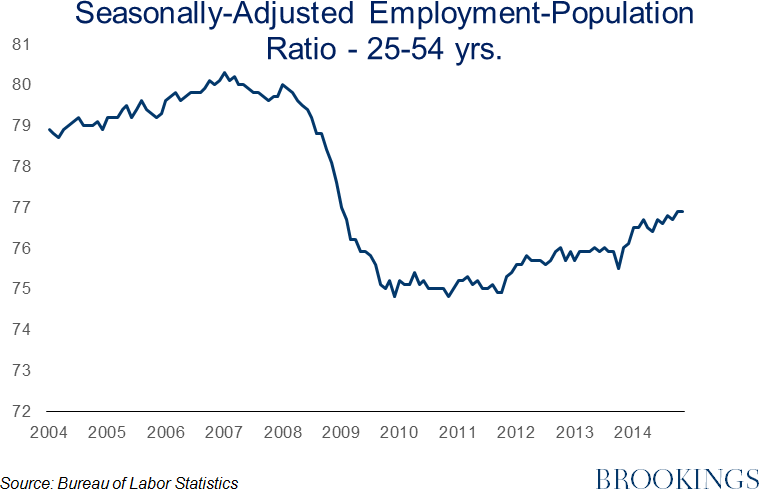
2. Much more worrisome is the drop in the employment to population ratio, especially among adult men. The proportion of prime-age adults who are employed dropped from an average of 79.8 percent in 2006 to 76.7 percent in 2014.
3. The labor force participation rate shows the percentage of the population that is either working or actively looking for work (unemployed). For the adult population past age 16, the participation rate has dropped about 3 percentage points since 2007. Roughly half the drop is the result of an aging population. Another portion is due to the lack of jobs. Other possible factors include the mass incarceration of low-income men, the challenges of skill-based technological change, and employers’ reluctance to hire long-term unemployed Americans.
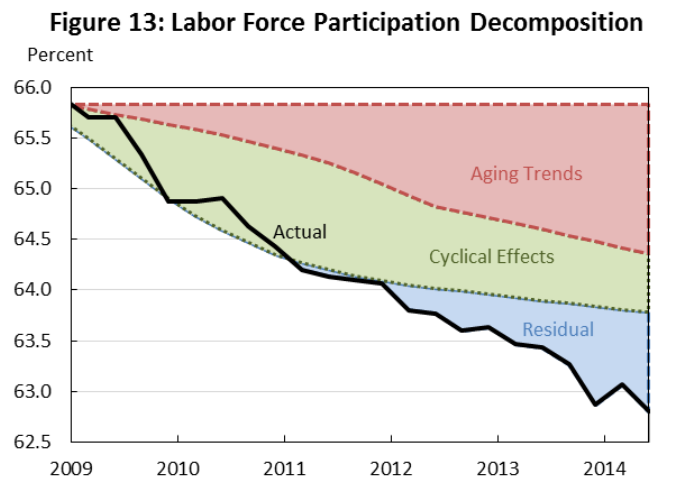
Source:
The Labor Force Participation Rate Since 2007: Causes and Policy Implications
, Council of Economic Advisors, July 2014
4. The number of “good” jobs has been declining among men but increasing for women since 1979. (The Economic Policy Institute defines a good job as one that pays roughly $20 an hour with benefits.) More and more women are going to college, improving their prospects. In 1994, 63% of recent female high school graduates, and 61% of their male counterparts enrolled in college. By 2012, women’s enrollment rate had risen to 71%, but the men’s rate hadn’t changed.
5. An unemployment rate of 5.8 percent is an improvement but still too high. In the late 1990s unemployment dropped to a little over 4 percent without leading to more inflation. The Federal Reserve projects that the unemployment rate will fall to roughly 5% by 2017. Whether it does or not will partially depend on debates within the Fed about when to boost interest rates. If job growth stays at a healthy level of 300,000 a month, then employment will be back at prerecession levels around the time of the 2016 election.
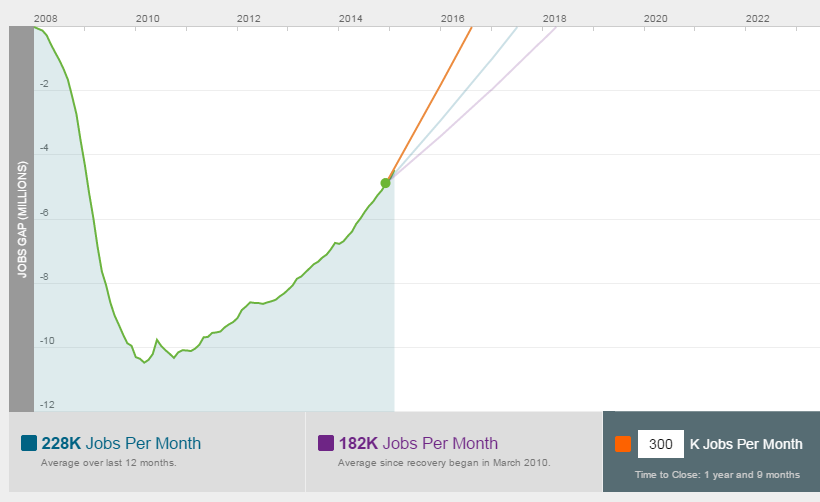
Source:
The Hamilton Project
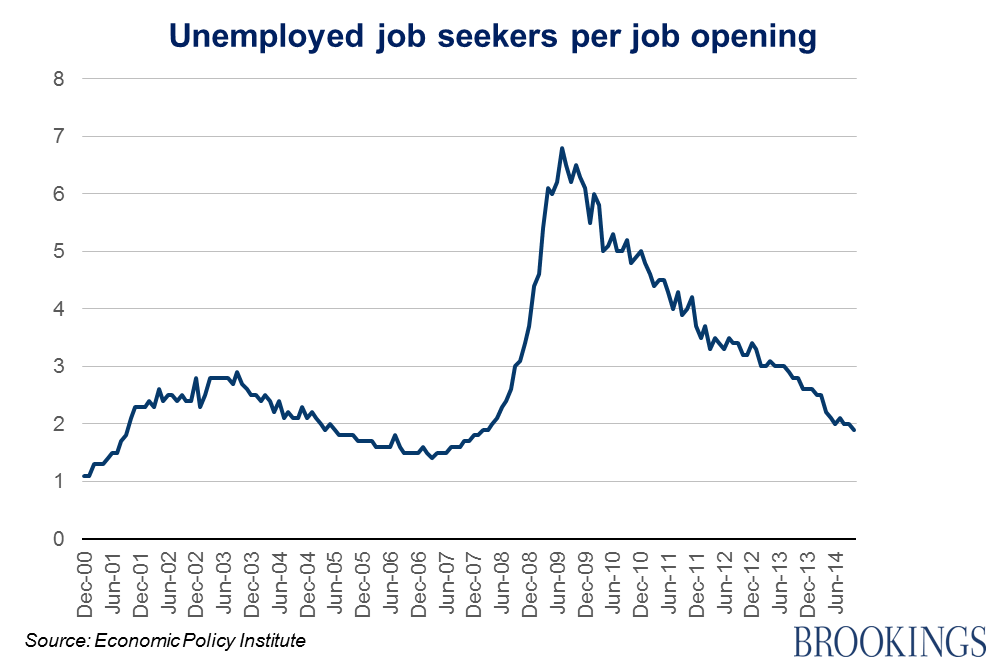
6. During periods of full employment, such as the late 1990s, there are roughly the same number of job openings as there are people looking for work. During most of the Great Recession, there was only one job opening for every four workers seeking jobs. Thankfully, that number has come down recently. Recent survey data from the Bureau of Labor Statistics suggest that the ratio is around two, similar to its 2005 level.
7. Another look at the same set of dynamics shows that we still have a ways to go. The graph below plots the Beveridge curve, which summarizes the relationship between the unemployment rate and the rate of job openings over the last decade. Before the recession, low unemployment meant a high rate of job openings. During the recession, unemployment rose and the rate of job openings fell, in part because employers weren’t hiring, but also because people were fearful about leaving their current jobs. A lower quit rate reduced the number of job vacancies for unemployed workers to fill. Now the economy is recovering and the rate of job openings has risen—but unemployment remains higher than we would expect, based on the last decade.
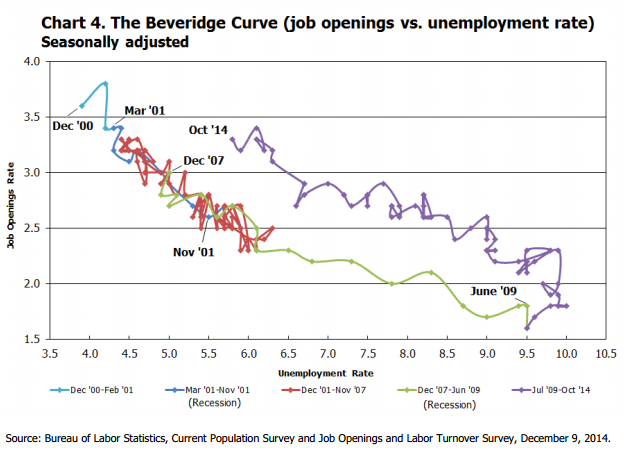
Source:
Bureau of Labor Statistics
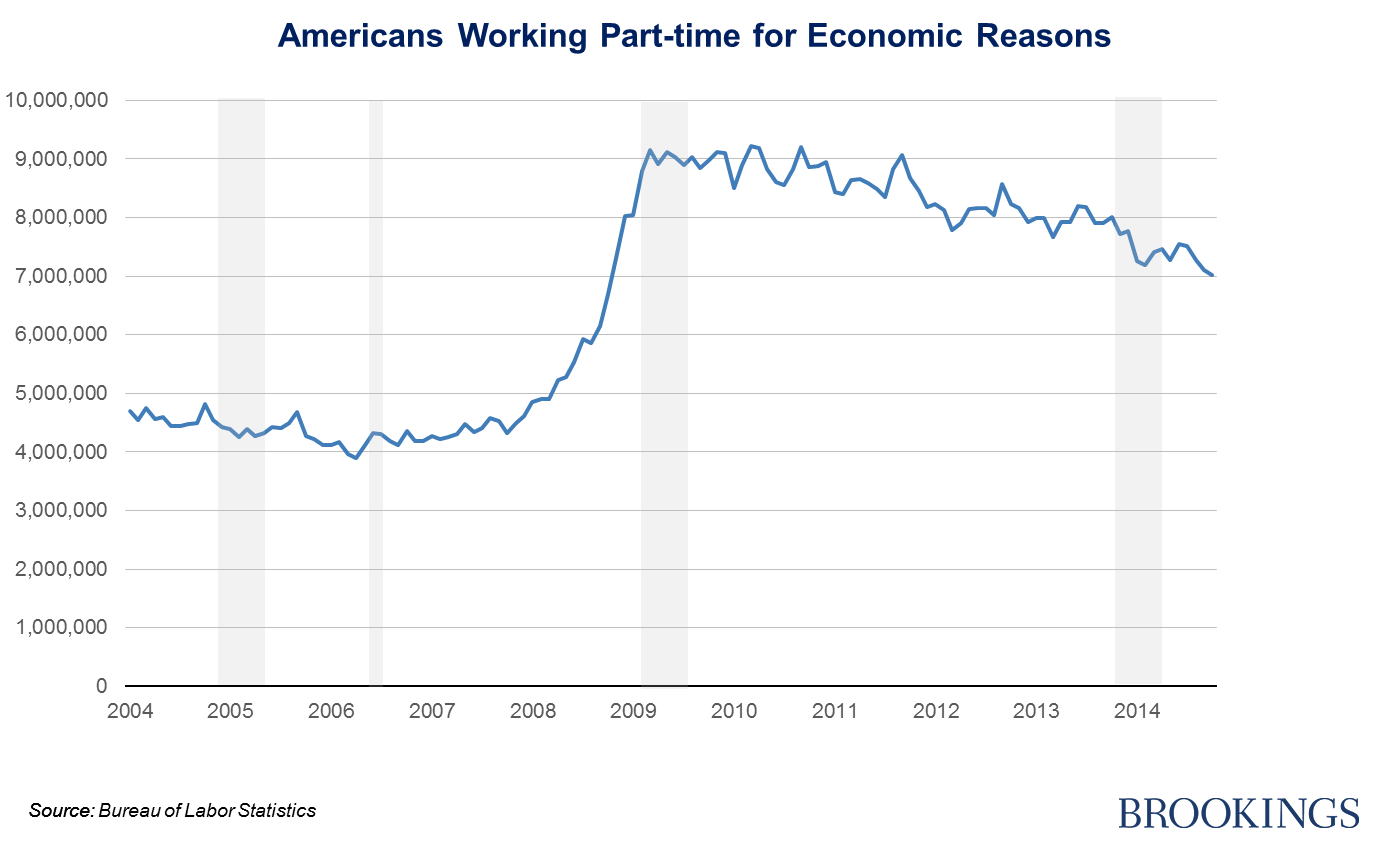
8. Meanwhile, millions of Americans are working shorter hours than they’d like. The chart below plots people involuntarily working part-time because they’re unable to find full-time work, or because employers cut hours due to depressed demand for goods and services. This is especially worrying when considered alongside another trend: the rise of “just-in-time employment.” Among hourly workers between the ages of 26 and 32, 41% learn their hours less than a week in advance and half have no control over their schedules. This instability is especially hard on parents juggling jobs and child care.
9. The difficulties that low-income workers face are compounded by the fact that the minimum wage is lower than it has been historically. As a share of average hourly wages, it’s more than 10 percentage points below its 1964 level. Congressional Republicans have blocked efforts to raise the federal minimum ($7.25); in November, four states voted to raise the minimum wage: Alaska ($9.75 in 2016), Nebraska ($9.00 in 2016), South Dakota ($8.50 in 2015), and Arkansas ($8.50 in 2017).
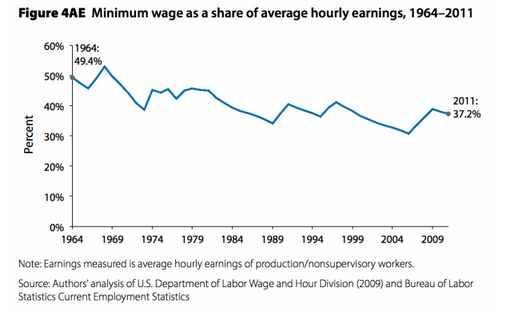
Source:
Economic Policy Institute
10. In the past year, more jobs have appeared in higher-paying industries, although that doesn’t necessarily mean that all of the new jobs in those sectors are high-paying.
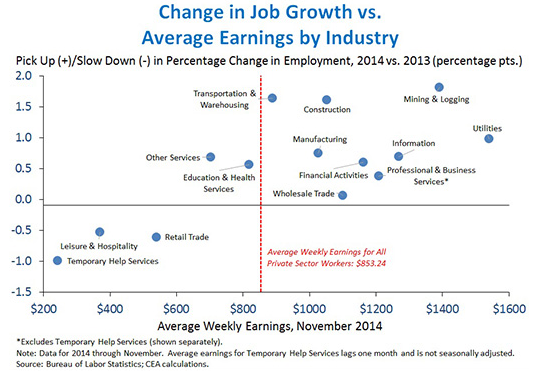
Source: Council of Economic Advisers
And real growth in average earnings has been sluggish at best. It’s barely outpaced the rate of inflation:
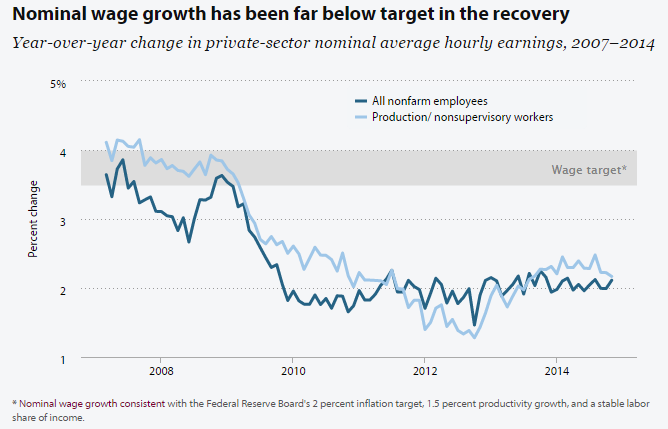
Source:
Economic Policy Institute
2014 offered some reasons for optimism, but these economic statistics should be a call to action as well; wage growth lags behind productivity growth, and there are still too few jobs for all those who want them.
The Brookings Institution is committed to quality, independence, and impact.
We are supported by a diverse array of funders. In line with our values and policies, each Brookings publication represents the sole views of its author(s).


Commentary
Op-edTen Things You Should Know About Jobs
December 22, 2014