Alert voters everywhere realize the economy is neither as strong as claimed by the party in power nor the disaster described by the opposition. The election season will bring many passionate but dubious claims about economic trends. People running for office know that voters rank the economy near the top of their concerns. Of course, perceptions of the economy differ from one voter to the next. A few of us are soaring, more are treading water, and too many are struggling just to stay afloat.
Since reaching a low point in 2009, total U.S. output—as measured by real GDP—has climbed 15 percent, or about 2.1 percent a year. The recovery has been long-lived and steady, a tribute to the stewardship of the Administration and Federal Reserve. The economic rebound has also been disappointingly slow in view of the depth of the recession. GOP office seekers will mention this fact a number of times before November.
Compared with the worst months of the Great Recession, the unemployment rate has dropped by half. It now stands at a respectable 4.9 percent, almost 3 points lower than the rate when President Obama took office and far below the rate in fall 2009 when it reached 10 percent. Payroll employment has increased for 77 consecutive months. Since hitting a low in January 2010, the number of workers on employer payrolls has surged 14.6 million, or about 190,000 a month. While the job gains are encouraging, they have not been fast enough to bring the employment-to-population ratio back to its pre-recession level. June’s job numbers showed that slightly less than 80 percent of adults between 25 and 54 were employed. That’s almost 2 percentage points below the employment-to-population rate on the eve of the Great Recession.
One of the most disappointing numbers from the recovery has been the growth rate of wages. In the first 5 years of the recovery, hourly wages edged up just 2 percent a year. After factoring in the effect of consumer price inflation, this translates into a gain of exactly 0 percent. The pace of wage gain has recently improved. Workers saw their real hourly pay climb 1.7 percent a year in the two years ending in June.
The economic bottom line for most of us is the rate of improvement in our family income after accounting for changes in consumer prices. No matter how household income is measured, income gains have been slower since 2007 than they were in earlier decades. The main reason is that incomes produced in the market—in the form of wages, self-employment income, interest, dividends, rental income, and realized capital gains—fell sharply in the Great Recession and have recovered very slowly since then. That a steep recession would cause a big drop in income is hardly a surprise. Employment, company profits, interest rates, and rents plunged in 2008 and 2009, pushing down the incomes Americans earn in the market. The bigger surprise has been the slow recovery of market income once the recession was behind us.
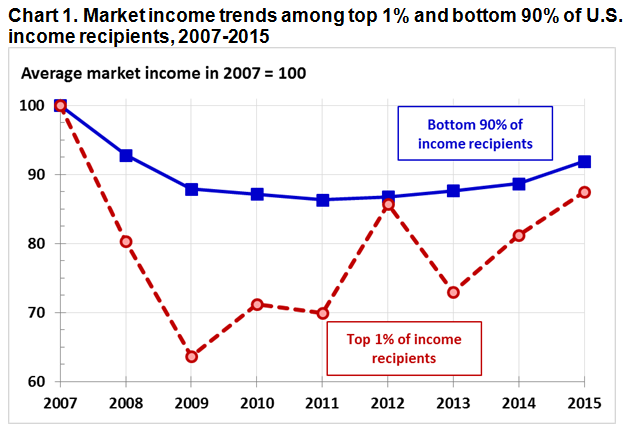
Some critics of the recovery argue that the income gains in the recovery have been highly skewed, with a disproportionate share obtained by Americans at the top of the income ladder. Economist Emmanuel Saez tabulates U.S. income tax statistics to track market income gains at the top of the distribution. His latest estimates show that between 2009 and 2015 income recipients in the top 1 percent enjoyed real income gains of 24 percent. Among Americans in the bottom nine-tenths of the income distribution, average market incomes climbed only 4 percent.
Source: Emmanuel Saez tabulations of U.S. income tax return data (including capital gains), URL = http://eml.berkeley.edu/~saez/TabFig2015prel.xls
However, Saez’s estimates also show that top income recipients experienced much bigger income losses in the Great Recession. Between 2007 and 2009 they saw their inflation-adjusted incomes drop 36 percent (see Chart 1). In comparison, the average market income of Americans in the bottom nine-tenths of the distribution fell just 12 percent. These numbers mean that top income recipients have not yet recovered the income losses they suffered in the Great Recession. In 2015 their average market income was still 13 percent below its pre-recession level. For families in the bottom nine-tenths of the distribution, market income was “only” 8 percent below its level in 2007.
Only about half of households rely solely on market income to support themselves. The other half receives income from government transfers. What is more, this fraction tends to increase in bad times. Many retirees rely mainly on Social Security to pay their bills; they depend on Medicare or Medicaid to pay for health care. Low-income Americans often have little income from the market, and they may rely heavily on public assistance, food stamps, or government-provided health insurance. When joblessness soars the percentage of families receiving government benefits rises, largely because of increases in the number of workers who collect unemployment insurance.
Government benefits, which are not counted in Saez’s calculations, replace part of the market income losses families experience in a weak economy. As a result, the net income losses of most families are much smaller than their market income losses. The Congressional Budget Office (CBO) recently published statistics on market income and before-tax and after-tax income that shed light on the size and distribution of household income losses in the Great Recession and ensuing recovery. The tabulations show that, except for households at the top of the distribution, net income losses were far smaller than the losses indicated in Saez’s income tax data.
Source: Congressional Budget Office (2016) household income data (including capital gains), URL = https://www.cbo.gov/sites/default/files/114th-congress-2015-2016/reports/51361-SupplementalData-2.xlsx.
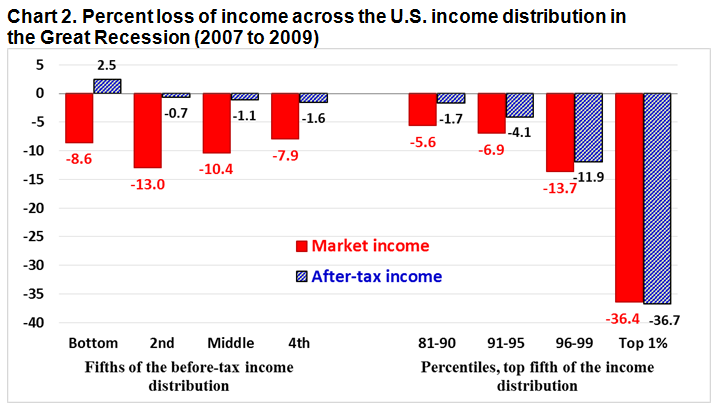
For example, among households in the middle fifth of the before-tax income distribution, average market income fell more than 10 percent in the Great Recession (see Chart 2). If we include government transfers in the income definition, average income fell 4.4 percent. If we account for the federal taxes families pay, average net income fell just 1 percent. In contrast, among households in the top 1 percent of the distribution, average market income fell 36 percent, average income including government transfers fell 36 percent, and average income net of federal taxes fell 37 percent. Government transfers provided little if any protection to top-income households.
The CBO income statistics end in 2013, so they do not tell us how net income gains have been distributed in the last couple of years. Nonetheless, based on Saez’s income tax tabulations it is very unlikely top income recipients have recovered the net income losses they experienced in the Great Recession. All the available statistics show household income gains since 2007 have been negligible or small, and this is true across the income distribution.
It is popular to say slow income gains in the middle and at the bottom of the distribution are due to outsize income gains among families at the top. While this story is at least partly true for the three decades ending in 2007, it does not fit the facts for the years since 2007. CBO’s latest net income tabulations show that inequality was almost 5 percent lower in 2013 than it was in 2007. The Great Recession hurt the incomes of Americans up and down the income distribution, but the biggest proportional income losses were at the very top. To be sure, income gains in the recovery after 2009 have been concentrated among top income recipients. Even so, their income losses over the recession and recovery have been proportionately bigger than the losses suffered by middle- and low-income families.
Editor’s note: This piece originally appeared in Real Clear Markets.
The Brookings Institution is committed to quality, independence, and impact.
We are supported by a diverse array of funders. In line with our values and policies, each Brookings publication represents the sole views of its author(s).


Commentary
Op-edIncome growth has been negligible but (surprise!) inequality has narrowed since 2007
July 22, 2016