Editor’s Note: In a new interactive, the Kenya Devolution and Resource Sharing Calculator, Mwangi Kimenyi examines the current allocation of resources to Kenya’s county governments and invites governments to explore possible alternatives.
In 2010, Kenyans enacted a new constitution, which established of a system of devolved government with 47 lower level county governments. The operation of the county governments started soon after the March 2013 elections, which included the election of county governors, deputy governors and representatives. These 47 new county governments are now in charge of overseeing some functions— such as the provision of health care, pre-primary education, and maintenance of local roads— which were previously the responsibility of Kenya’s national government. In turn, these county governments will receive a share of national revenues. The county governments will also be expected to mobilize revenue from other sources within their counties, such as taxes on property and entertainment.
Kenya’s Commission on Revenue Allocation (CRA) is supposed to recommend to the National Assembly the basis for equitable sharing of revenues raised nationally. Specifically, it will decide how much revenue will be divided between the national government and the county governments, and how much each county government will receive. It has already been agreed that 84.5 percent of the revenues will be allocated to the national government while 15 percent will be allocated to county governments. The remaining .5 percent is designated as an equalization fund.
Therefore, the commission’s main task has been trying to determine how much of the 15 percent each of the 47 counties will get and how to distribute this 15 percent in an equitable and fair way. This is not easy task given the differences across the counties and the fact that any allocation criterion is likely to favor some counties over others. Last year, the Kenyan National Assembly accepted the CRA’s recommendation to allocate revenues to the country’s county governments based on the weighting in the table below.
Revenue Sharing Among Counties in Kenya
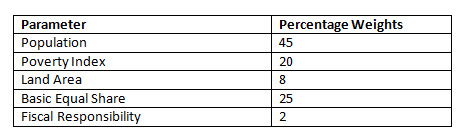
The allocation formula implies that counties will receive a greater share of revenue the larger their population, the higher their poverty rate and the larger they are in terms of land mass. Because all counties would face some fixed costs of running their local government, 25 percent of the revenues are to be shared equally among all counties. Another 2 percent of revenue is provided as an incentive for fiscal responsibility, and will be initially shared equally among the counties. The idea is that those counties that manage their resources better and are more effective in mobilizing their own resources will be rewarded by receiving a higher share of the resources under the fiscal responsibility parameter.
The Kenya Devolution and Revenue Sharing Calculator shows how resources are being allocated to Kenya’s different county governments based on the agreed upon revenue allocation criteria. The calculator provides an easy way to navigate and compare the different revenue allocations across counties. More importantly, the calculator provides policymakers and citizens the means to conveniently explore how allocations change under different weightings. Policymakers and citizens may want to compare different allocation weightings to determine how best to allocate resources based on different overriding objectives, such as poverty alleviation or the cost of delivering general services. Please visit the Kenya Devolution and Revenue Sharing Calculator to see how different weightings impact how much is allocated to each county.
Another point of contention has emerged regarding the appropriate amount of the total revenues that should be shared by Kenya’s 47 county governments. County governments are keen to increase the amount of funding they receive from the national government. Therefore, the calculator also shows how allocations change across the counties when the total amount shared is increased. To explore the potential impact of greater revenue sharing, please visit the calculator.
Rationalizing Resource Allocations: An Outcomes Approach
The approach for allocating resources described above has several merits. For one, it is quite simple and transparent. Secondly, it seeks to equalize allocations based on proximate measure of deprivation (poverty rates) and costs of delivering services (land area, size of population). Finally, the approach takes into account the fixed costs of operating county governments and allocates an equal share for this purpose.
However, many questions remain as to the suitability of such an approach. Any allocation criteria necessarily involves trade-offs. In addition, in transferring resources and responsibilities to county governments, there is a need to evaluate not only the cost of the services but also the capacity of the county governments to deliver those services.
In regard to allocation to county governments, there is need to go beyond the generalized approach and instead focus more specifically on the cost of delivering specific services that are under the management of the county governments. This will require in-depth analysis of data to capture the variations in the delivery costs across various counties. This means that policymakers in Kenya must not only focus on allocations based on broad categorization, such as health care, but rather examine specific services such as immunizations, malaria treatment, etc. Such an approach calls for line-item budgeting for each of the “unbundled” services. In addition to providing a rational approach to resource allocation, line-item budgeting is crucial to assisting in monitoring and evaluation of resource use.
##1##
To demonstrate allocation based on such an approach, we take the case of treating malaria. [1] The starting point is to get information on the incidence of the disease across the counties. Table 1 shows the proportion of the population that reported having fever and malaria in the most recent data available. We assume that the data reflects the prevalence of the illness across the counties. The task that we want to deal with is to approximate the financial resources that each county would require to treat malaria given the incidence of the disease captured by the data. The cost associated with malaria treatment generally would include the actual cost of the medicine and the costs of delivering the treatment. The key is to determine how the cost of treating malaria varies across the counties.
Estimation of the costs of the delivery of services in many developing countries is severely limited by data. We use preliminary data to estimate a generalized cost function of provision of services and apply to treatment of fever and malaria. [2] The simple relationship suggests that although the actual cost of medicine may be the same across all of Kenya’s counties, the total cost of treatment will vary across the various jurisdictions. The relationship shows that the cost of delivering the services increases with the size of the county as would be expected. The squared term of SIZE [3] suggests that the increase in cost of delivery increases at a decreasing rate. The relationship also shows that the costs decrease the higher the population density and also the higher the proportion of paved roads.[4] This suggests that even if two counties had the same incidence of this particular illness, the resources required to deal with the illness will vary depending on the county characteristics.
Given the information above and assuming the cost of the drug and the average cost of delivering the treatment add up to KSh 100 [5], and if the goal is to achieve 100 percent treatment, we can then compute the total revenues that should be allocated to each of the counties. We are making a strong assumption that the incidence of illness of fever and malaria in one year is a good predictor for illness in future periods. [6]
Table 1 shows the total allocations and also allocation per capita for each of the counties based on the assumed generalized cost function. This approach would then be the basis for line item budgeting for all services. Of course the allocations would change as costs of drugs and delivery change.
We acknowledge that the data to estimate the costs of a specific service as done here is quite imprecise. Nevertheless, the example demonstrates an approach for rationalizing resource allocation that is superior to the current broad allocation based on population, poverty and land mass. These factors do matter but there is need to link them to the actual delivery of services.
Implementing an allocation based on the cost of delivery is data intensive and should be informed by good research. For Kenya, a priority then should be to strengthen data gathering so that more of the relevant characteristics of the counties are captured. Good and timely data is critical to estimating the costs of delivering particular services.
[1] We caution that due to data limitations, the only information available that we are able to compare incidences of illness across the Kenyan counties shows the proportion of population that reports have had “fever and malaria.” It is conceivable that the fever is related to malaria or it could be due to other illness. For our estimation and costs computation, we assume that the illness relates to malaria. https://opendata.socrata.com/dataset/Kenya-County-Data-Merged/rdww-gahu/widget_preview?width=500&height=425&variation=y34g-bnf3 last accessed October 15, 2013
[2] The generalized cost function is shown by the following empirical relationship:
CT = ∑[[X1 ] +0.0012SIZE- 0.000000008 (SIZE)2 – 0.001DENSITY – 0.2PAVED ROADS]
Where:
CT = the total cost of treatment per person;
X1 = the cost of the drug and the average costs of delivering the service per person (medical staff, facilities, transportation, storage, etc.) (estimated at KSh 100)
SIZE = the size of the county in square kilometers
Density = population density
Paved Roads = percentage of paved roads in the county
The relationship is based on estimating how different parameters impact on costs of delivering services. The relationship is only indicative as many more variables that impact on delivery costs are not available
[3] Please see previous footnote for explanation of variable SIZE.
[4] The logic of including paved roads is simply that it is easier for medical providers and also the patients to access treatment centers and of course to transport drugs and other materials, etc. However, the measure used here is quite imprecise as we do not know the proportion of the county that is served by the paved roads or in fact the quality of those roads. But again, the idea is to demonstrate some of the factors that can impact on the cost of delivering services.
[5] There many drugs that are used to treat malaria and the costs vary widely. Furthermore the treatment does vary by age group. The approximation should therefore be used for illustrative purposes.
[6] Of course not all that report illness necessarily seek treatment.
The Brookings Institution is committed to quality, independence, and impact.
We are supported by a diverse array of funders. In line with our values and policies, each Brookings publication represents the sole views of its author(s).


Commentary
Op-edDevolution and Resource Sharing in Kenya
October 22, 2013