
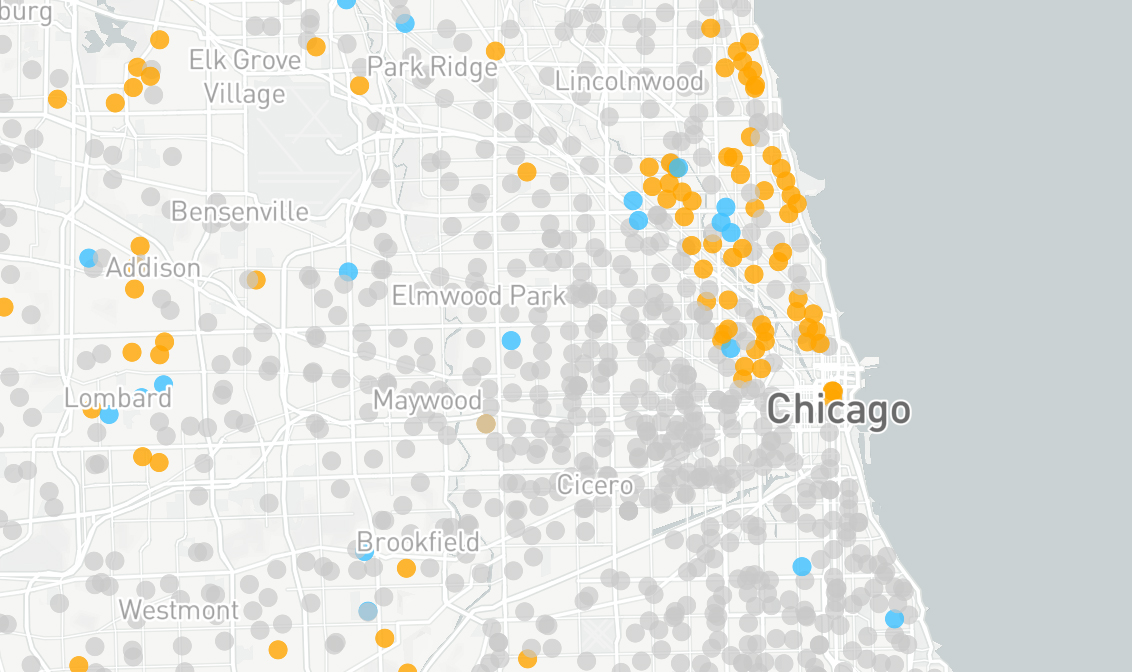
How closely does the racial makeup of U.S. public schools resemble that of their surrounding neighborhoods? New research from the Center on Children and Families examines the racial makeup of public schools—both traditional and charters—across the country to identify schools whose racial imbalance with respect to their surrounding neighborhoods makes them ‘outliers’ within their states. See how your school compares below, and read the methodology for more on how we define outliers:
Methodology
How we determined “outliers”
First, we take a look at the racial makeup of the school’s surrounding neighborhood. Then we determine whether a school is an outlier for each racial category (white, black, Hispanic) based on the degree to which the racial imbalance between a school and its neighborhood is substantially outside its own state’s pattern of school-neighborhood differences, assuming a normal distribution. This means you may see some schools—in Washington, D.C. or Mississippi, for instance—where the black or white student populations are underrepresented or overrepresented by as much as 30 percent compared to their neighborhoods, but aren’t classified as an outlier. That’s because the threshold for determining outliers varies by state, and some states or districts—like D.C. or Mississippi—have higher thresholds because the state’s range of imbalance scores is wider.
Why might a school be an outlier?
There are many reasons any given school in this analysis could be a racial imbalance outlier within its state, and we want to emphasize that being an outlier is neither a positive nor negative assessment of the school itself. Among these reasons: Intentional strategies to integrate schools (for example, busing or court-ordered desegregation), greater school choice, varying levels of private school attendance, or because a school offers specific and specialized curriculum (for example, Spanish-language schools may have high representation of Hispanic students by comparison to the immediate surrounding area than other schools in their state).
How we matched schools to neighborhoods
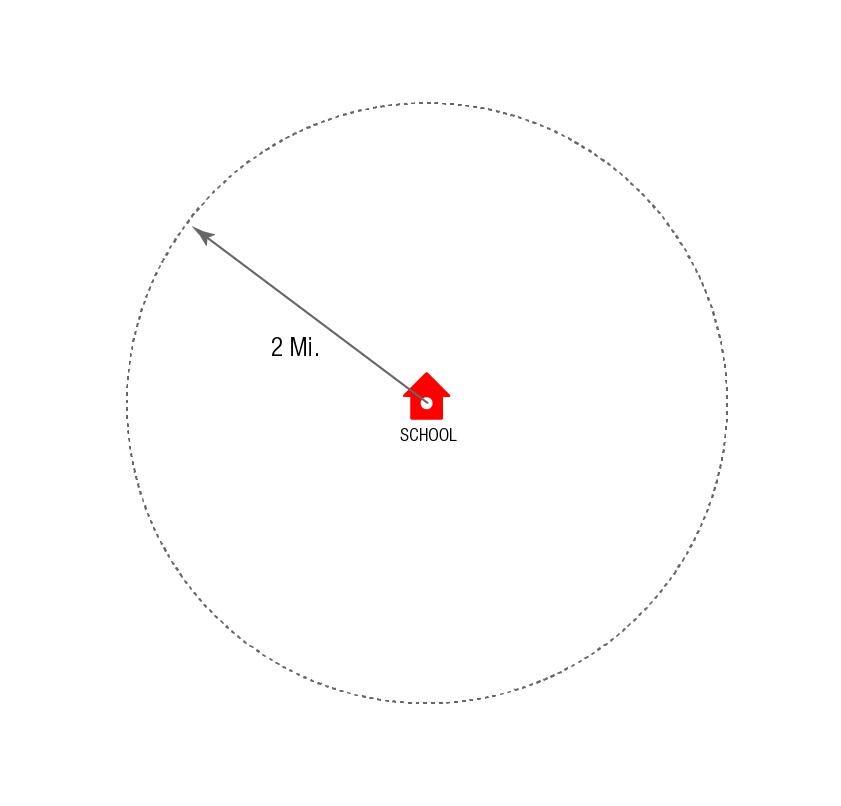
1. Two mile radius
Matched neighborhoods are located within 2 miles of a given school
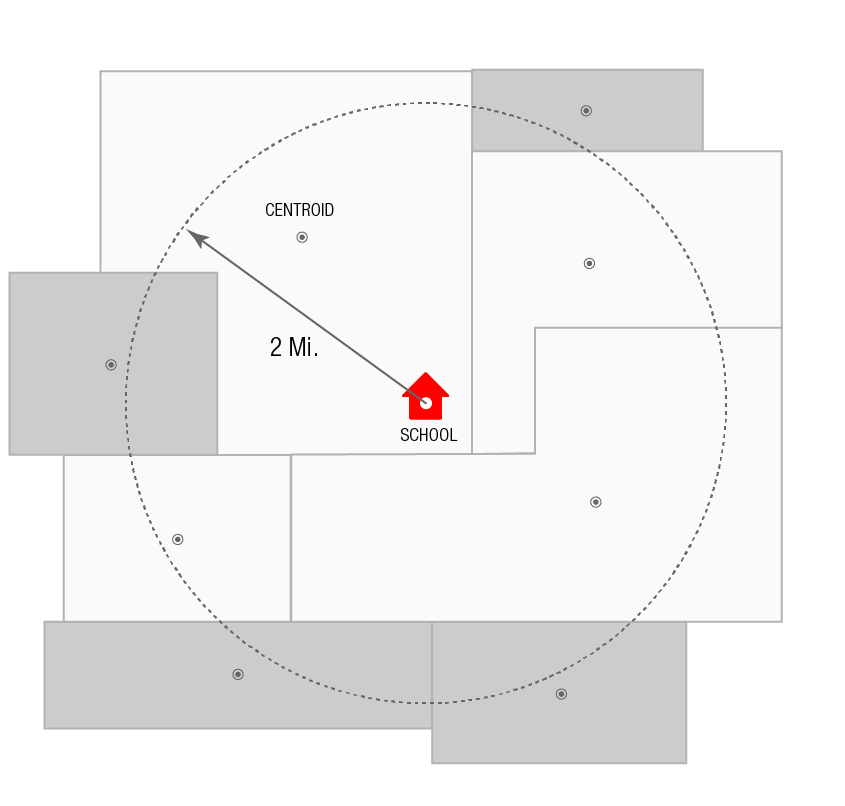
2. Census Blocks
Matched neighborhoods include district census blocks whose centroids are located within 2 miles of a given school
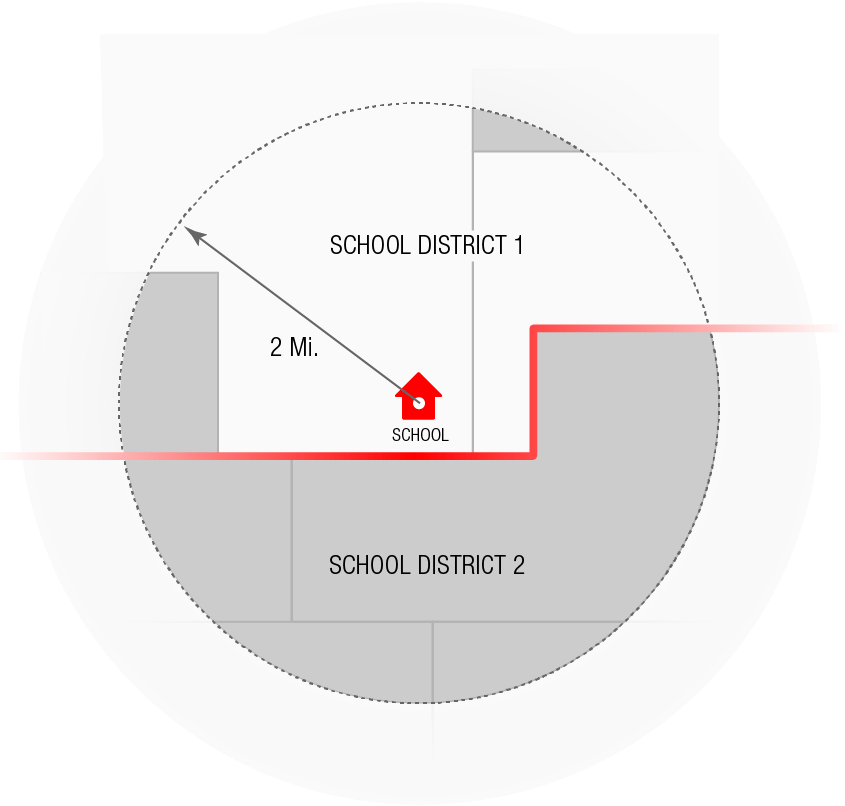
3. School Districts
Matched neighborhoods are only within the cooresponding school district
Note: Locations based on the physical addresses for schools are provided by the National Center for Education Statistics (NCES) Common Core Data (CCD) for the School Year 2013-2014. Errors in location may appear due to data lags or other discrepancies. Also, note that the sample excludes those schools with fewer than 25 students; non-regular schools (vocational, alternative, and special education schools); virtual schools; schools without charters; Head Start schools; and schools whose highest grade of enrollment was pre-kindergarten.
Authors


The Brookings Institution is committed to quality, independence, and impact.
We are supported by a diverse array of funders. In line with our values and policies, each Brookings publication represents the sole views of its author(s).