The Centers for Medicare and Medicaid Services (CMS) recently released more detailed ACO-level data for participants in first two years of the Pioneer ACO Model. The program, which is designed for health systems with more experience assuming financial risk for patient populations, has generated savings and improvements in quality measures, but has also struggled to retain participants. The program began with 32 provider organizations; following a series of recent announcements there are now 19 total participants.
Last month, CMS announced that the Pioneer Program was able to yield total program savings of $96 million in its second year and resulted in ACOs sharing in savings of $68 million. CMS also reported that the Pioneers were able to improve mean quality scores by 19 percent and increased performance on 28 of 33 measures between performance year one and performance year two.
Financial Results
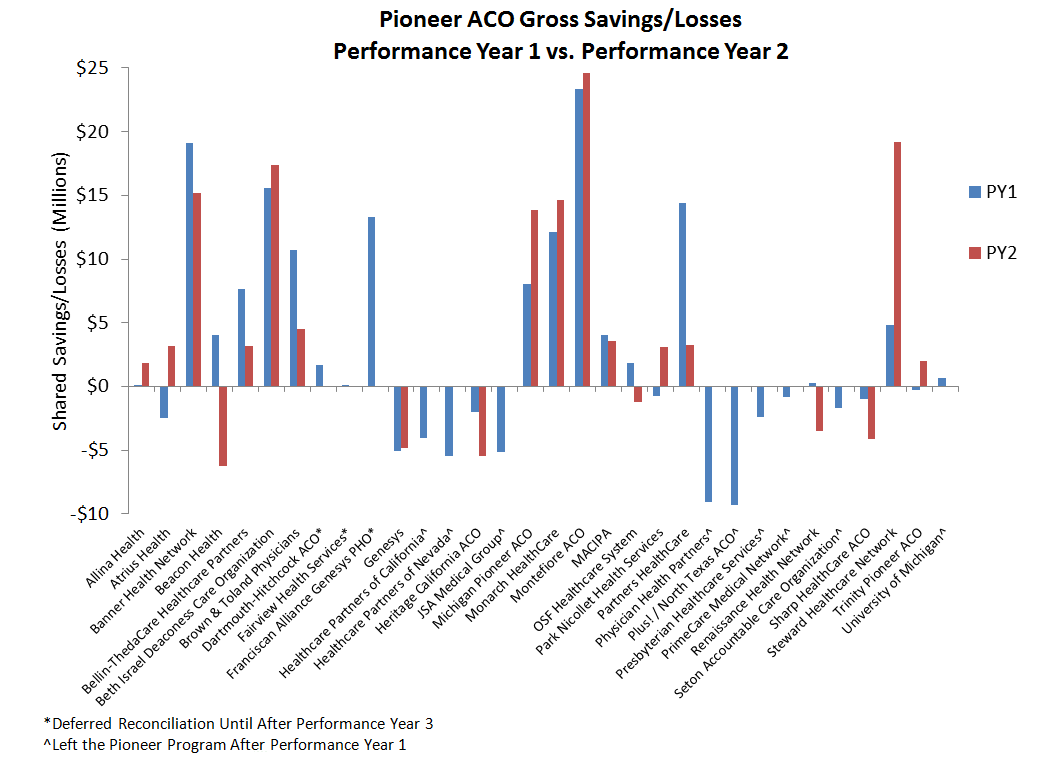
The latest financial results provide more participant-level data and allow for a new level of analysis of performance across all these ACOs. In year one of the program, financial performance for individual Pioneers ranged from a gross loss of $9.31 million to a gross savings of $23.34 million. Thirteen Pioneers reduced costs enough to qualify for shared savings, with an average of $5.85 million returned to the ACOs, ranging from $1.00 million to $14.00 million. One ACO owed shared losses of $2.55 million. The remaining eighteen ACOs were within the minimum savings or loss rate and did not earn shared savings or owe money to Medicare due to losses.
Following year one, nine Pioneer ACOs either left the Medicare ACO program entirely, or moved to the lower risk Medicare Shared Savings Program (MSSP). Eight of the nine Pioneers that left the program failed to reduce spending in their first year. Out of the remaining 23 participants in the second performance year, three of these ACOs opted to defer reconciliation until the end of Performance Year 3. The 20 Pioneers with final Performance Year 2 data had financial performance ranging from a gross savings of $24.59 million to gross losses of $6.26 million. Fourteen ACOs reduced spending in Performance Year 2, eleven of which reduced enough to qualify for shared savings. The average shared savings for these ACOs was $6.55 million, ranging from $1.22 million to $13.41 million. Three Pioneers shared losses, averaging $2.33 million back to the Medicare program.
The table below shows the breakdown of ACOs according to whether they reduced spending, increased spending, shared in savings, or owed money back to Medicare due to losses. More than half of the Pioneers were able to reduce spending in year one (18/32) and year two (14/23), with more than one-third of total ACOs earning shared savings in each year as well.
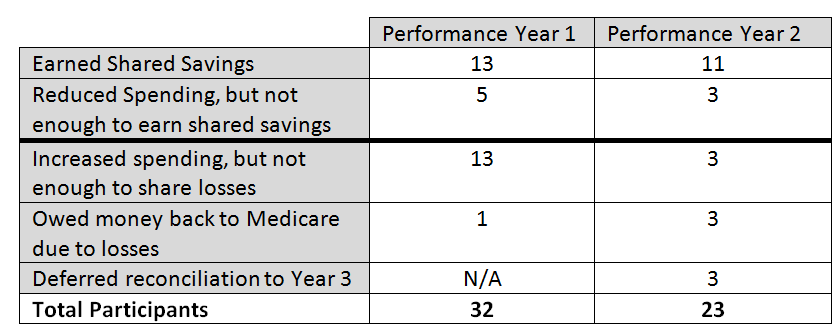
The data also suggest that those ACOs that were most successful in reducing spending in the first year were also more likely to reduce spending in their second year. As the chart below shows, three ACOs that earned shared savings in year one owed money back to Medicare due to losses in year two, while no ACO that had shared losses in year one was able to attain shared savings in year two.
Quality Results
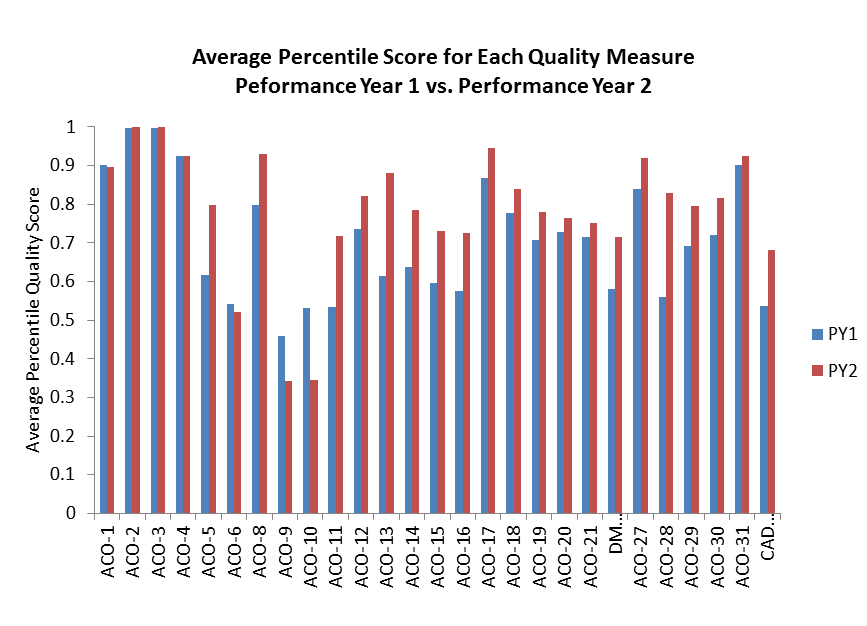
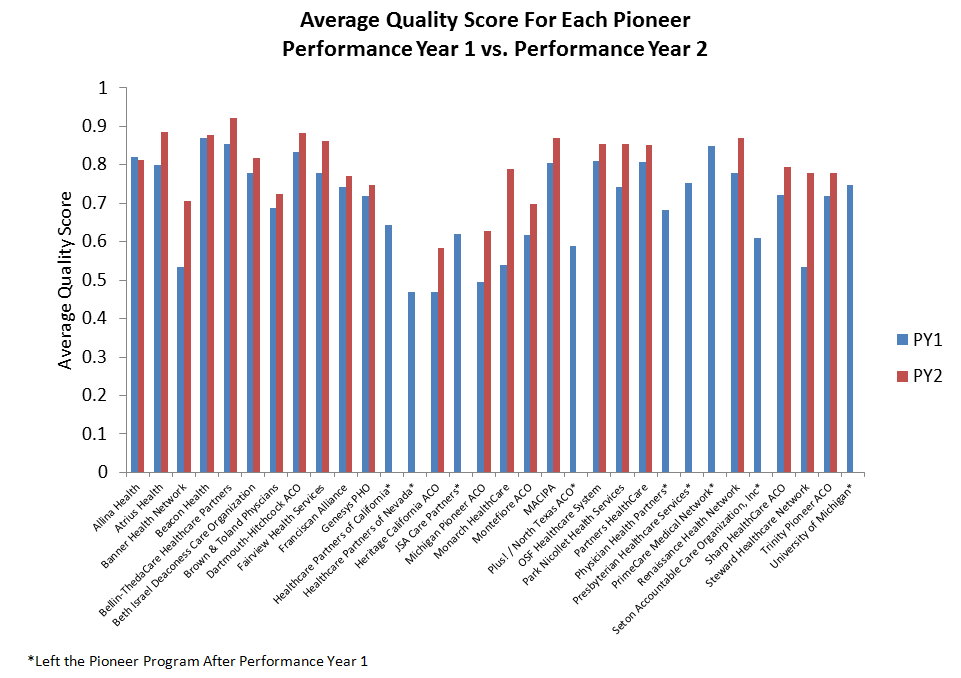
CMS also released ACO-level performance on all 33 measures for Pioneer participants in year one and year two. The 23 ACOs that remain in the Pioneer Program showed overall improvement in average quality scores from the first to second performance year. The ACOs also improved overall on 28 of 33 measures, as the chart below shows.
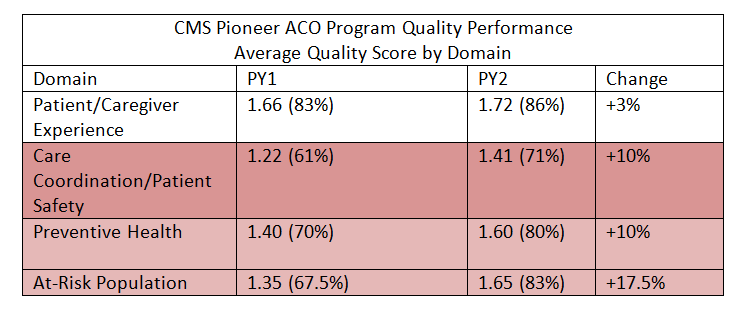
The quality domain with the greatest improvement in year two was Domain 4 (At Risk-Populations) which saw an overall improvement from 67.5% to 83%. The marked improvement in this domain suggests that ACOs are making progress at better coordinating and delivery care for high-risk patients, many of whom have multiple chronic conditions. Chronic care management for conditions such as diabetes, coronary artery disease, and hypertension is critical for the continued success of accountable care efforts. All other domains saw average quality improvement as well, summarized below.
Likewise, almost all of the individual Pioneer ACOs improved their performance on quality measures from year one to year two. Of the ACOs that remained in the program for year two, all but one ACO was able to improve its overall quality score in its second year.
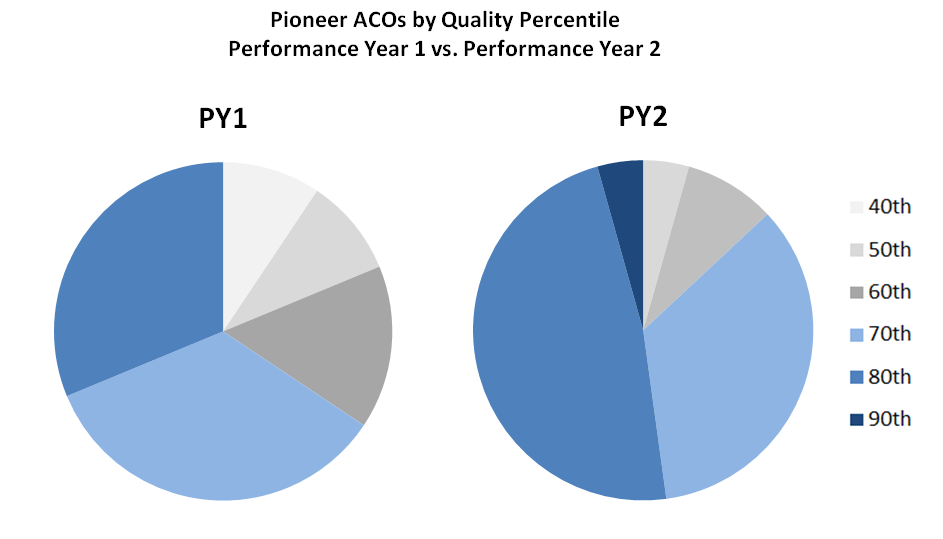
Additionally, the percentage of Pioneer ACOs performing in the 80th or 90th percentile in quality scores also increased from year one to year two, as shown in the chart below.
Putting Together Financial and Quality Results
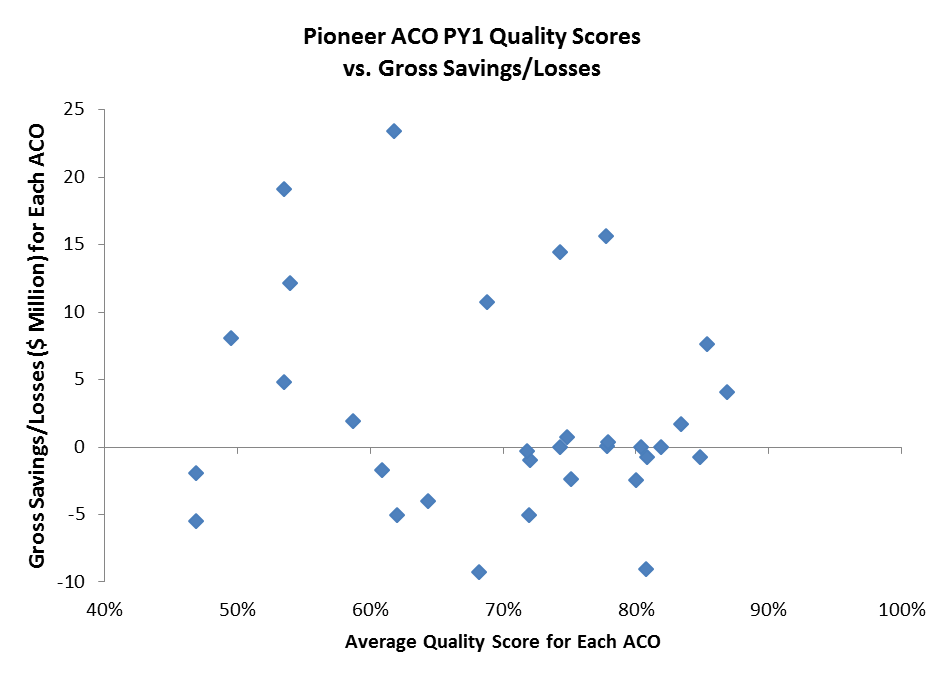
In year one of the Pioneer Program there appeared to be no direct correlation between average quality scores and gross savings or losses for individual ACOs. This may not be unexpected, especially since Pioneer ACOs in their first year are eligible for shared savings simply by reporting their quality. In subsequent years, however, the ACO’s quality score impacts the level of shared savings that the Pioneers are eligible to receive, so we might expect a bit more alignment between quality and financial performance. Average quality scores and level of savings or losses for each of the 32 first year Pioneer ACOs is below.
After year two, there still does not appear to be a direct relationship between higher quality scores and level of savings or losses in the Pioneer Program. Further examination of results begs additional questions about why certain ACOs clustered in different parts of the grid relative to others.
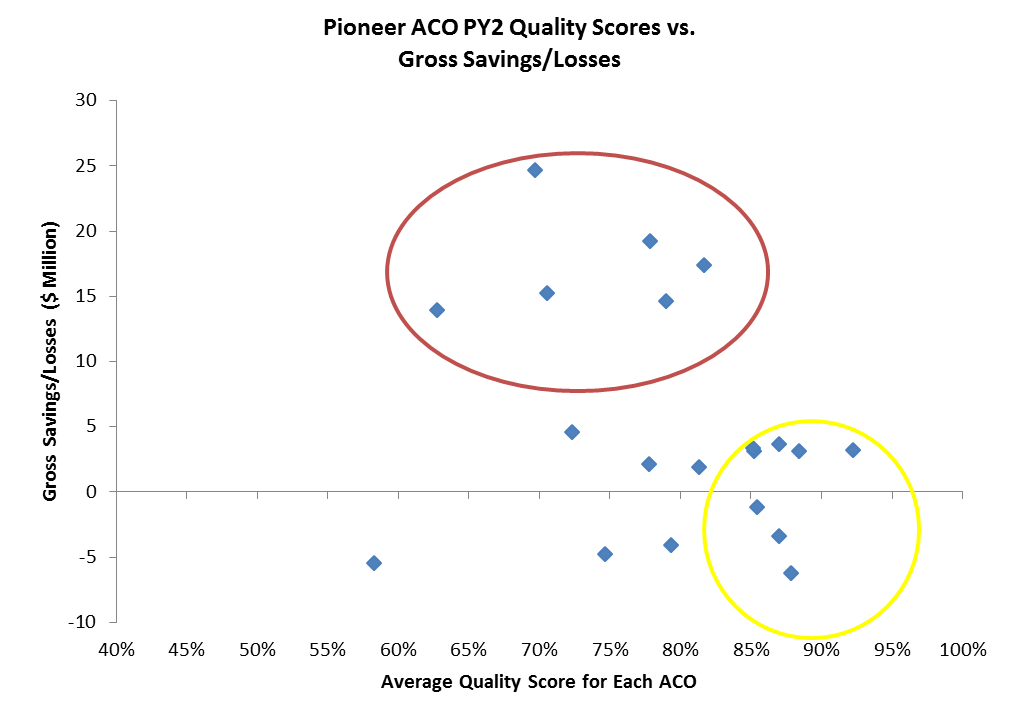
Of those ACOs in the red circle above— higher total savings and relatively average quality scores—two of the ACOs are from the Boston area and the remaining ones from other large metropolitan areas (New York City; Orange County, CA; Phoenix, AZ; and Detroit, MI). The average per capita Medicare spending for the counties corresponding to these ACOs is $11,544, compared to an average of $10,384 for counties corresponding to all 23 of the Pioneer participants.
Meanwhile those ACOs within the yellow circle had the highest quality scores, but also experience financial losses or slight savings. Many of these ACOs are from less densely populated areas, such as Maine, Wisconsin, and Illinois. There are a number of factors that could be contributing to their quality success, but little financial savings—healthier patient populations, a smaller or more engaged patient population, financial baselines impacted by lower per capita spending in these areas, or other factors driven by their region. Further analysis of these ACOs and the other public and private ACO programs, including both their characteristics and regional market characteristics, will provide needed further insights on the factors most likely to drive success.
Next Steps
These ACO-level data reflect the range of experiences across Pioneer participants. Some ACOs have sustained positive performance to date, while others have seen diminishing rates of return. Those organizations more committed to clinical transformation, patient outreach, and organizational change may be more likely to do better, but further analysis of differences in performance could enable the Pioneer Program and ACOs to achieve bigger impacts over time.
It is hard to know what the third performance year of the Pioneer program will show, but as noted earlier, the Pioneer Program has already lost over a third of its original 32 participants. Despite the decline in participation and mixed results so far, CMS remains optimistic and committed to the program, and the overall number of Medicare, Medicaid, and privately-insured individuals in ACO arrangements continues to rise. We can anticipate a proposed rule impacting the MSSP, likely later this Fall, which will impact elements of the Pioneer ACO program. Regulatory changes that may help increase the ability of the Medicare ACO programs to support better care while ensuring sustainability include: adjustments to attribution methods, benchmark calculations, collection and sharing of data with ACOs, updating performance measures, linking to other ongoing payment and delivery reforms, and creating more financial sustainability for program participants. The current Pioneer program can be a key step toward effective payment reform, but further steps are needed to assure long-term success.
The Brookings Institution is committed to quality, independence, and impact.
We are supported by a diverse array of funders. In line with our values and policies, each Brookings publication represents the sole views of its author(s).


Commentary
A More Complete Picture of Pioneer ACO Results
October 13, 2014