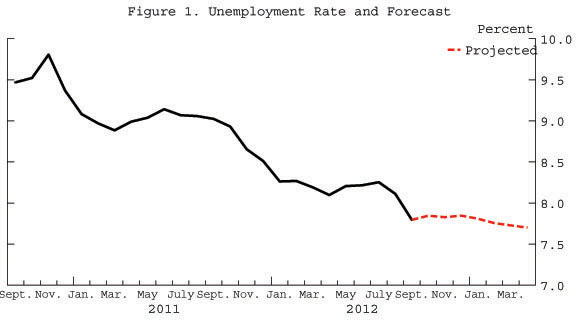
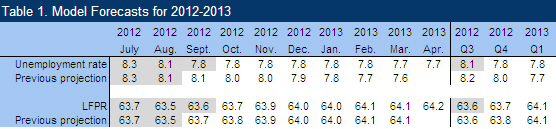
The significant decline in the unemployment rate in today’s report has taken most analysts by surprise, and there is now great uncertainty about the correct interpretation of the latest numbers. This may be because tentative interpretations have, so far, only been based on a static analysis. Using a dynamic analysis of the labor market and a careful study of the labor market flows underlying the unemployment rate, I find that the outlook is somewhat mixed: Although the unemployment rate declined dramatically, this is mostly due to an unexpectedly strong, but likely transitory, increase in workers job finding rate, and an unexpectedly strong, but equally transitory, decrease in workers job separation (mostly layoffs) rate. However, the current level of 7.8% is sustainable, and there should be no increase in unemployment going forward. In fact, I now project the unemployment rate to be constant at 7.8% over the next six months.
This post provides my first monthly update of the Barnichon-Nekarda model. (Full details are available here.) The starting point is understanding that the U.S. labor market is dynamic: Millions of people move between employment, unemployment, and out of the labor force every month. The rate at which people are entering unemployment (say, by losing their jobs) or leaving unemployment (by finding jobs or leaving the labor force) tells us a great deal about the current state of the labor market and its likely future developments. Our model’s forecast essentially summarizes this information in a rigorous way. To my knowledge, our approach is the only available tool for summarizing this informative and under-analyzed part of the monthly employment report. Moreover, our paper showed that this model has consistently yielded more accurate unemployment predictions in the near-term than either professional forecasters or other econometric models.
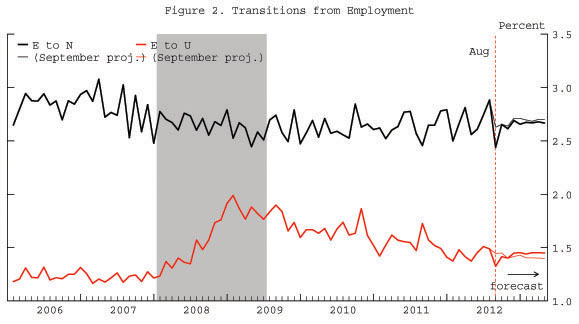
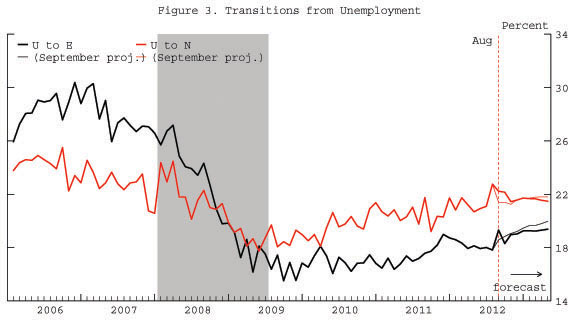
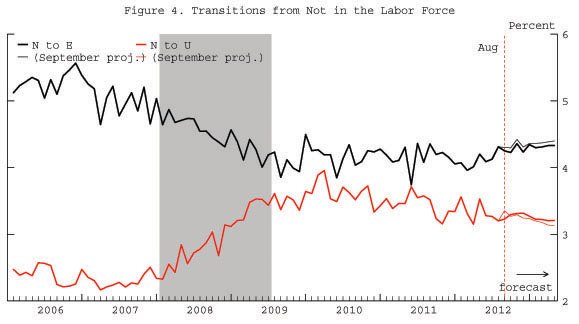
The unemployment rate in October was 7.8 percent, a 0.3 percentage points decline from September. Digging into the underlying flows—shown in figures 2 through 4 (thick lines)—unemployed individuals found jobs at a higher rate than in the previous month, and at a much higher rate than anticipated by the model last month (the previous forecasts are displayed as thin lines). The rate at which workers lose jobs and enter unemployment also displayed a large unexpected drop. Consequently, the large unexpected drop in unemployment owes to very strong hiring and few layoffs.
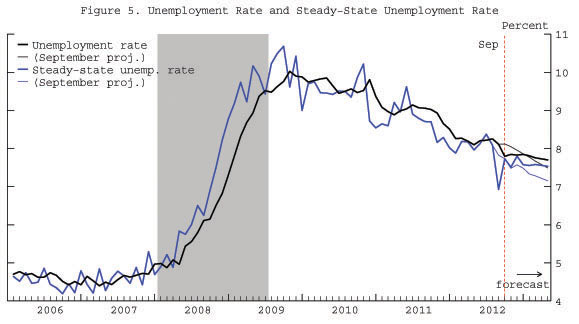
The “steady-state” unemployment rate, the rate of unemployment implied by the underlying labor force flows—the blue line in figure 5— stands at 7.8% in September and is projected to remain at that level until the end of the year. Our research shows that the actual unemployment rate converges toward this steady state. At the current level of 7.8%, the unemployment rate is already at its steady-state value. Thus, I anticipate the unemployment rate to stay roughly constant over the coming months.
More precisely, the model propagates forward its best estimate for how the flows between employment, unemployment and out-of-the labor force will evolve over time, and constructs the implications for the unemployment rate. The model interprets today’s report very cautiously: As shown in figures 2 and 3, the model considers the higher job finding rate and the lower job separation rate to be transitory blips, with the labor market reversing most of the September gains over the next month and bringing back the job finding rate on a more modest growth path, in line with the recent feeble recovery.
Comparing to last month forecast, the unemployment rate starts from a lower level but is now predicted to decline at a much slower rate. This happens because the large unemployment decline in September brought the unemployment rate closer to its steady-state value. As a result, the unemployment rate has no room to go down further. In other words, we traded a lower unemployment level now against a slower decline tomorrow.
The labor force participation rate is projected to rise over the next six months, driven by the slowly increasing job finding rate. Employed workers are less likely to leave the labor force than unemployed workers. Thus, by raising the number of employed workers relative to the number of unemployed workers, an increase in the job finding rate increases the labor force participation rate.
To read more about the underlying model and the evidence that it outperforms other unemployment rate forecasts, see Barnichon and Nekarda (2012).
The Brookings Institution is committed to quality, independence, and impact.
We are supported by a diverse array of funders. In line with our values and policies, each Brookings publication represents the sole views of its author(s).


Commentary
Unemployment Likely to Stay Around 7.8% for Six Months
October 5, 2012