Last month, the federal U.S. Citizenship and Immigration Services agency released metropolitan-level data on the number of people participating in the deferred action program for immigrants brought here as children. After an introductory look, my colleagues and I had more time to interpret the data as we approach the DACA program’s second anniversary and renewals and potential expansion. Here are a few highlights to illustrate our initial analysis, from my presentation at “Two Years of DACA Implementation: Learning from the Metro Experience,” an event hosted by the Pew Charitable Trusts.
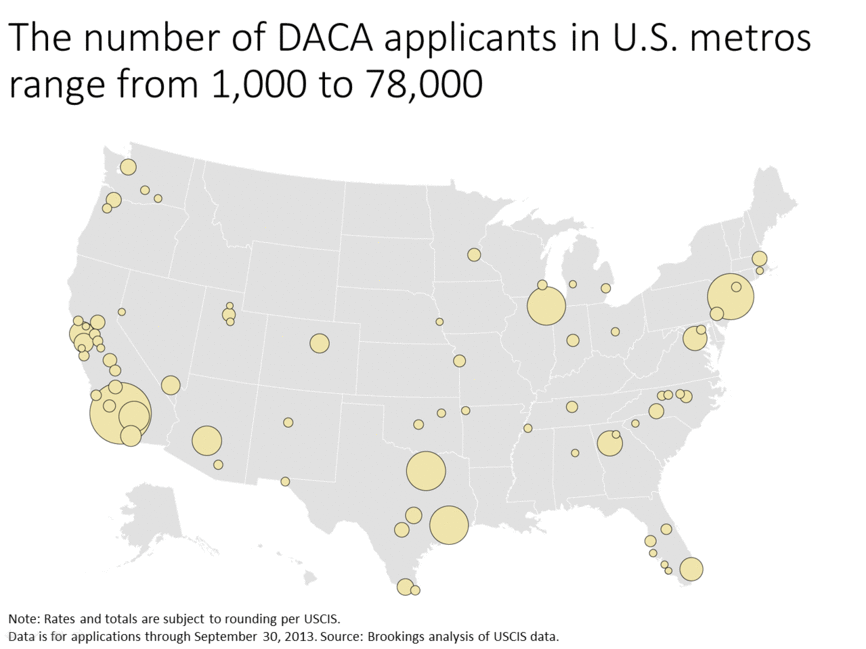
Where do DACA applicants live?
Recent data on Deferred Action for Childhood Arrivals applications released by USCIS for 75 metropolitan areas account for 82 percent of all requests nationwide from the start of the program through September of 2013. Most metro areas on this list have between 1,000 and 9,000 applications, but 11 are home to at least 11,000 DACA requestors. Los Angeles has the largest number of applicants—approximately 78,000 or 13 percent of all applicants. DACA requestors in the New York metropolitan area submitted 44,000 applications and Dallas-Fort Worth, Houston, Chicago, Riverside, Phoenix, Atlanta, San Francisco and Washington, D.C. all had between 12,000 and 31,000 applicants. Together, the applications in these 10 metro areas make up half of all applications nationwide.
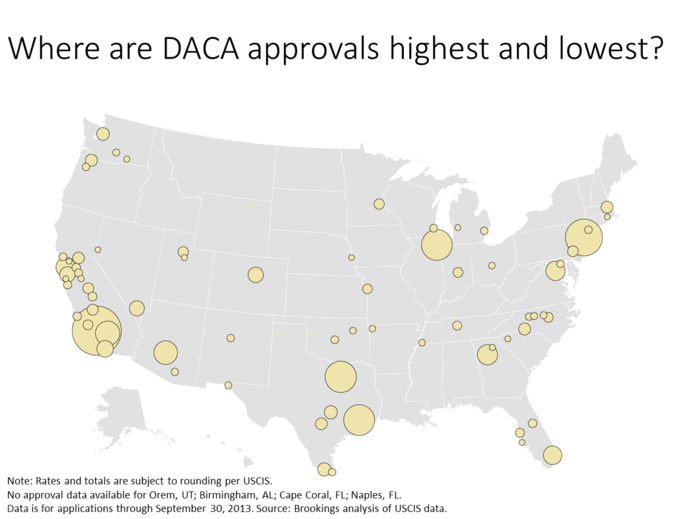
Where are approvals the highest and lowest?
The metropolitan average approval rate is 89 percent, and among the 10 largest metro areas, Chicago and Riverside have the highest approval rates, 93 percent each. Overall, California fares well with seven smaller metro areas with a high approval rate, as do some smaller DACA metro areas in the West, such as Albuquerque, Tulsa and Oklahoma City.
In regions with lower than average approval rates, New York and Houston are notable due to their large numbers of applications. While Miami and Boston had fewer applications, they are notable as well-established immigrant gateways with lower numbers and lower approval rates. Elsewhere lower-than-average approvals show up in many of the newest immigrant destinations such as Las Vegas, Reno, Nashville, Charlotte, Indianapolis and several metro areas in Florida. It is important to note that since USCIS did not distinguish pending applications from denials we cannot say these metro areas have higher denial rates. Rather, they either have higher denials or a higher share of applications still in the adjudication process.
What accounts for these differences across metropolitan areas?
Because not all applications have been decided, these approval rates by metropolitan area may change. Again, we don’t have enough information from these data to know, among those who have not been approved, how many have been denied and how many are still pending. We can assume that differences in application levels and approval rates reflect the size and characteristics of the underlying undocumented population, including birthplace, age structure and educational enrollment and attainment. No doubt the infrastructure in place to assist immigrants considering DACA applications matters. Well-informed, well-intentioned service providers may be the most effective in helping the DACA-eligible through the process.
The Brookings Institution is committed to quality, independence, and impact.
We are supported by a diverse array of funders. In line with our values and policies, each Brookings publication represents the sole views of its author(s).


Commentary
Digging Deeper on DACA Data
August 13, 2014