The February employment numbers, released today by the U.S. Department of Labor, suggest modest improvement in the labor market. The unemployment rate ticked down to 8.9 percent and payroll employment jumped 192,000, the largest increase since the Census-boosted hiring last May.
As in previous months’ postings, The Hamilton Project updates America’s “job gap,” the number of jobs that the U.S. economy needs to create in order to return to pre-recession employment levels while absorbing the 125,000 people who enter the labor force each month. This month we also return to our examination of longer-term labor market trends by looking at the earnings of Americans during the past four decades.
Long-Term Earning Trends
The American Dream promises that every generation can achieve more than the previous generation—but this has not been the case in recent decades. As noted in a previous jobs blog, American men have had a particularly hard time adjusting to the dynamics of a new world economy.
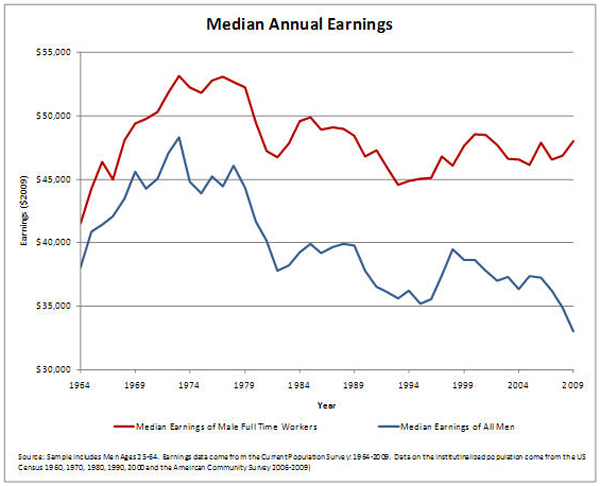
It has been widely observed that over the last several decades wage earnings for the median full-time American male worker have stagnated. For example, in 2009 the median full-time male worker aged 25-64 brought home $48,000—roughly the same as in 1969 after adjusting for inflation. [1]
At the same time, there has been a sharp decline in employment rates for men, particularly lower-skill men with less than a college degree. Today, only 66 percent of American prime-aged men hold full-time jobs, down from 80 percent in 1970. Further, the reduction in work is greater for the less-educated (79 percent of high-school graduates held a full-time job in 1970 versus 57 percent today.)
Three shifts in the employment landscape are largely responsible for the decline in full-time employment. First, men with jobs are less likely to hold full-time jobs. In 1970, 86 percent of jobs held by prime-age male workers were full-time jobs, compared with 81 percent today. Second, between 1970 and today, the share of men without any earnings at all increased from 6 percent to 18 percent. Third, 2.2 percent of these prime-age men now live in institutions—primarily prisons—and no longer appear in most labor-market statistics.
Thus, the pool of full-time workers has shrunk at the same time that the median wages of full-time workers has stagnated. Why is this important? It means that the statistics about the stagnation of wages like those above are based on a comparison of very different groups of workers. Put plainly, the story of the stagnation of wages is based on a comparison of apples to oranges.
When you compare apples to apples by looking on the experience of all men (rather than just the changing group of men able to find full-time work), the stagnation story has a different ending.
The below figure plots the median earnings based on all males aged 25-64, along with the more conventional plot that is based only on those men aged 25-64 that happen to work full-time.
This analysis suggests that earnings have not stagnated but have declined sharply. The median wage of the American male has declined by almost $13,000 after accounting for inflation in the four decades since 1969. This is a reduction of 28 percent!
The February Job Gap
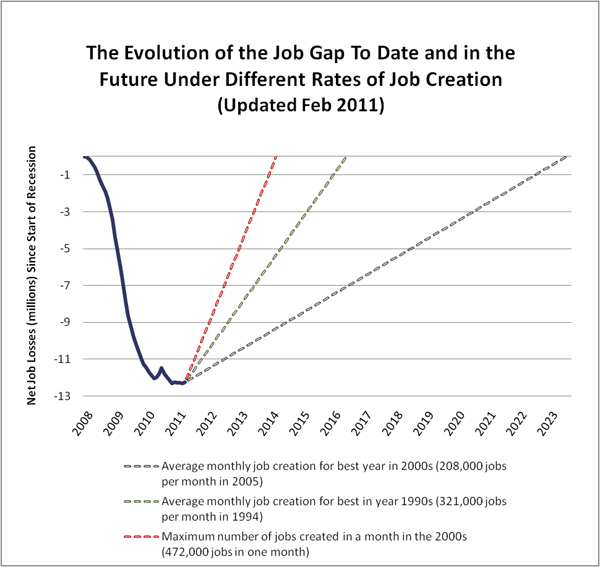
In addition to the threat to workers of declining wages, the United States is still facing a severe job gap of more than 12 million jobs. The chart below shows how the job gap has evolved since the start of the Great Recession in December 2007, and how long it will take to close under different assumptions for job growth. The solid line, in particular, shows the net number of jobs lost since the Great Recession began. The broken lines track how long it will take to close the jobs gap under alternative assumptions about the rate of job creation going forward.
If the economy adds about 208,000 jobs per month, which was the average monthly rate for the best year of job creation in the 2000s, then it will take until June 2023—another 12 years—to close the job gap. Given a more optimistic rate of 321,000 jobs per month, which was the average monthly rate for the best year of job creation in the 1990s, the economy will reach pre-recession employment levels by May 2016—not for another five years.
Challenges Ahead
The nation’s challenging employment situation continues to dominate the everyday lives of most American families. In the three decades following World War II, real earnings for workers grew by roughly 2 percent a year, nearly doubling incomes for each successive generation. But the promise of a better future for today’s workers is at risk, particularly for low-skilled men who have fallen steadily behind the rest of America’s workforce.
The consequences of a weak job market are very real—for the workers themselves, their families, and society as a whole. To address the nation’s most pressing policy challenge, The Hamilton Project is seeking new ideas for creating jobs and enhancing productivity and will award $25,000 in prizes to the winners of its 2011 policy innovation competition. The problems facing America’s workforce are challenging and real and will not resolve themselves. Our goal is to highlight targeted, evidence-based policies that can help close both the job gap and the decline in earnings that stand in the way of a brighter future for American workers.
[1] The median worker is the middle of the road—by definition, half of workers earn more than the median worker and half earn less.
The Brookings Institution is committed to quality, independence, and impact.
We are supported by a diverse array of funders. In line with our values and policies, each Brookings publication represents the sole views of its author(s).


Commentary
Have Earnings Actually Declined?
March 4, 2011