This analysis is part of the USC-Brookings Schaeffer Initiative for Health Policy, which is a partnership between Economic Studies at Brookings and the University of Southern California Schaeffer Center for Health Policy & Economics. The Initiative aims to inform the national health care debate with rigorous, evidence-based analysis leading to practical recommendations using the collaborative strengths of USC and Brookings. USC-Brookings Schaeffer Initiative research on surprise medical billing was supported by Arnold Ventures.
When receiving medical treatment, most patients are responsible for a flat dollar copayment, coinsurance tied to a percentage of the negotiated price between their insurance company and the provider, or the full negotiated price if their deductible has not yet been satisfied. However, the uninsured and patients who are treated by an out-of-network provider may be liable for the provider’s billed charge (or a portion thereof), which is a list price set unilaterally by the provider. In some cases, such a provider is actively chosen by the patient. But in others, such as for emergency and facility-based services that have been the subject of surprise billing debates, patients do not have a meaningful choice over their provider.
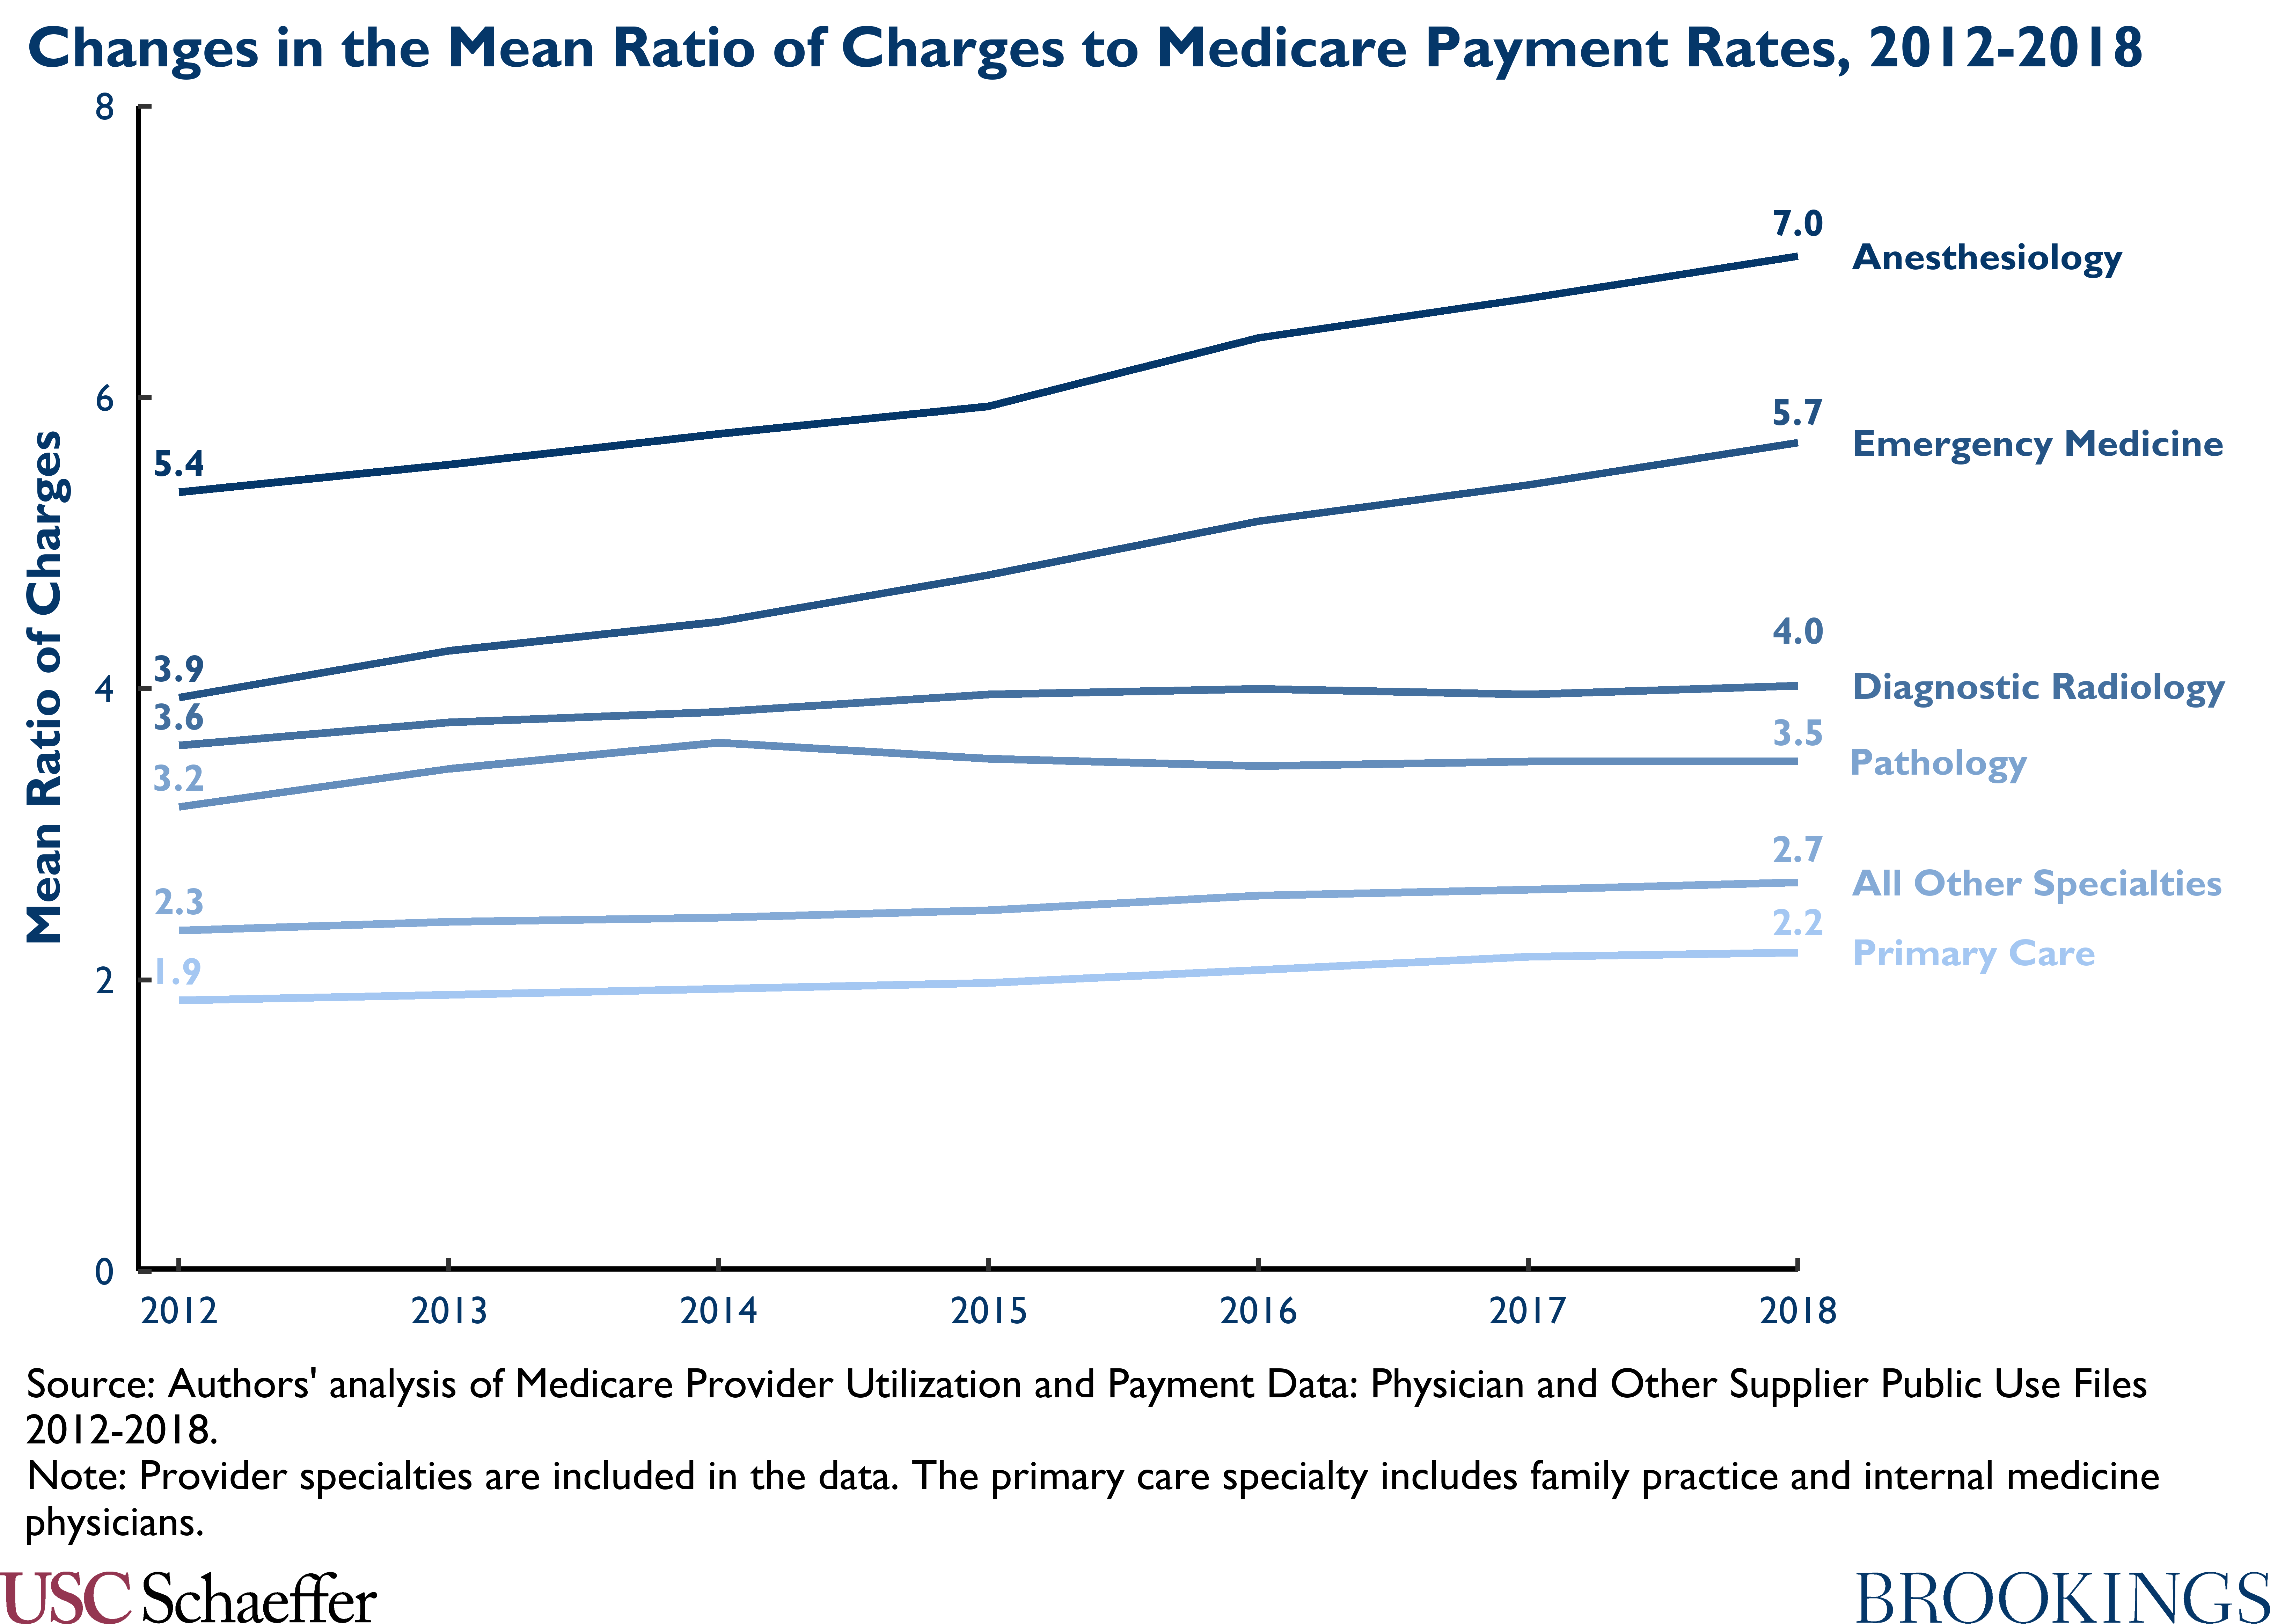
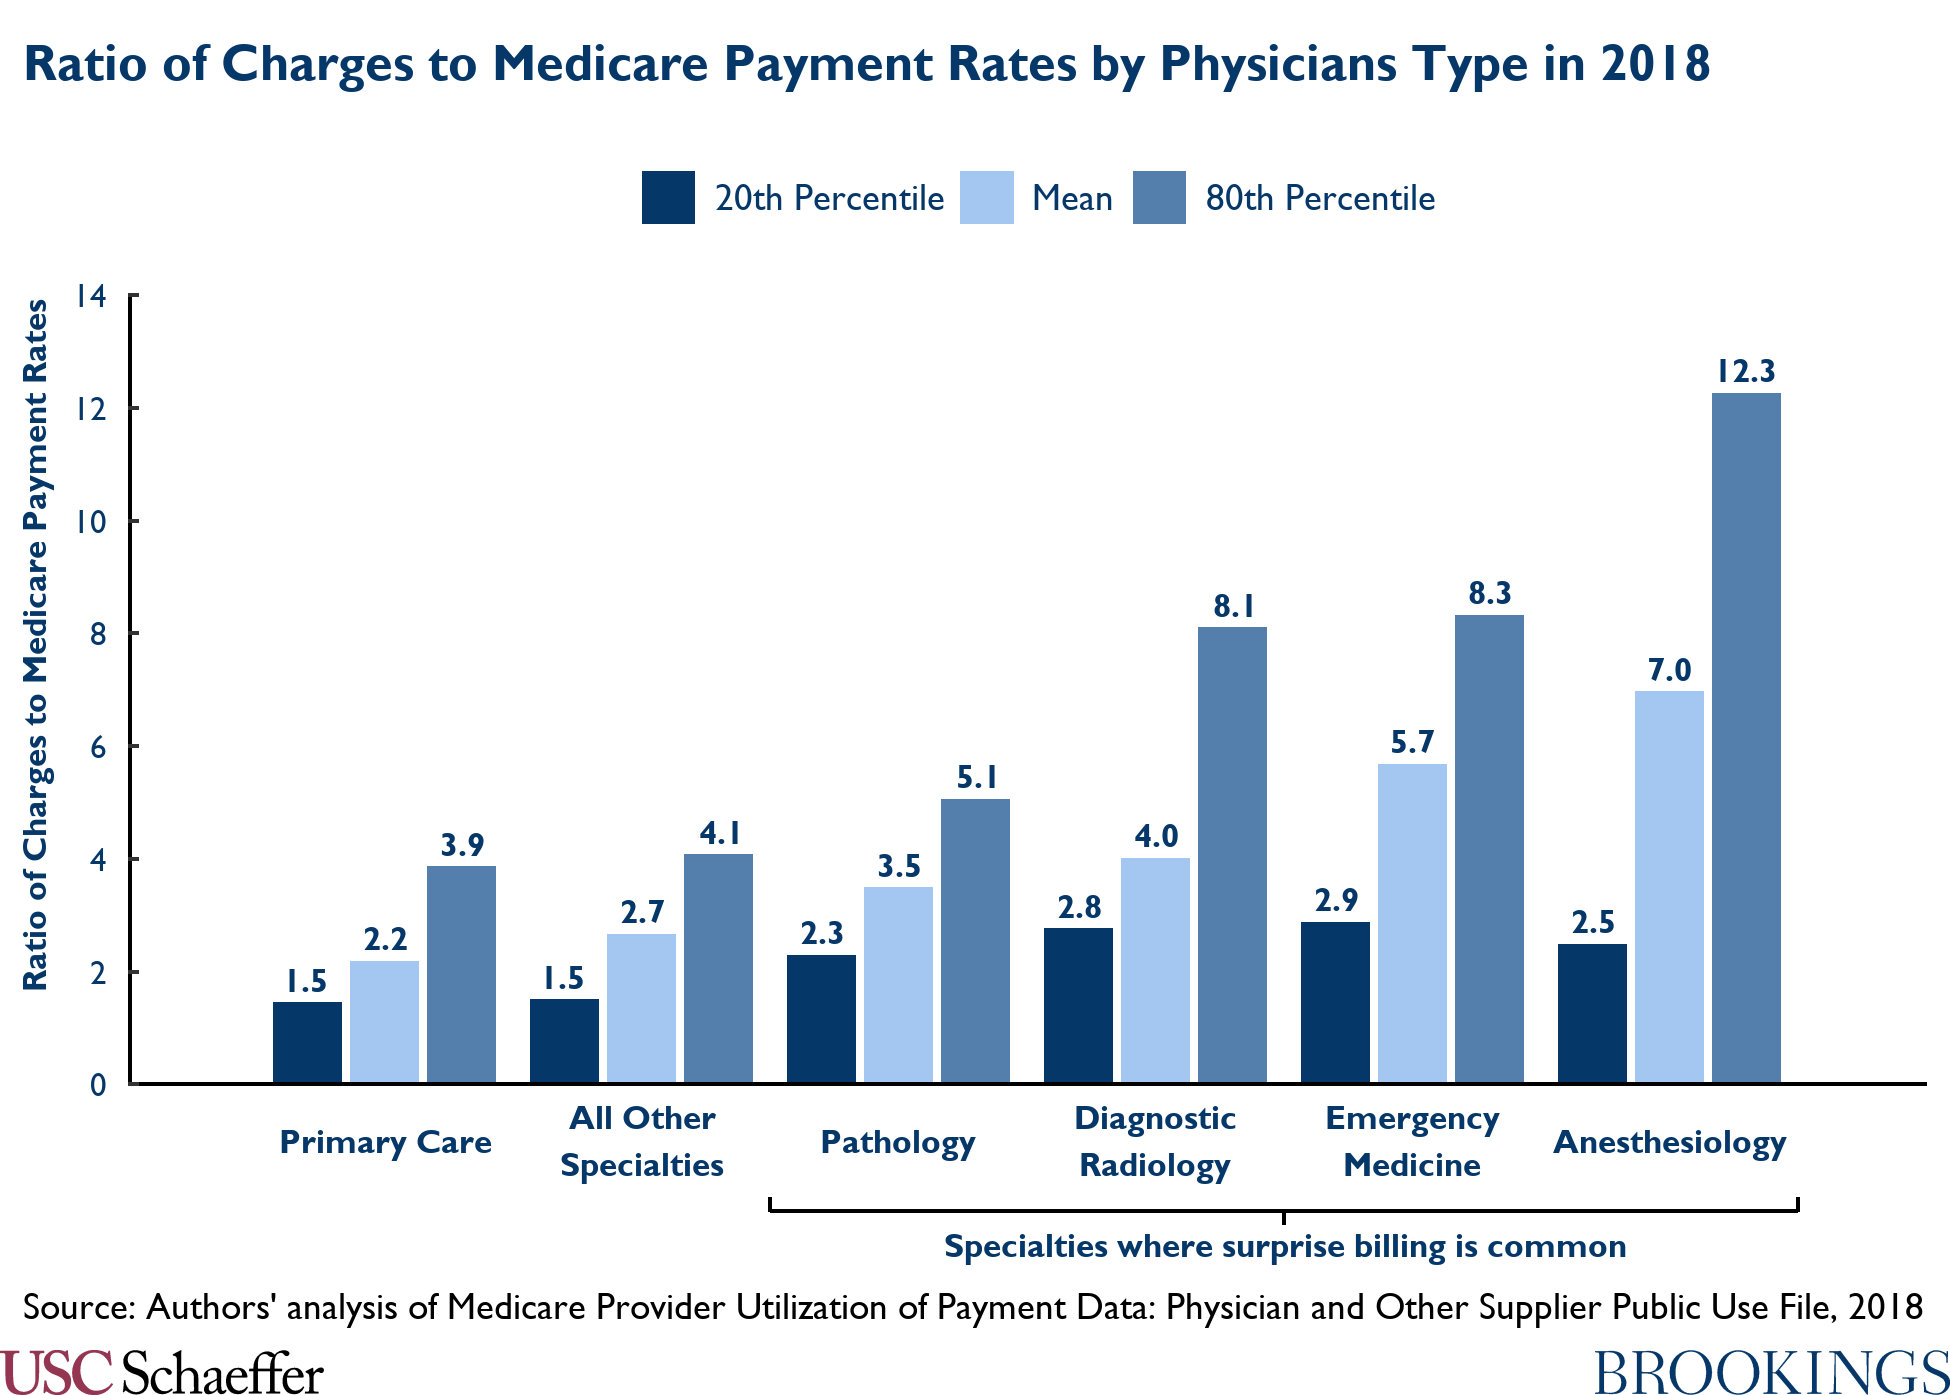
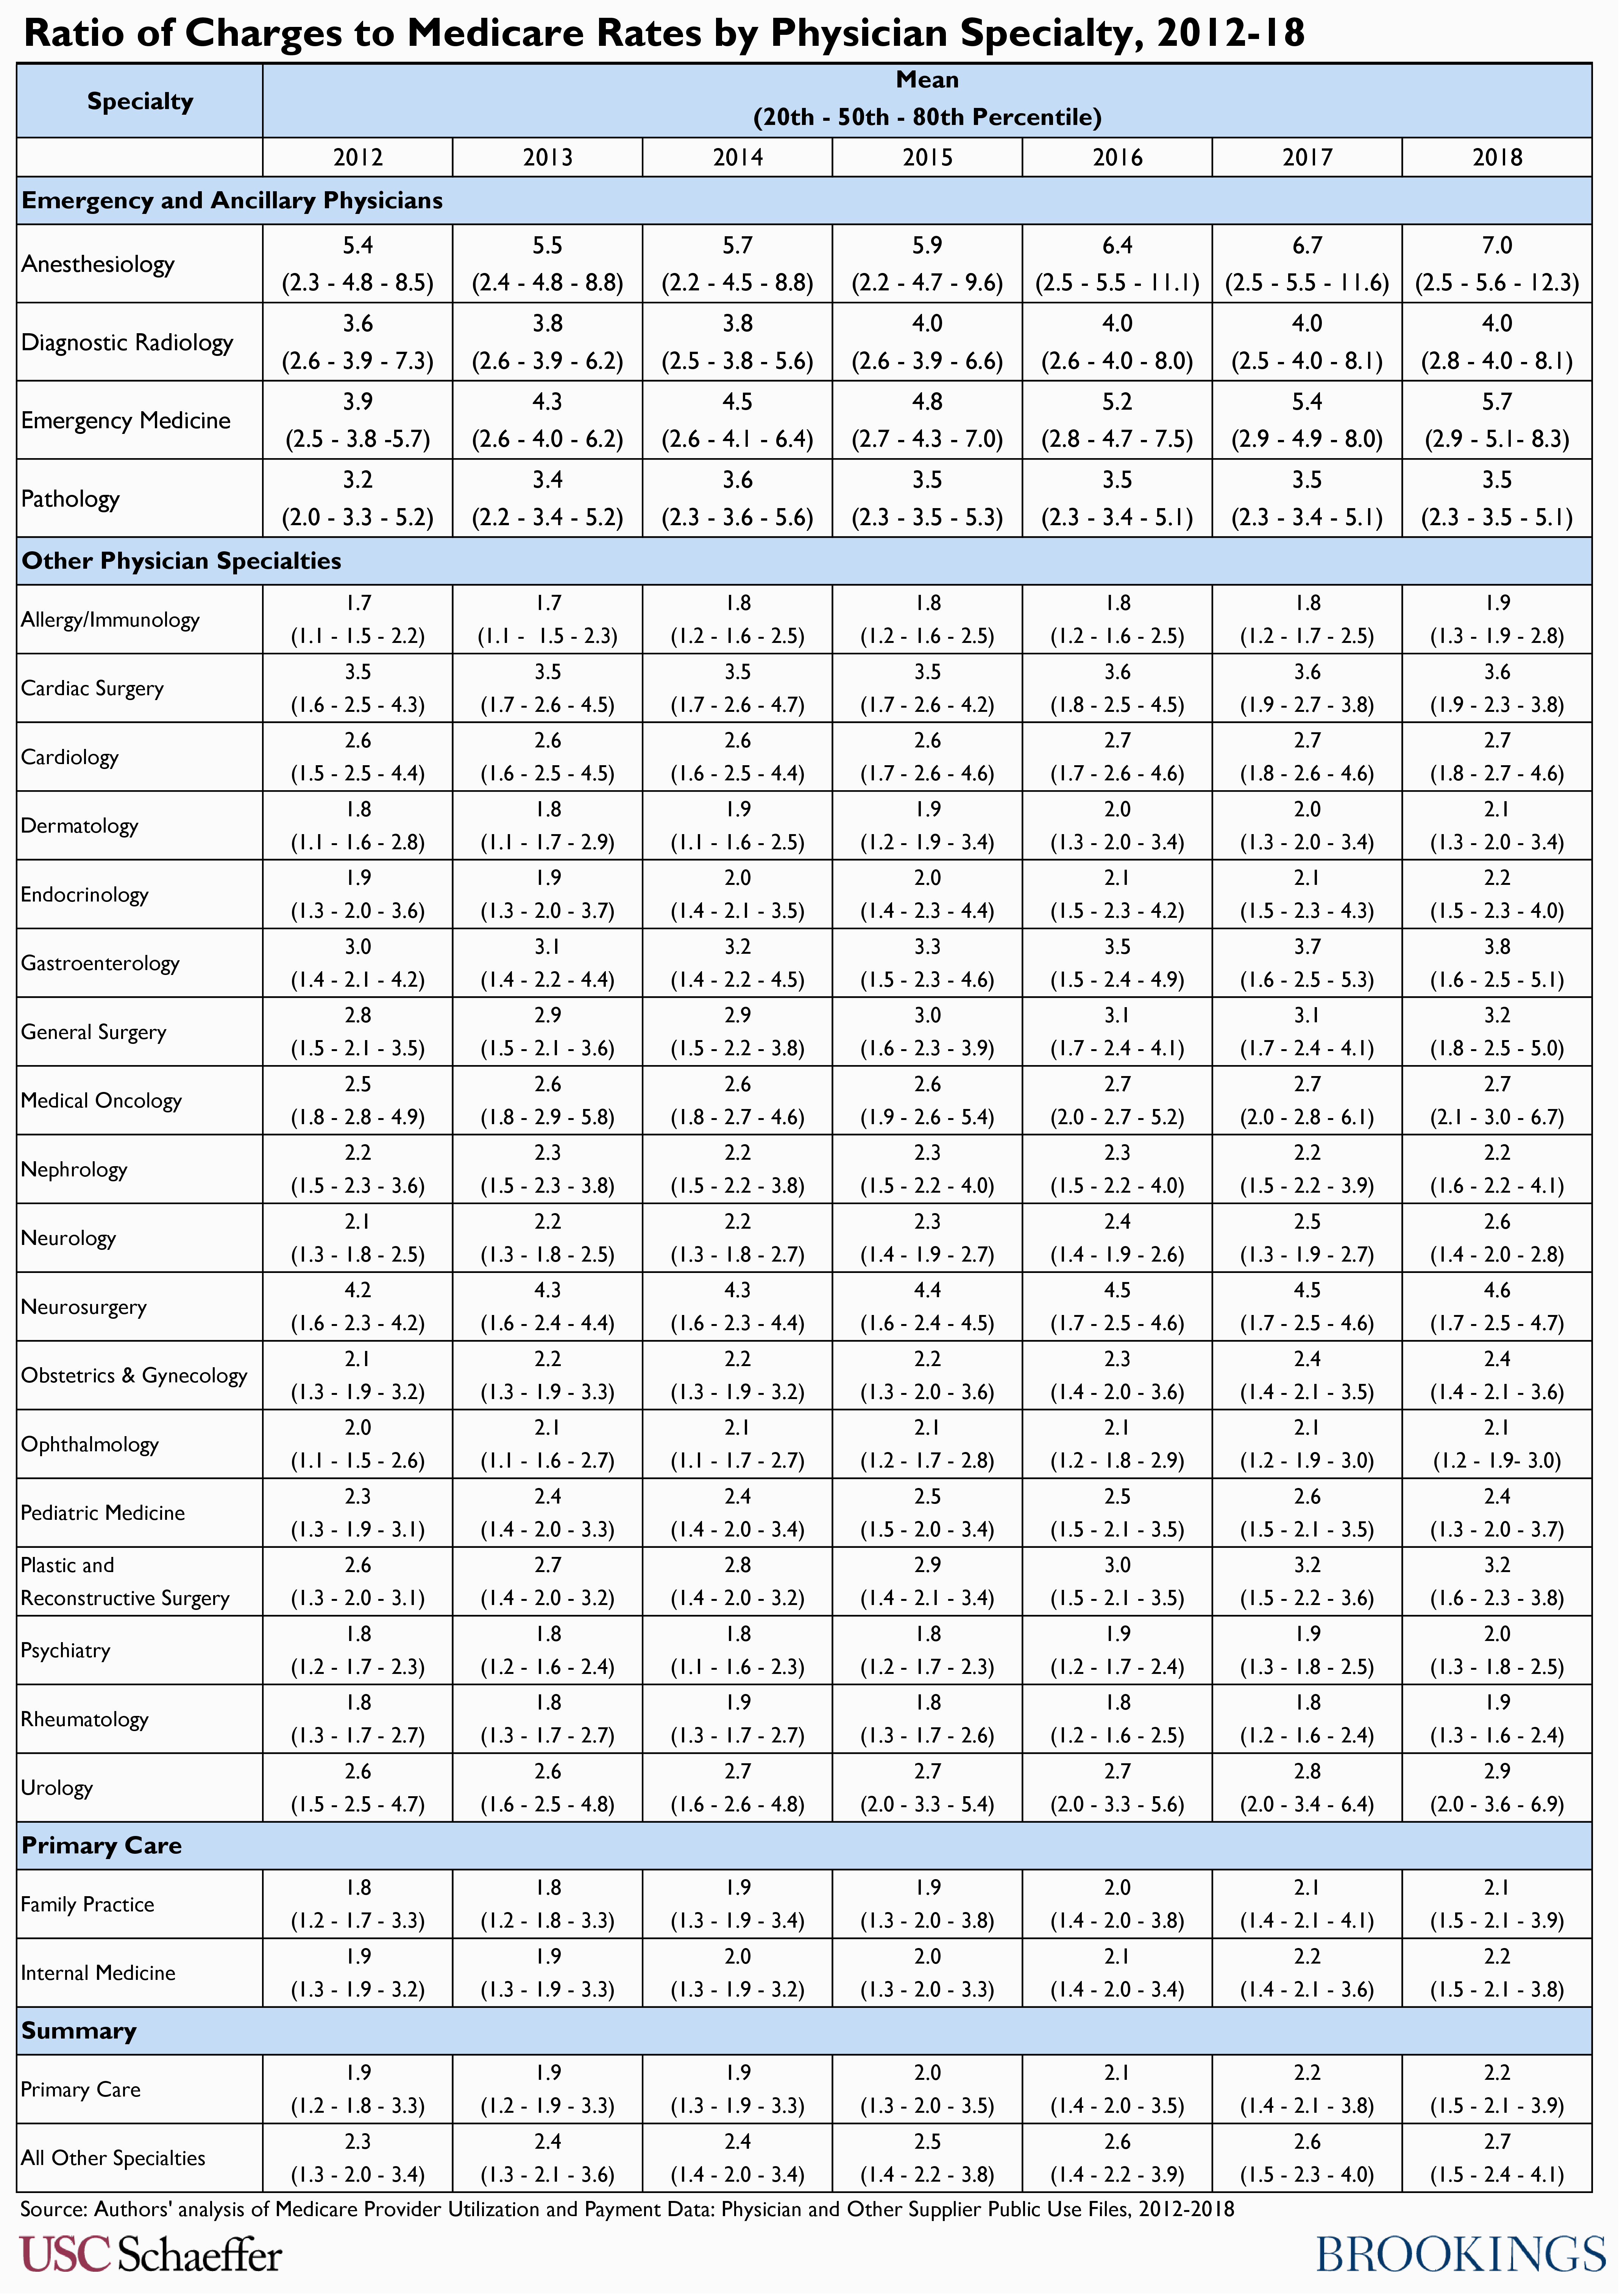
This analysis extends our previous work characterizing billed charges relative to Medicare prices across different physician specialties and incorporates recently-released 2018 data. We utilize data published by the Centers for Medicare & Medicaid Services (CMS) that reflect physician billed charges reported to Medicare (which appear to also largely reflect amounts billed to commercially-insured patients), now encompassing the years 2012-2018. We calculate mean charges relative to Medicare prices as well as the 20th, 50th, and 80th percentiles of this ratio for each physician specialty using the same methodology as our previous analysis. See the methodological appendix in Adler, Lee, Hannick, and Duffy (2019) for full details.
Consistent with previous work analyzing physician charges, we find notably higher ratios of charges to Medicare payment rates in specialties where surprise billing is most common (primarily emergency medicine and anesthesiology), relative to other specialties, and that this pattern continued in 2018. Not only are the average ratios in these specialties higher, but those specialties exhibit especially high charges at the 80th percentile.
The higher charges seen in these specialties likely reflect, at least to some degree, the fact that patients are typically unable to select their emergency physician or anesthesiologist, making it possible to surprise bill out-of-network patients as an alternative to contracting with insurance carriers, in which case physician collections are generally tied to the amounts charged.
Beginning January 1, 2022, however, the recently-enacted No Surprises Act will protect patients nationwide from surprise bills from out-of-network providers. Therefore, in addition to providing historical context, this analysis helps to illustrate the magnitude of protection being newly provided to patients.
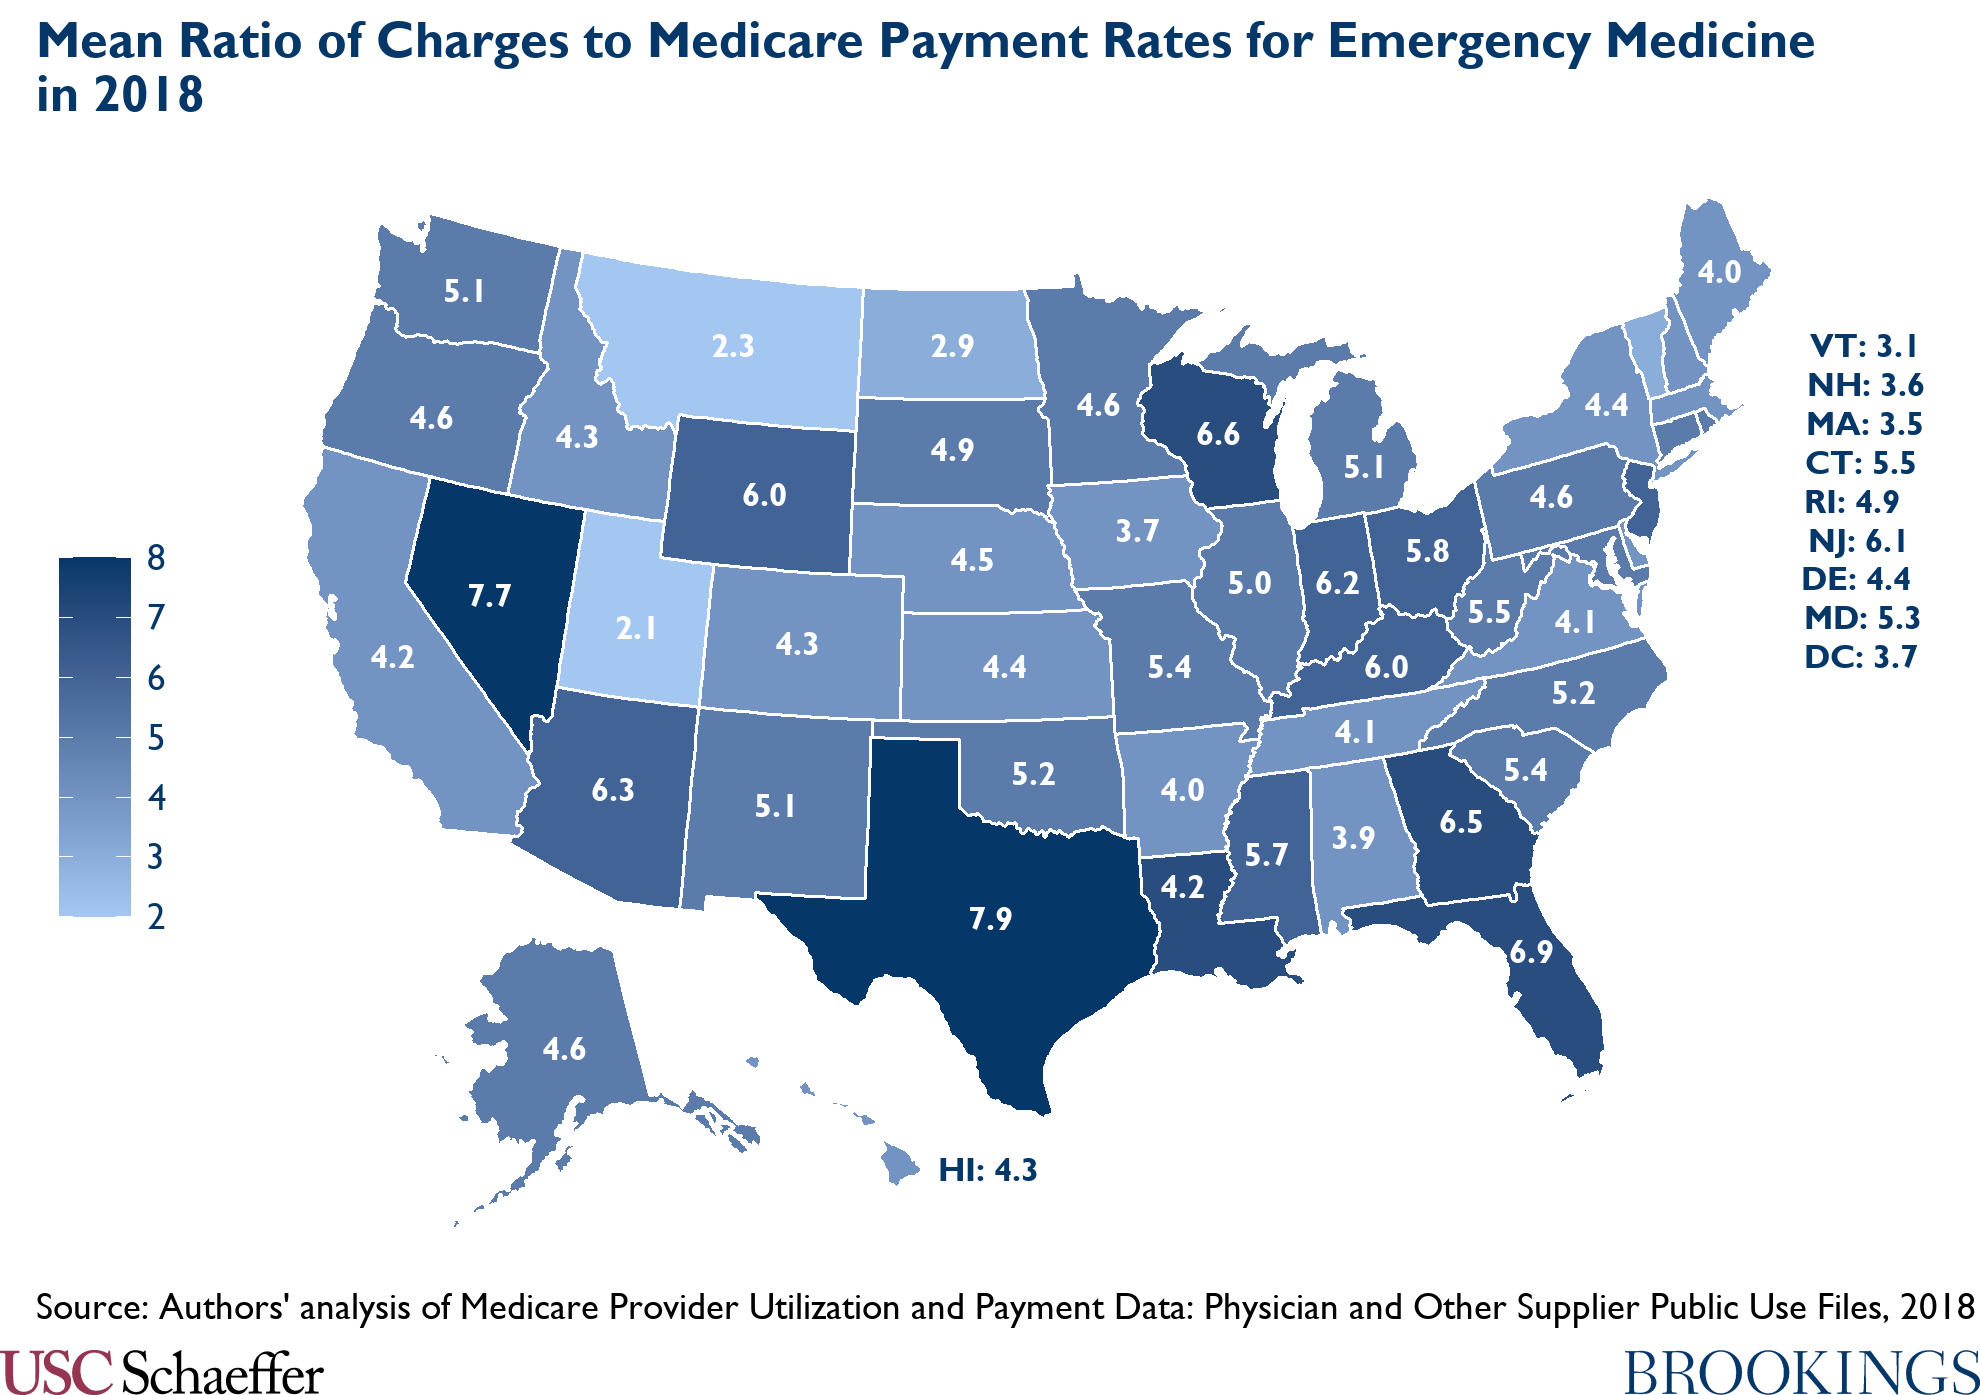
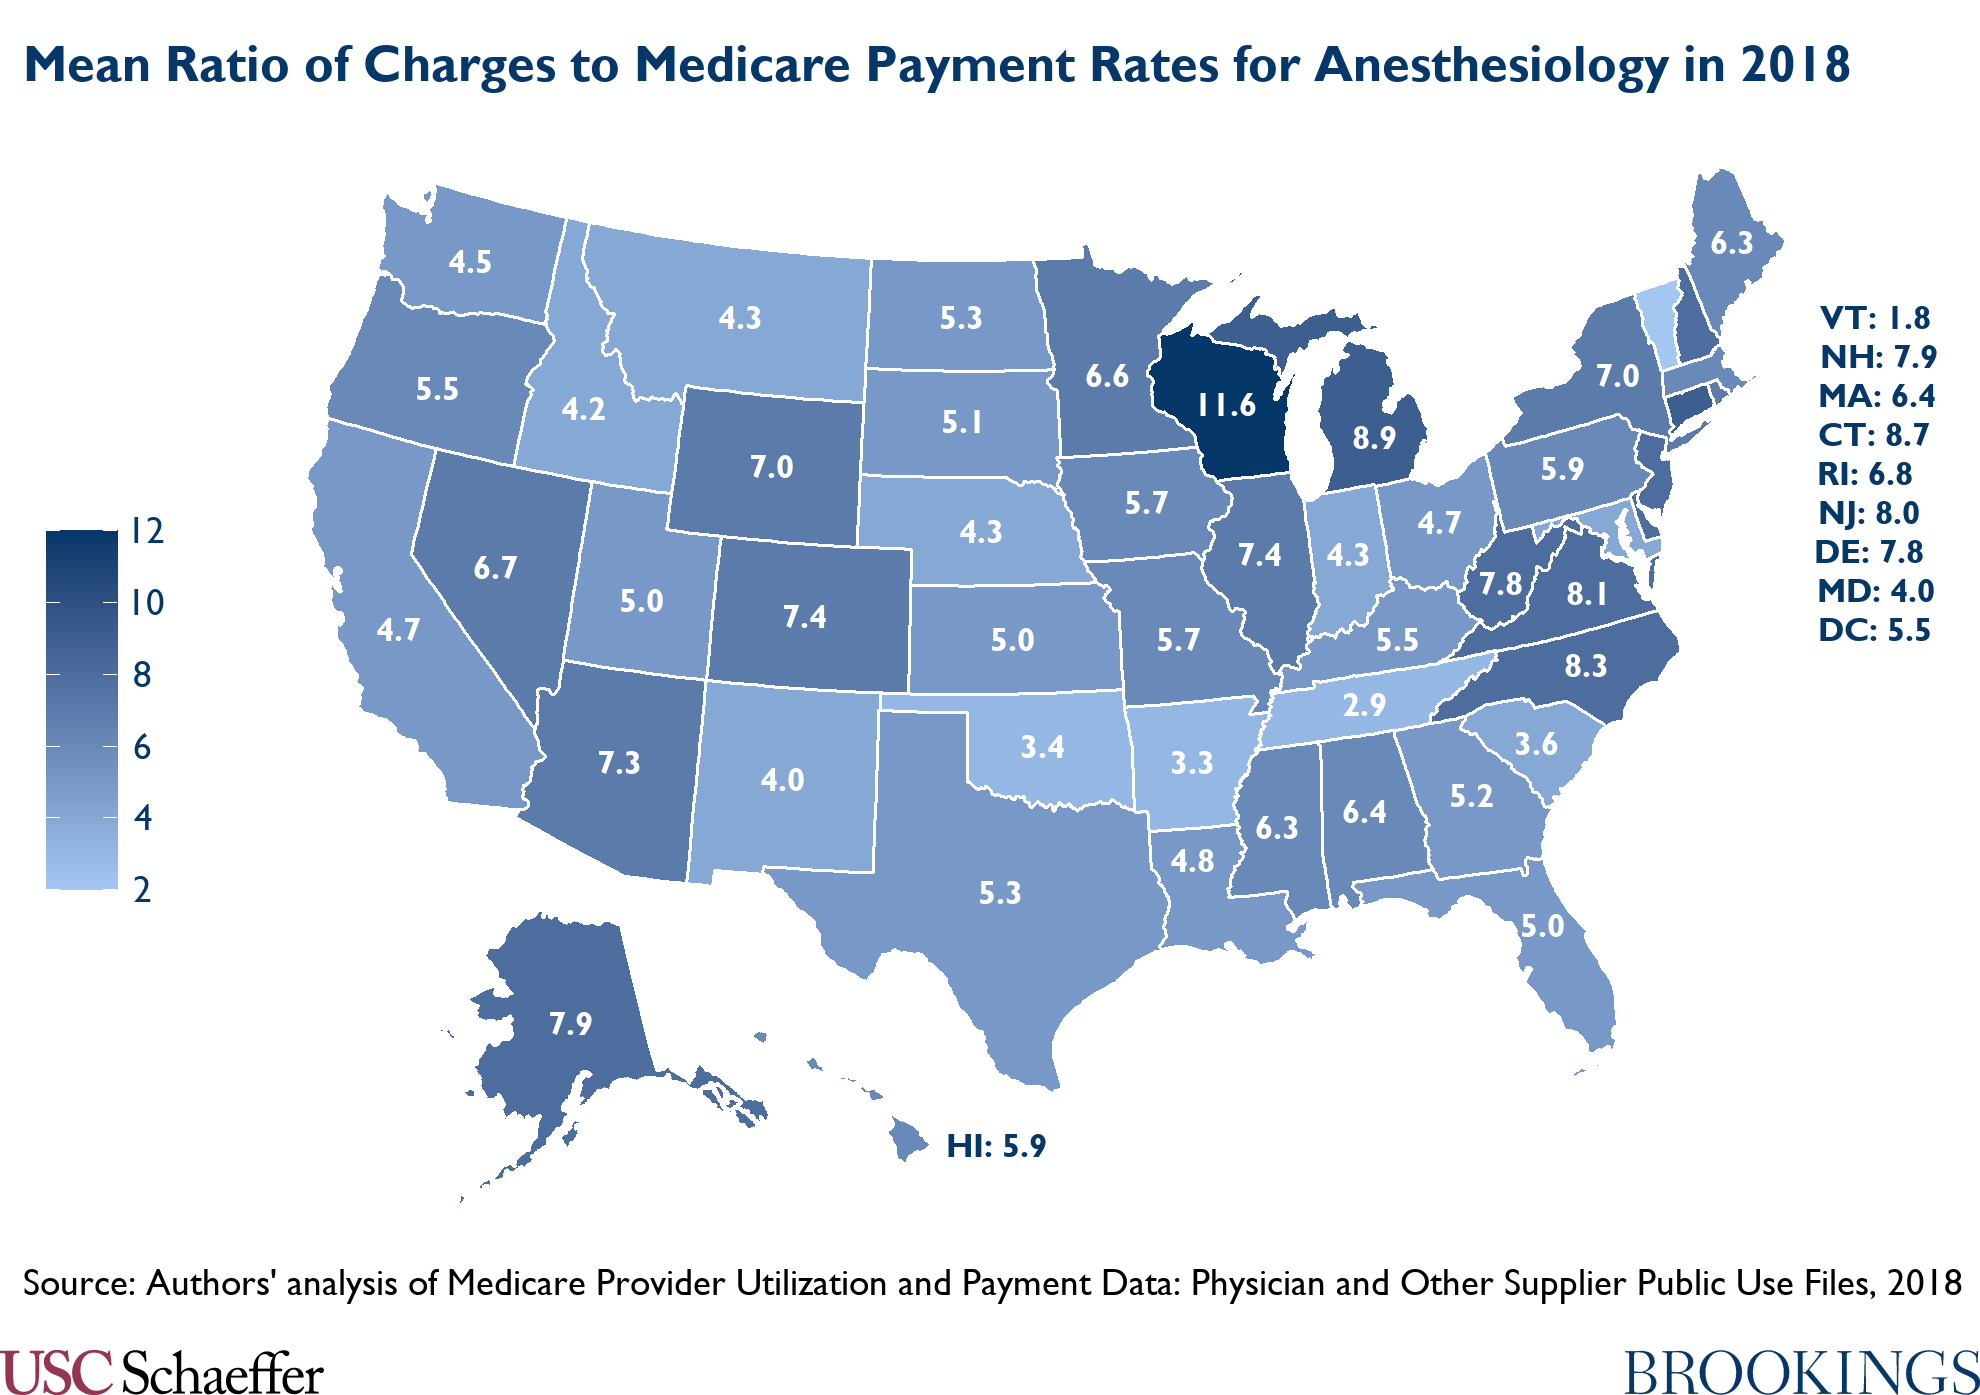
The remaining figures and table break out this physician charge data for a broad range of specialties and, for emergency medicine and anesthesiology, across states.
Related Content

Authors


The Brookings Institution is committed to quality, independence, and impact.
We are supported by a diverse array of funders. In line with our values and policies, each Brookings publication represents the sole views of its author(s).
Commentary
Provider charges relative to Medicare rates, 2012-2018
May 3, 2021