This analysis is part of the USC-Brookings Schaeffer Initiative for Health Policy, which is a partnership between the Center for Health Policy at Brookings and the University of Southern California Schaeffer Center for Health Policy & Economics. The Initiative aims to inform the national health care debate with rigorous, evidence-based analysis leading to practical recommendations using the collaborative strengths of USC and Brookings.
The tax legislation enacted in December 2017 repealed the tax penalty associated with the individual mandate—the Affordable Care Act (ACA) requirement that people who do not qualify for an exemption obtain health insurance coverage—effectively repealing the mandate itself. Understanding how the mandate has affected insurance coverage is important for predicting how insurance coverage and insurance markets, particularly the individual health insurance market, are likely to evolve in the coming years.
But how the mandate has affected insurance coverage remains controversial. Most formal analyses, including those produced by the Congressional Budget Office (CBO), conclude that the individual mandate substantially increased insurance coverage and, correspondingly, that repealing the mandate will substantially reduce coverage. But some, including the Trump Administration and Congressional Republicans, have argued that the mandate has had little or no effect on insurance coverage. In a new paper, I present evidence that the ACA’s individual mandate did indeed cause substantial increases in insurance coverage. This blog post briefly summarizes my findings.
Isolating the mandate’s effect on insurance coverage is challenging because the mandate was implemented at the same time as the ACA’s other major coverage provisions. For this reason, even though it is clear that the ACA as a whole substantially increased insurance coverage, the size of the mandate’s contribution to that increase is uncertain. The paper aims to overcome this challenge by focusing on recent trends in insurance coverage among people with family incomes above 400 percent of the federal poverty level (FPL). People in this income range are not eligible for the ACA’s subsidies, which makes it easier to isolate any effects of the individual mandate on insurance coverage.
The paper first presents evidence that the ACA caused a large reduction in the uninsured rate among people with family incomes above 400 percent of the FPL, with the following findings:
- The uninsured rate among people with family incomes above 400 percent of the FPL fell sharply following implementation of the ACA’s main coverage provisions: In each of three data sources examined, the measured uninsured rate among people with family income above 400 percent of the FPL fell sharply starting in 2014, the first year the ACA’s main coverage provisions were in effect, as illustrated in Figure 2 of the paper. This decline was quantitatively large, ranging from around 20 percent to close to 40 percent depending on the data source and age group examined.

- The magnitude, timing, and abruptness of this decline are strong evidence that it was caused by the ACA: The uninsured rate in this income group had been relatively stable for an extended period prior to 2014, and the subsequent decline left the uninsured rate for this income group far below the series’ prior minimum, as depicted in Figure 3 of the paper. These facts are strong evidence that the change in the uninsured rate for this income group was caused entirely or almost entirely by the ACA rather than other economic and demographic changes. This conclusion is consistent with prior research for the population as a whole, which found that the ACA drove the decline in the overall uninsured rate since 2013.

The paper next examines whether the decline in the uninsured rate among people with family incomes above 400 percent of the FPL was caused by the individual mandate or by other provisions of the ACA. Perhaps the most obvious alternative explanation is that the broader suite of ACA reforms, notably the ACA’s provisions barring insurers from varying premiums or denying coverage based on health status, changed the price and availability of individual market coverage in ways that increased insurance coverage in this income group. But while these policies reduced the price and increased the availability of insurance coverage for people in this income group with greater health care needs, they generally raised individual market premiums for healthier people in this income group, so it is unclear whether these changes should have been expected to increase insurance coverage on net.
Indeed, the paper presents three pieces of direct evidence that changes in the price and availability of insurance coverage caused by ACA provisions (including both the introduction of guaranteed issue and modified community rating and other ACA provisions) cannot account for the observed trends in insurance coverage among people with family incomes above 400 percent of the FPL:
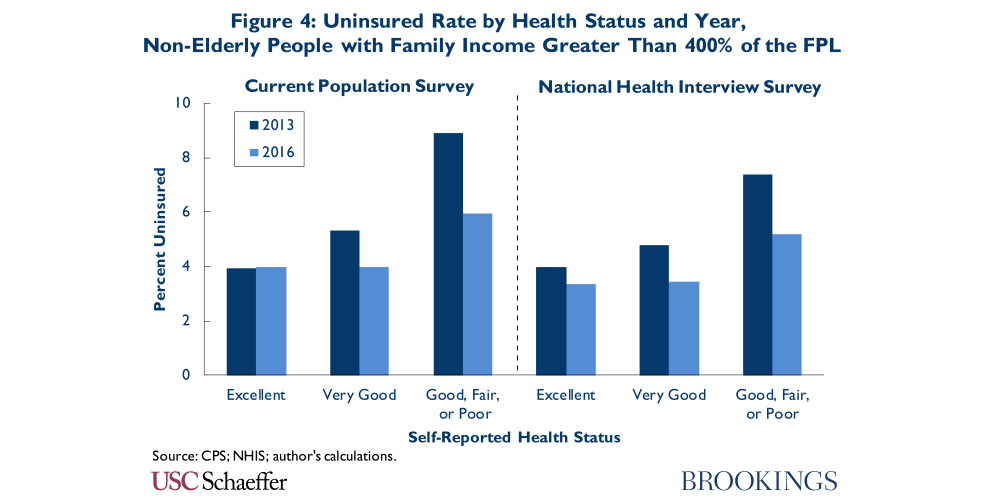
- The uninsured rate did not meaningfully increase among healthier people in this income range, despite the fact they typically faced higher premiums after 2013: The ACA’s provisions generally increased premiums for healthier people in this income range, so changes in the price and availability of insurance coverage should have put upward pressure on the uninsured rate for this group. In fact, as shown in Figure 4 of the paper, the uninsured rate appears to have either held steady or declined for healthier people in this income range, which implies that some other factor, like the individual mandate, must have been exerting downward pressure on their uninsured rate.
- Young adults in this income range saw large increases in insurance coverage, despite the fact they also typically faced higher premiums after 2013: The ACA’s provisions also generally increased the premiums paid by young adults in this income range, which should have put upward pressure on their uninsured rate. In fact, as shown in Figure 5 of the paper, the uninsured rate fell sharply among young adults in this income range, indicating that some other factor, like the individual mandate, must have been exerting downward pressure on their uninsured rate.

- The uninsured rate in this income range fell sharply in New York and Vermont, despite the fact that the price and availability of insurance coverage changed little in these states: New York and Vermont already barred insurers from varying premiums or denying coverage based on health status, so they saw no change in the availability of health insurance, and the overall effect of the ACA’s other reforms was to reduce real individual market premiums by only around 3 percent through 2016. Despite this fact, these states saw a decline in the uninsured rate among people with family incomes above 400 percent of the FPL similar in size to the one observed nationwide, as shown in Figure 6 of the paper, implying that factors other than changes in the price and availability of insurance coverage must account for this trend.’

The paper also considers several other potential explanations for coverage gains among people with family incomes above 400 percent of the FPL, including public attention to insurance coverage associated with the ACA’s rollout, implementation of the employer mandate, and reduction in the hassle costs of enrolling in insurance coverage. The paper presents evidence that these explanations are unlikely to account for much of the observed increase in insurance coverage in this group, although advertising and outreach associated with the ACA’s rollout may have played a contributing role. On the basis of this evidence, I conclude that the individual mandate accounts for the lion’s share of the decline in the uninsured rate among people with family incomes above 400 percent of the FPL since 2013.
The paper next considers what this evidence implies for the effect of the individual mandate on insurance coverage in the population as a whole. While the paper’s estimates only apply directly to a small slice of the uninsured population, if the mandate had an important effect on coverage decisions among people with family incomes above 400 percent of the FPL, it likely also affected coverage decisions at lower income levels, although the magnitude of that effect is uncertain.
To provide insight on the range of possibilities, I present estimates under varying assumptions about the mandate’s relative effectiveness below 400 percent of the FPL. For these calculations, I assume that the individual mandate accounted for four-fifths of the overall decline in the uninsured rate among people with family incomes above 400 percent of the FPL, with the remaining one-fifth accounted for by outreach and advertising associated with the ACA’s rollout and similar factors. If the probability that the mandate caused an uninsured person to obtain coverage was the same at all income levels (with narrow exceptions described in the paper), then the paper’s estimates imply that the mandate reduced the number of uninsured people by 8.0 million in 2016, as reported in Table 5 of the paper. Even if the individual mandate’s effect on people with family incomes below 400 percent of the FPL was half as large, then the mandate reduced the overall number of uninsured people by 4.6 million in 2016.

Looking to the future, these estimates suggest that the mandate’s removal will cause a meaningful increase in the number of uninsured, although the full increase may take time to materialize. For a variety of reasons, the future reduction in insurance coverage caused by repealing the mandate may not be exactly the same as the increase in insurance coverage caused by the mandate in 2016. For comparison, however, the paper’s base estimate that the mandate reduced the number of uninsured people by 8.0 million in 2016 is similar to CBO’s updated estimate of the long-run increase in the number of uninsured that will result from mandate repeal and somewhat smaller than the 13 million estimate CBO issued during the legislative debate.
The coming reduction in insurance coverage due to repeal of the individual mandate will likely prove hard to reverse. Commonly proposed replacements for the individual mandate, including automatic enrollment and proposals to penalize people who do not maintain continuous insurance coverage when they attempt to re-enroll in coverage, would face serious implementation challenges and are of questionable effectiveness. And while it is clearly possible to replicate the financial incentives created by the individual mandate by increasing subsidies to people who obtain health insurance, this approach would have a large fiscal cost. For this reason, if future state and federal policymakers wish to surpass the high-water mark for insurance coverage attained under the ACA, restoring an individual mandate or something like it should be part of the policy conversation.
Related Content

Author

The Brookings Institution is committed to quality, independence, and impact.
We are supported by a diverse array of funders. In line with our values and policies, each Brookings publication represents the sole views of its author(s).


Commentary
Coverage gains among higher-income people suggest the ACA’s individual mandate had big effects on coverage
May 31, 2018