A few days ago, the New York Times’ Anatoly Kurmanaev described the humanitarian catastrophe Venezuelans have experienced the past few years, noting that “Venezuela’s fall is the single largest economic collapse outside of war in at least 45 years, economists say.”
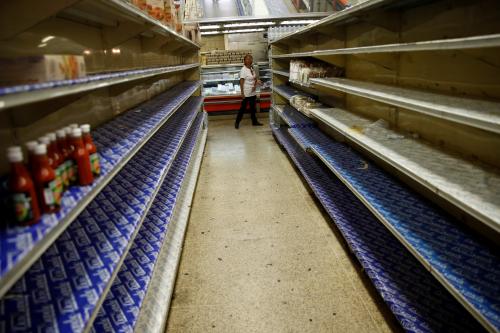
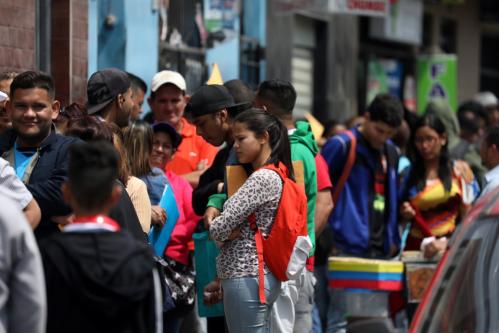
As I write these words, Venezuelans continue in their struggle to regain their democracy. While this happens, undernourishment is the rule rather than the exception—both for adults and children—and treatable diseases have become a death sentence for Venezuelans unable to find medicines or get proper treatment through the national health system. Through almost any socio-economic indicator, Venezuela is doing worse than countries that have gone through lengthy and bloody wars. It is no wonder that more than 3.4 million refugees have fled the country, most of them since 2014. Earlier this year, Douglas Barrios and I suggested this number could reach over 8 million if the economic situation continues to worsen.
The dimensions of this ongoing tragedy morally mandate us to find solutions, instead of analyzing whether we can blame someone other than those who have been in power for over 20 years. Yet, it has become popular among some circles to play the “blame game,” sometimes even ignoring the woes of Chavismo—the government of former President Hugo Chávez—which is—without a doubt—the main, if not the only, elephant in the room.
An example of this is the recent CEPR report assessing the impact of the 2017 U.S. sanctions on Venezuela. The report claims that these sanctions, which eliminated the possibility that Venezuela will issue new sovereign debt, have caused the death of over 40,000 Venezuelans. The sanctions, they claim, sharply reduced the ability of PDVSA—Venezuela’s state-owned oil company—to produce oil, which is the country’s main and almost only source of income.
The main analytical source behind the paper’s claim is a comparison of oil production between Venezuela and Colombia before and after the 2017 sanctions. According to their analysis, because Colombia’s oil production behaved quite similar to Venezuela’s between 2013 and 2017, any change thereafter, namely the drop in Venezuela’s oil production, can be attributed to the sanctions enacted in August 2017.
In a new report, my co-authors Sebastian Bustos, Jose Ramón Morales, and Miguel Santos and I revisit this evidence. We look in detail at their data and methods and conclude that it is impossible to conclude anything about the impact of those sanctions on the performance of Venezuela’s oil industry, and more importantly, on many of the socio-economic indicators that determine the humanitarian catastrophe the country is going through.
This is for one simple reason: We cannot conclude anything causal after comparing Colombia and Venezuela’s oil production. Why? Because they both respond to very different fundamentals, and therefore, even respond differently to common shocks (such as price fluctuations). In fact, we show that when looking at both trends before 2013, they look quite different. In economic jargon, we say that Colombia’s oil production is no counterfactual to Venezuela’s. This is even without considering that there are confounding factors, happening also in 2017, that could also explain the continuing drop in oil production, such as the appointment of a high-ranking military officer to manage PDVSA, a person with no relevant credentials for the job.
Figure 1: Oil production in Venezuela and Colombia (2010-2018)
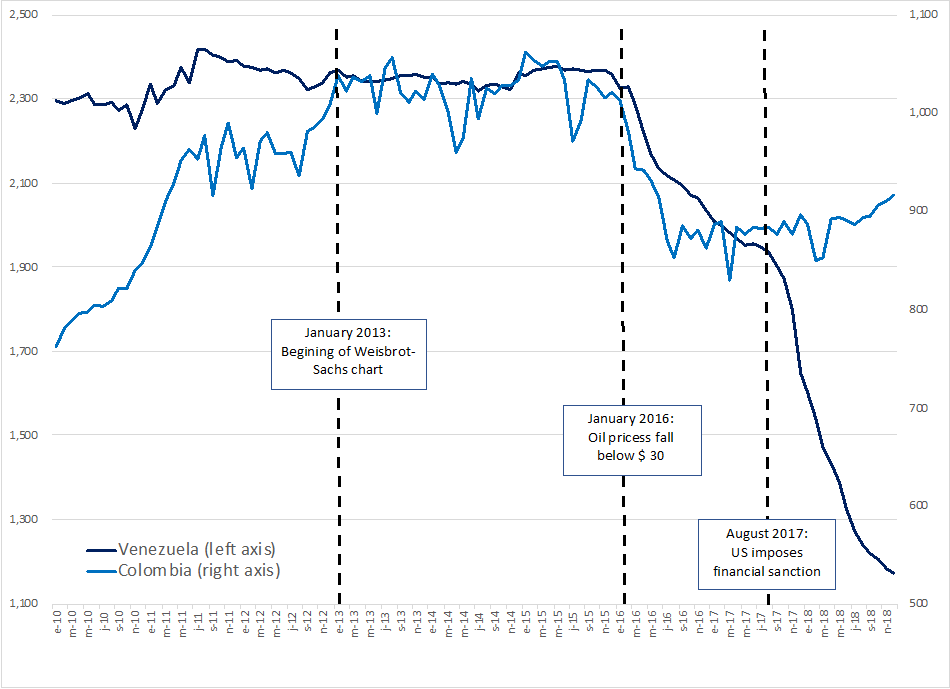
Source: International Energy Agency, OPEC.
We could try to find a “counterfactual,” but it will be difficult, if not impossible, to find one that is convincing enough. Reducing the analysis to simply choosing a comparison country (like Colombia, for instance) or group of countries, can lead to many different results. For instance, when comparing Venezuela’s oil production across time to the average of OPEC countries, we see that the drop in Venezuela’s oil production started way before the sanctions were enacted. Venezuela’s drop in oil production compared to OPEC countries preceded the sanctions, big time.
But here is our most important point. The worsening trends in all of the socio-economic determinants of the humanitarian catastrophe so clearly start before 2017 that it is impossible to estimate what is or isn’t explained by sanctions. Moreover, when looking at almost any socio-economic indicator that determines, at least part of, the humanitarian catastrophe, the bulk of the damage happened before sanctions were enacted (see figures 2-5 below). For instance, by 2016—the year before sanctions were imposed—food imports in the country had fallen by 71 percent from their 2013 peak. Imports of medicines and medical equipment fell by 68 percent between 2013 and 2016. In terms of calorie intake, we find that by August 2017 Venezuelans earning the minimum wage could only afford a maximum of 6,132 of the cheapest available calories per day—equivalent to 56 percent of the minimum dietary needs of a family of five. This is 92 percent fewer calories than the minimum wage could purchase in January 2010. Infant mortality, a good proxy for the quality of public health services, grew by 44 percent between 2013 and 2016 and has continued to do so since.
Thus, it is clear from our analysis that the further deterioration observed since 2017—whether caused by the sanctions, management incompetence, or whatever it was—by no means constitutes the bulk of the collapse that has caused widespread suffering, death, and displacement to millions of Venezuelans. The weight of evidence seems to indicate that much of the suffering and devastation in Venezuela has been, in line with most accounts, inflicted by those in power for more than 20 years already. Ignoring this and blaming the damage on agents other than Maduro and the Chavista governments after decades of failed policies is, to put it mildly, highly misleading.
Figure 2: Venezuela and peers: Imports of food
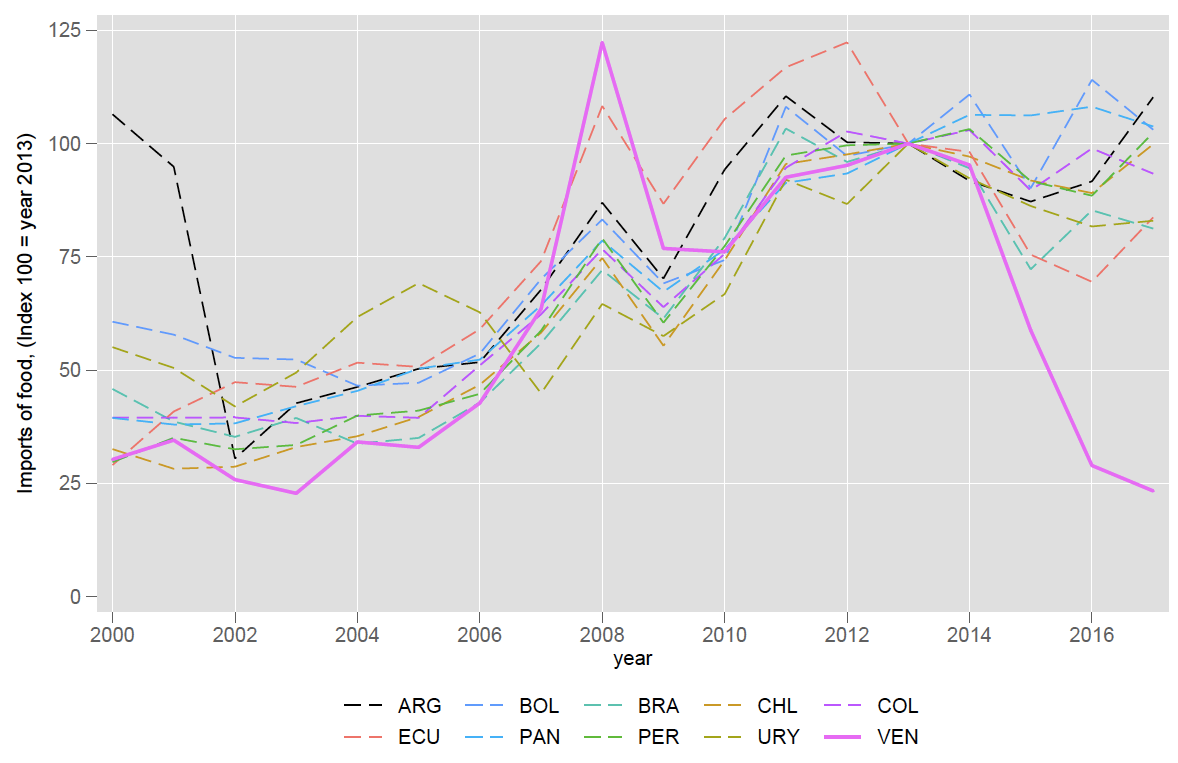
Source: UNCOMTRADE, with corrections from Bustos-Yildirim (2019).
Figure 3: Venezuela and peers: Imports of medicine and medical equipment
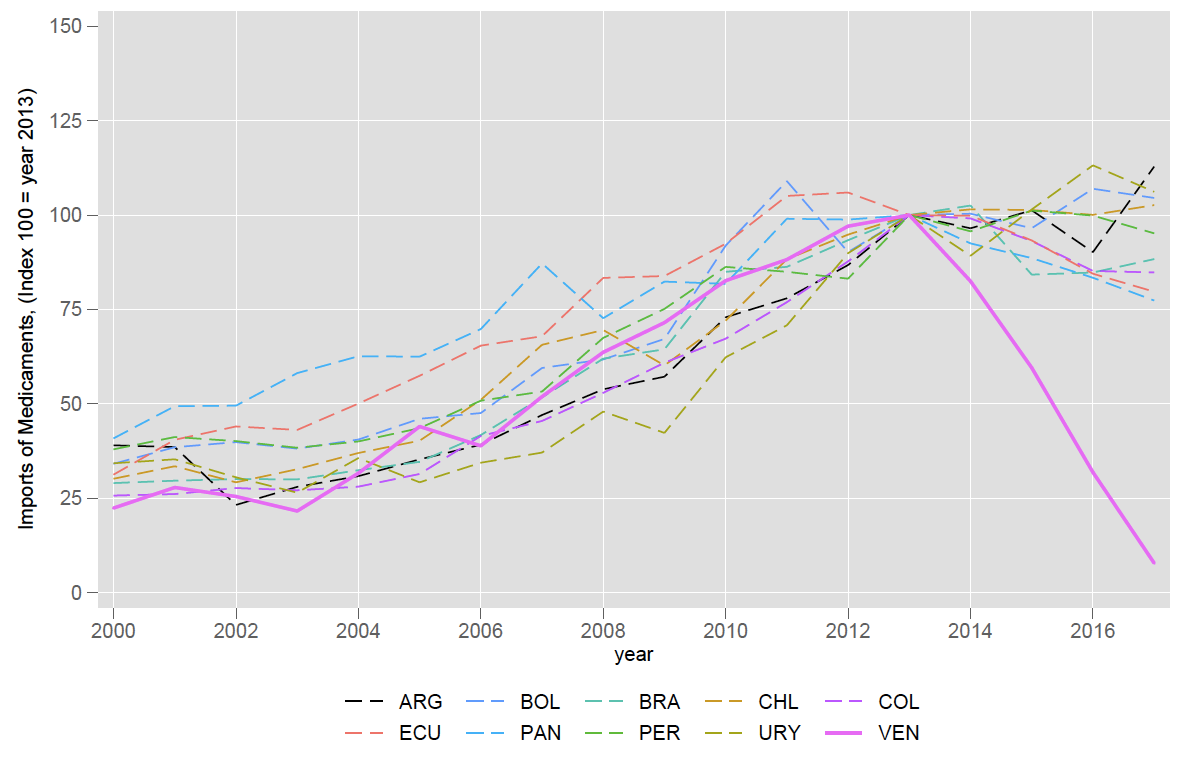
Source: UNCOMTRADE, with corrections from Bustos-Yildirim (2019).
Figure 4: Maximum number of daily calories that can be purchased with a minimum wage in Venezuela (January 2010—April 2019)
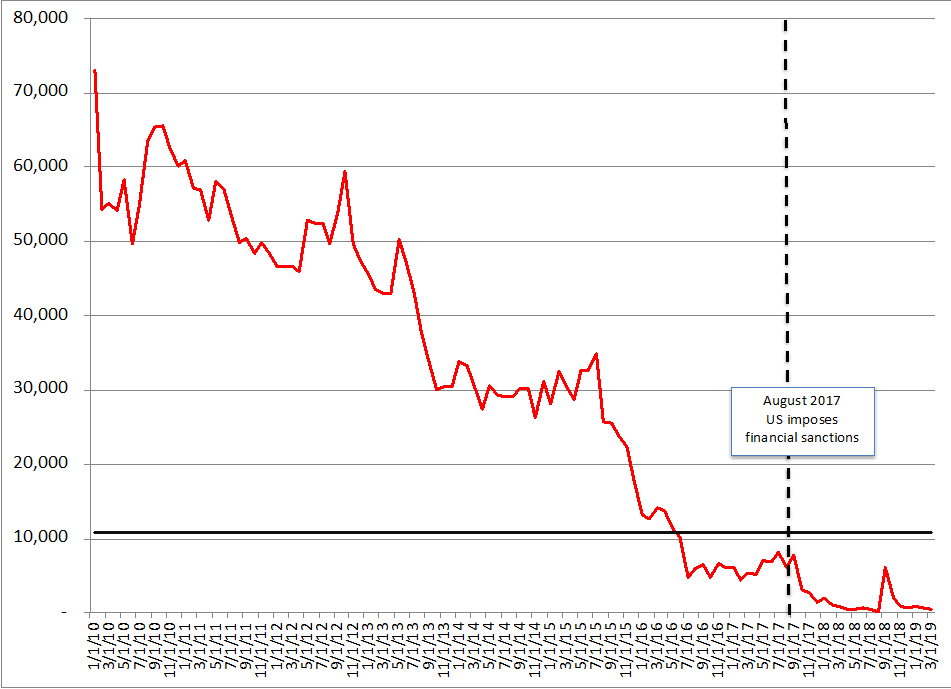
Source: CENDAS, Douglas Barrios’ calculations.
Figure 5: Infant mortality rate in Venezuela (deaths per 1000 live births)
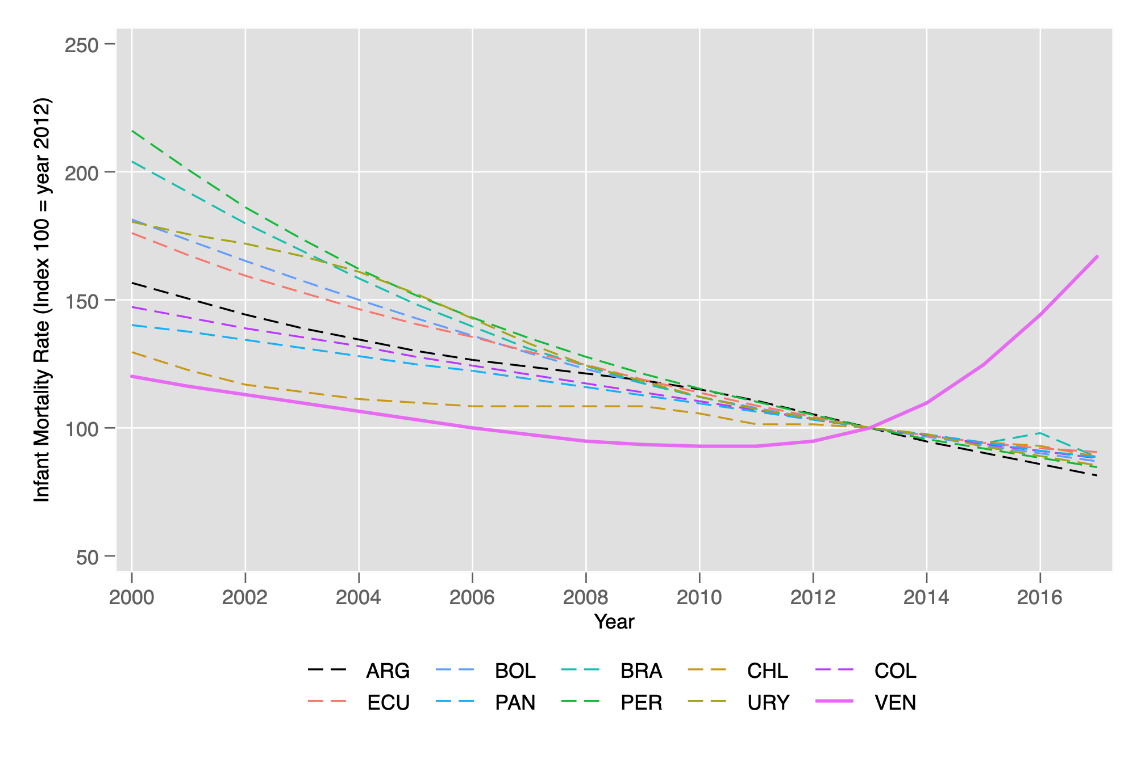
Source: World Bank’s World Development Indicators and own calculations.
Related Content
Author

The Brookings Institution is committed to quality, independence, and impact.
We are supported by a diverse array of funders. In line with our values and policies, each Brookings publication represents the sole views of its author(s).

Commentary
Chavismo is the worst of all sanctions: The evidence behind the humanitarian catastrophe in Venezuela
May 22, 2019