Creating healthier and more sustainable cities has become a global priority integral to achieving the United Nation’s Sustainable Development Goals and the World Health Organization’s health equity goals. With 56% of the global population now living in urban areas (with far higher rates in North America, South America, and Europe), city and national leaders will need to get serious about the kinds of physical designs that can improve public health, urban equity, and sustainability.
But what do healthy, sustainable cities look like? Common elements include safe and affordable housing, walkable streets, useful public transit, and access to daily living needs and green spaces. Using indicators of these kinds of urban characteristics can allow planners to target interventions, compare their performance to other cities (benchmarking), and measure progress toward goals over time (monitoring).
Unfortunately, spatial indicators are hard to create. First, indicators are needed at both the neighborhood and city scale to conduct within-city and between-city analyses. Second, the necessary data do not always exist, and the data that do exist may not be publicly available or consistent. Third, advanced spatial analysis requires technical expertise, expensive software, and lots of data—obstacles in every city, but particularly so in less-resourced places. The net result is a dearth of consistent, reproducible indicators for healthy, sustainable cities.
We need a new way forward. In a recent project, my colleagues and I set out to address this problem with new, reproducible tools to calculate urban indicators more consistently around the world. We convened an international network of collaborators for data sourcing and validation of our input and output data. This was important because we relied heavily on open data, including the Global Human Settlement Layer (for urban boundaries), OpenStreetMap (for street networks and amenities), and the General Transit Feed Specification (for public transit stops and timings). We developed free, open-source software to process the data and calculate indicators derived from the UN’s sustainable development goals. And anyone can repurpose this software anywhere in the world.
This work recently culminated in a series of articles on urban design, transport, and health published in The Lancet Global Health. The ability to benchmark and monitor cities across the planet revealed a hard truth: City leaders and their partners must do more to build healthy and sustainable places.
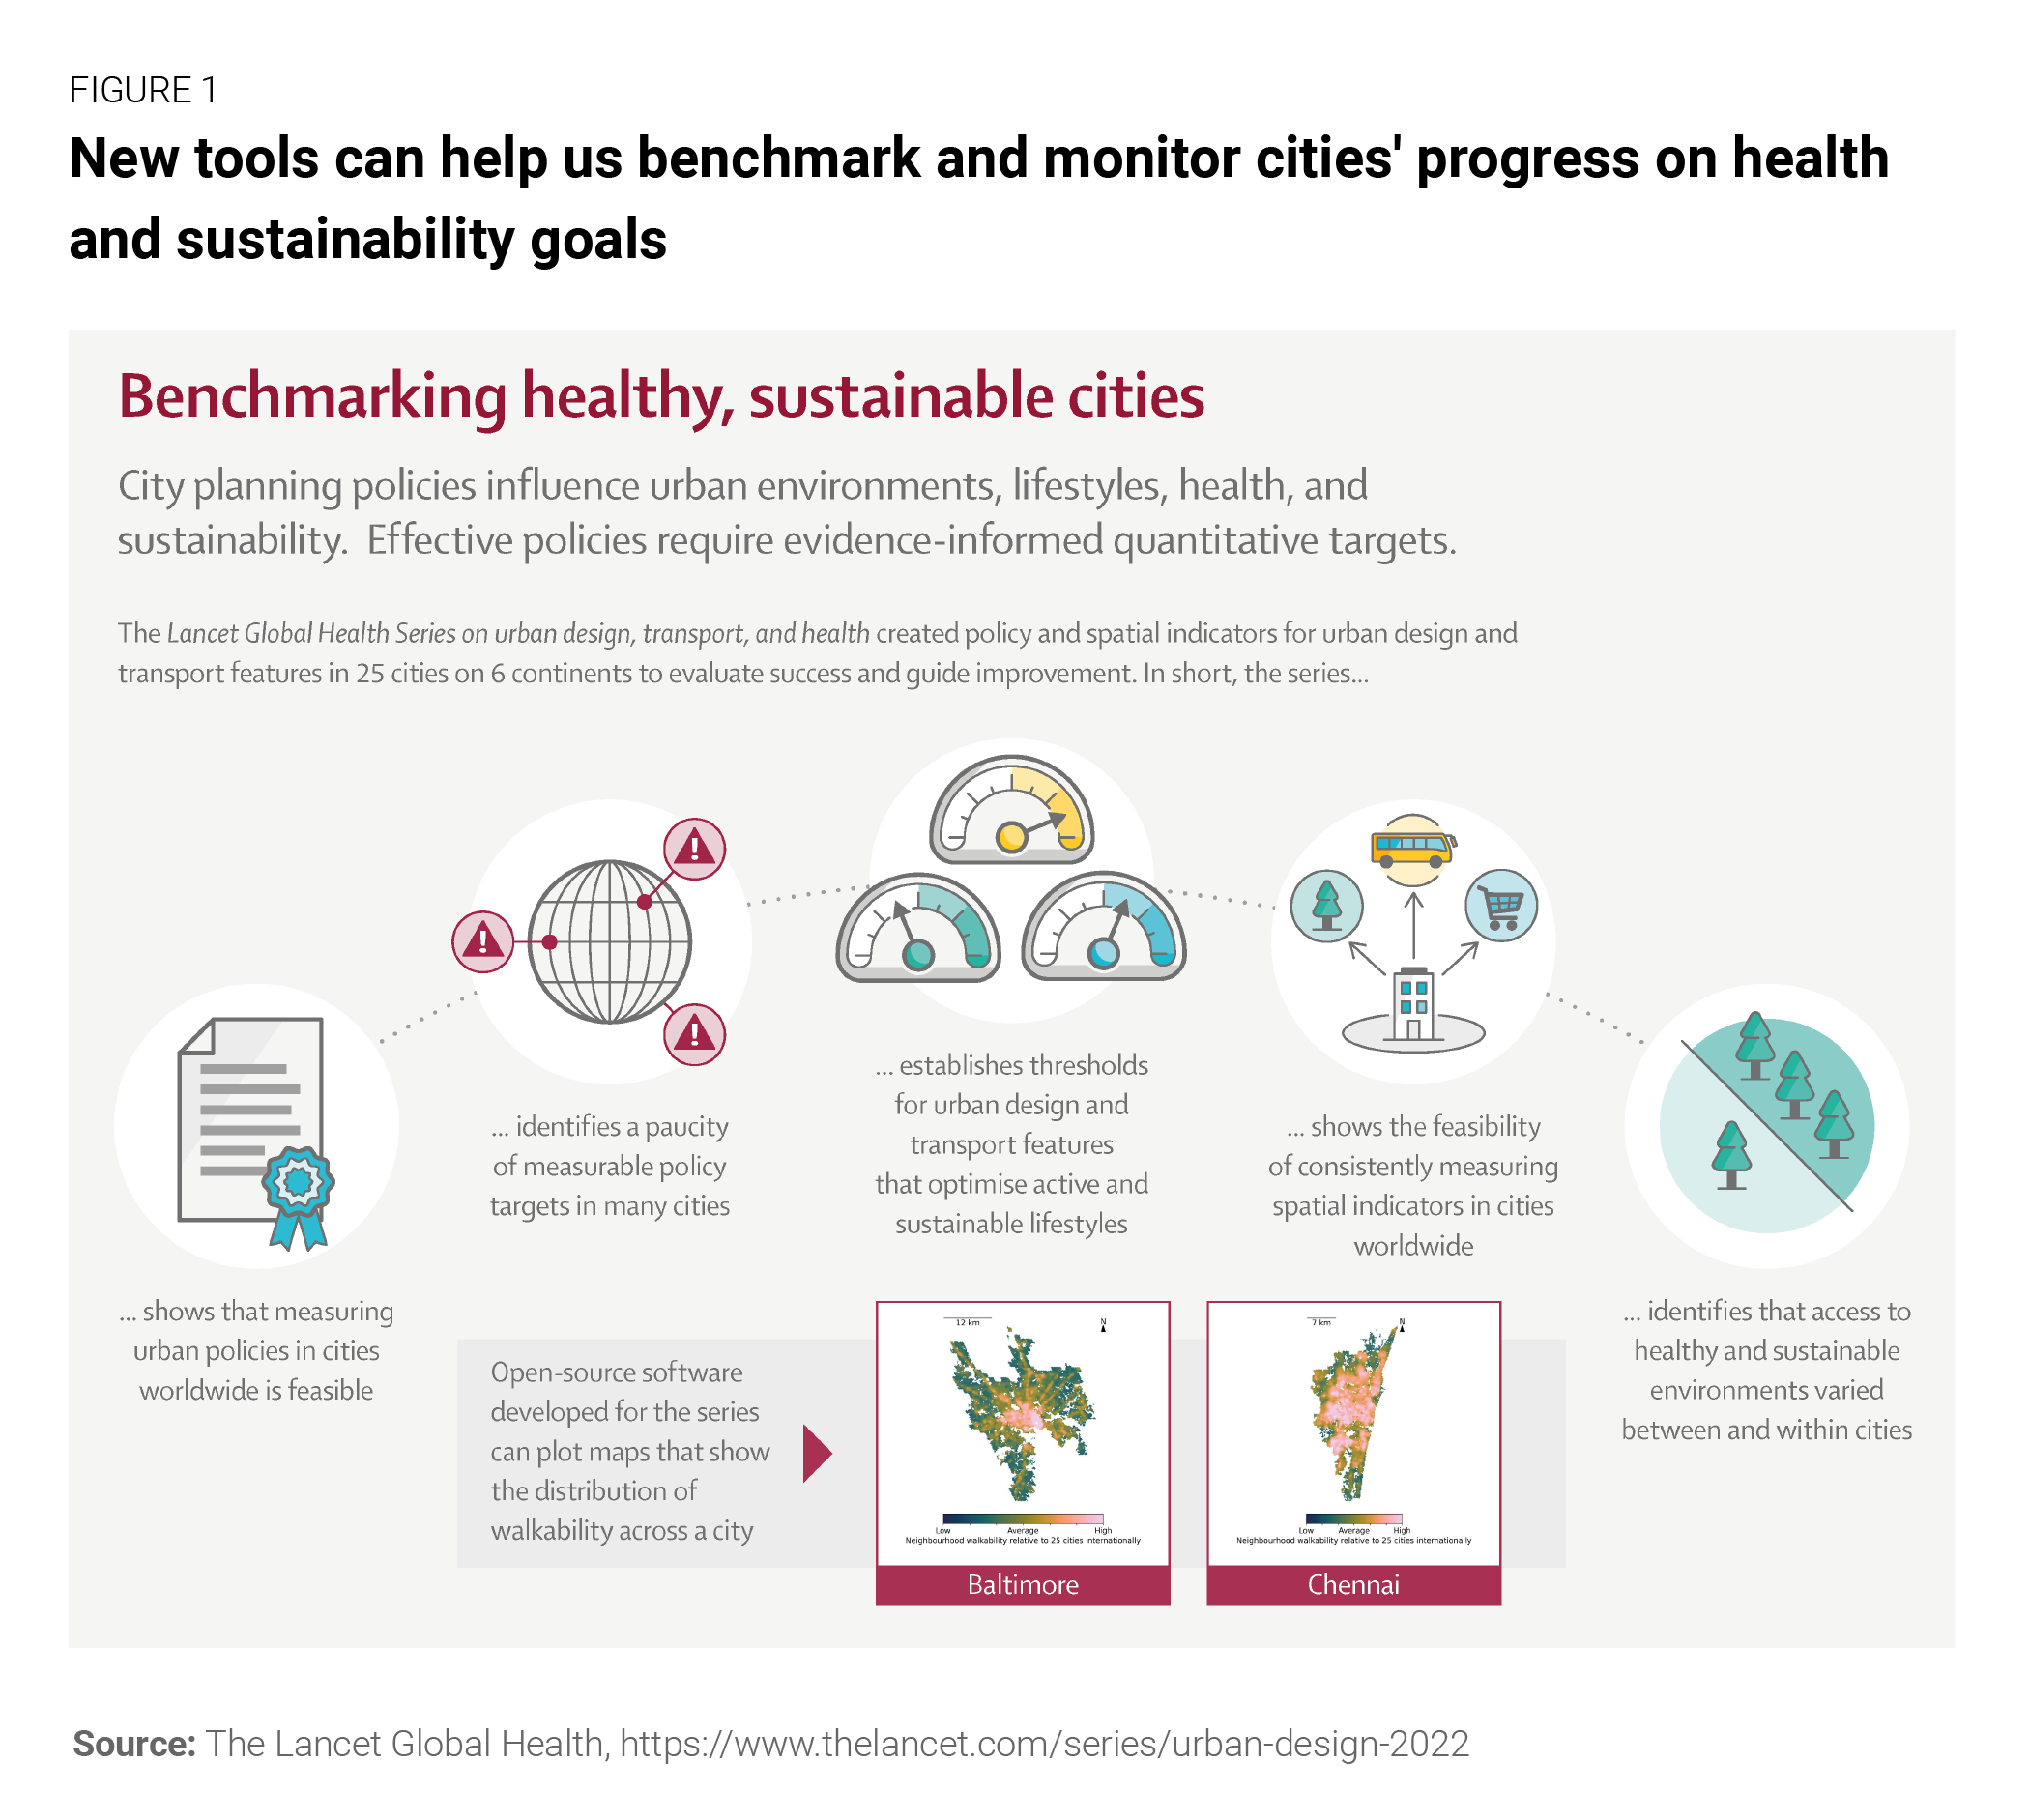
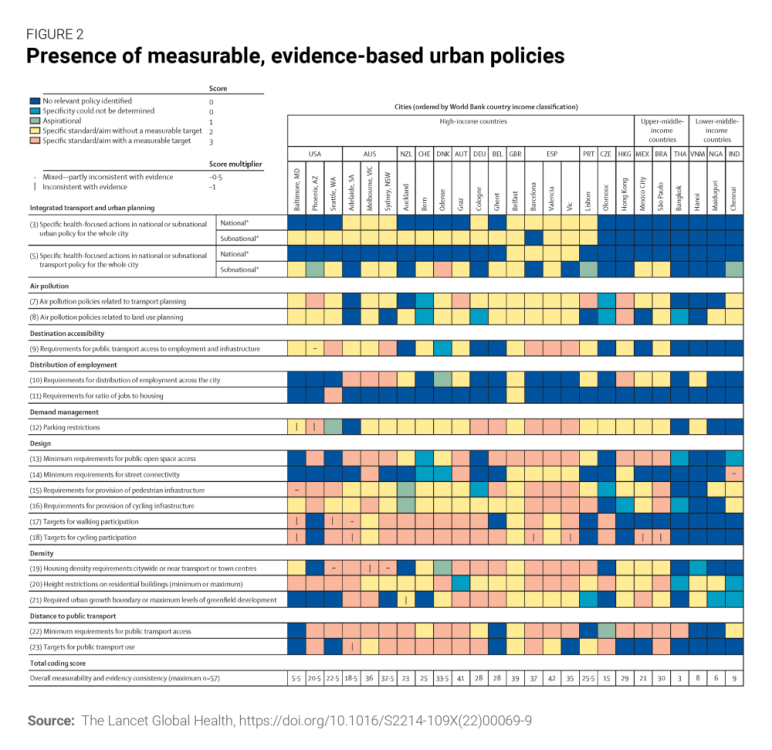
We first worked with our international collaborators to analyze urban policies and calculate built environment indicators for 25 cities across six continents to assess walkability and accessibility. Our analysis revealed many opportunities for improvement. Cities often adopted policies that: 1) were inconsistent with public health evidence; 2) were far more likely to use rhetoric that endorsed health and sustainability goals than adopt measurable policy targets; and 3) left substantial implementation gaps.
Given the gaps between aspiration and performance—and the capacity constraints facing most city governments—we set out to develop open-source software tools to calculate indicators of walkability and accessibility around the world. The results are striking.
Figure 3 shows our local walkability index. The color scale represents standard deviations with zero as global average; higher values indicate better walkability and lower values indicate worse walkability. This reveals less a story about higher-income versus lower-income countries’ cities, and more a story about different “models” of urban planning. Older inner cities tend to be more walkable; newer outer suburbs less so. High-income European cities tend to perform well, while high-income cites in the U.S., Australia, and New Zealand tend to perform poorly.
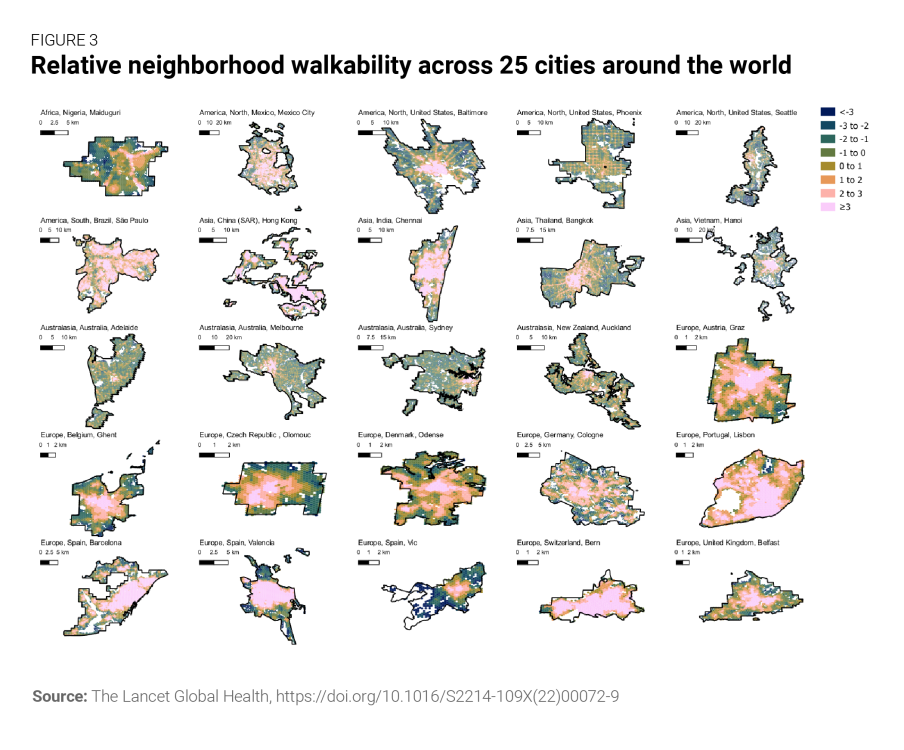
How do we explain this? In our policy analysis, we found that Australian and U.S. cities were the most likely to have transport policies that favor car use over active transport such as walking and cycling, and U.S. cities in particular have fallen further behind modern global goals for public transit access.
São Paulo and Bangkok offer another interesting tale. The former demonstrates good citywide performance, while the latter exhibits poor access outside of the central city. This also matches our policy analysis’s finding that Bangkok had the greatest policy gaps and limitations, while São Paulo’s policy framework performed better than even those of many cities in high-income countries.
These patterns can be explored in more depth by examining walkable access to two important urban amenities: healthy food markets and public transit stops. In general, European cities scored particularly well on access to healthy food markets, while U.S. cities scored particularly poorly. For example, 70% of Bern, Switzerland’s population is within a 500-meter walk of a healthy food market, but only 6% of Phoenix’s population is. Most cities house more than 60% of their population within a 500-meter walk of a public transit stop, but it is noteworthy that three particular cities scored poorly: Mexico City; Maiduguri, Nigeria; and Chennai, India. This is because informal collective transport plays an important role in each of these cities’ mobility patterns, and data to track it are lacking. This remains an important challenge in benchmarking and monitoring cities.
Urban planners can support healthy, sustainable lifestyles by providing built environments conducive to physical activity. But do they? We estimated thresholds of built environment characteristics that support the World Health Organization’s goal of a 15% reduction in insufficient physical activity through walking. Then we measured what proportion of the population lives in neighborhoods that meet these thresholds. Across the cities we studied, 59% of the population met the street intersection density threshold, with nearly even performance between middle-income and high-income cities. Fifty-two percent of the population met the population density threshold, though unevenly so, with 97% meeting the threshold in middle-income countries but only 38% in high-income countries. The numbers vary, but they are all far below where they should be from a public health perspective.
Where do we go from here? Our study developed open-source software and open data in conjunction with local collaborators so that, for the first time, city leaders can both benchmark their progress against other cities and monitor that progress over time. These tools create a new opportunity to target evidence-based planning interventions, monitor policy effects, and harness lessons learned from peer cities.
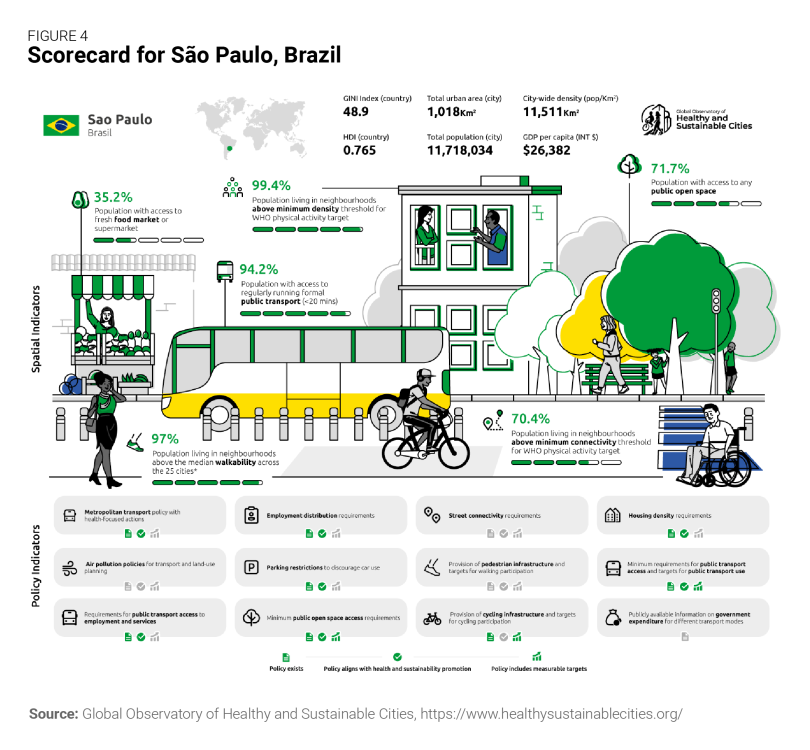
The series of articles is free and open access, as is our software. We have simultaneously launched the Global Observatory of Healthy and Sustainable Cities to advance healthy and sustainable urban planning, benchmark and monitor cities’ progress, and share more consistent, comparable urban data to which anyone can contribute. The Observatory also hosts scorecards for each of the cities in the project; Figure 4 shows an example scorecard for São Paulo.
This project demonstrated how we can monitor healthy and sustainable cities around the world. But it requires international effort to continue measuring and monitoring cities. Organizations like the UN and the World Health Organization play a key role in sustaining this, as do local, regional, and national governments who can use this framework, involve local populations in crowdsourcing data, fill information gaps, and contribute to the open commons and emerging open data platforms.
Few cities in our study had measurable policy standards and targets to actually build healthier and more sustainable cities, and their health-supportive built environment features were often inadequate or inequitably distributed. We must work together across geographies and at all levels of government to better foster healthy, sustainable cities for all.
Author

The Brookings Institution is committed to quality, independence, and impact.
We are supported by a diverse array of funders. In line with our values and policies, each Brookings publication represents the sole views of its author(s).


Commentary
Around the world, cities are falling short on health and sustainability goals
November 16, 2022