Over the past two years, the COVID-19 pandemic has disrupted real estate markets and urban spaces in new and profound ways. Increased work-from-home has boosted demand for larger homes in suburban markets, vacancy rates in downtown offices and retail have spiked, and fewer daily commuters and more flexible work schedules have changed transportation patterns. While there is still considerable uncertainty about how many employers will stick with remote or hybrid work in the long run, policymakers who oversee transportation systems are faced with a number of challenges on how to provide safe, reliable, and affordable options that connect people to jobs, schools, shopping, and entertainment.
This year’s State of the Capital Region report examines commuting patterns and transportation infrastructure and asks: How do residents of the Washington, D.C. metro area get to work? How has this changed over time? And how should policymakers plan for future investments? (Note: Our report does not study travel for non-work trips, which constitute more than half of all trips.)
Four in five Washington-area commuters drive to work—and that number hasn’t changed in half a century
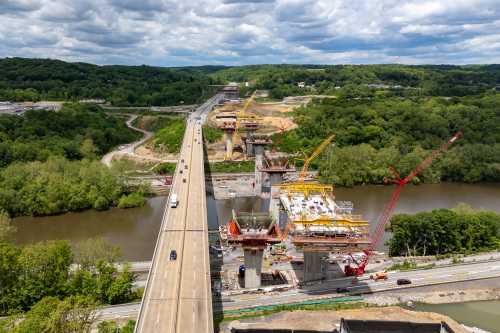
Over the past 50 years, the Washington, D.C. metro area has more than doubled in population, and with that increase has come substantial investment in transportation infrastructure. Construction on the region’s Metrorail system began in 1969, service began in 1976, and the vast majority of its 91 stations were open by the late 1990s. Yet the share of commuters who take public transportation versus those who drive to work has barely budged over this time: Around 80% of commuters still drive alone or carpool, compared to around 15% who ride public transit (Figure 1). Even so, the Capital Region has much higher transit ridership than most U.S. cities; only New York has more transit rides per capita.

COVID-19 has devastated public transit ridership
Public transit ridership in most U.S. cities has suffered a gut punch over the past two years, as more downtown office workers shifted to work-from-home or hybrid models.
Prior to the pandemic, employment in the Washington, D.C. region was highly centralized, with a large share of the region’s jobs—especially those in government and professional services—located near the downtown core. Metrorail’s hub-and-spoke system was designed to carry workers from their suburban homes to that downtown core, as well as to supporting businesses like coffeeshops, restaurants, and bars. Tourists relied on Metrorail to access centrally located hotels, museums, and entertainment venues. The federal government—a major downtown office tenant—still has not recalled most of its workforce to the office, while many businesses in the urban core have shuttered.
The loss of economic activity is reflected in continuing low ridership. Rail trips are at approximately 40% of January 2020 levels, while bus ridership is around 65% (Figure 2). Notably, bus riders have lower average incomes and are less likely to own cars than commuters who take rail, making them more dependent on transit services. Many lower-paid essential workers—including staff at health care facilities, pharmacies, and grocery stores—depended on public transit throughout the pandemic. Ridership has recovered some from the trough in July 2020, and may rise further as public health concerns recede.

Transit ridership was declining for a decade before COVID-19
Taking a longer view, Metrorail ridership had been declining gradually for a decade before the pandemic hit. Annual trips peaked in 2010 around 350 million and had fallen to about 300 million by 2019. Riders and transit observers cite a number of problems with the agency during this period, including unreliable and infrequent service and safety hazards. Another notable development during these years was the rapid expansion of ride-sharing services such as Lyft and Uber; these companies can act both as substitutes for public transit and as complements, fixing the so-called “last-mile problem,” or the gap between riders’ home and transit stations.

There are several ways to interpret the decade-long decline in transit ridership. On one hand, we could view it as consumers voting with their feet in the transportation marketplace and moving away from public transit toward more preferred options. But there are broader regional economic, social, and environmental consequences to commuters’ individual choices.
Moving commuters in individual cars (especially sole-occupant vehicles) requires much more physical space compared to shared buses or trains. Smaller shares of transit riders mean more traffic congestion and longer commute times for everyone. The transportation sector is one of the largest contributors to greenhouse gas emissions and localized air pollution; more drivers and fewer transit riders leads to worse air quality and more negative health outcomes in the region. Owning and maintaining a car is expensive; these costs are especially onerous for low- and moderate-income households. And finally, not everyone is legally or physically able to drive; children, people with disabilities, and older adults are among the groups who are most reliant on non-car transportation.
The costs of poorly functioning transit systems fall hardest on low-income households
The critical challenge for policymakers in the Capital Region and other large cities is how to provide reliable, climate-friendly transportation options for all residents—including people who cannot afford to own cars or cannot drive—within the existing fiscal framework.
Maintaining fixed-infrastructure transit systems (notably, subway and commuter rail) with declining ridership will be increasingly expensive. Reducing service frequency and reliability to cut costs will push more commuters away from transit—as the recent experience with removing Metrorail’s 7000-series cars has demonstrated. The counties and cities that make up the Capital Region face limits on their fiscal capacity (and taxpayers’ willingness to pay), yet federal support is politically uncertain.
The burdens of bad public transit fall hardest on low-income households, who have more difficulty carrying the costs of car ownership, tend to live far from major job centers, and are less likely to have remote work options. Therefore, policy decisions on transit service have important equity implications.
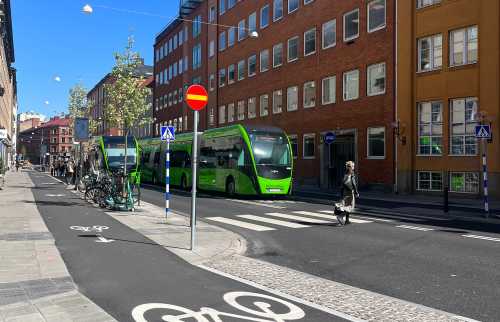
This report focuses only on home-to-work commuting patterns; non-work trips are an important area for further study. Expanded work-from-home may drive more demand for locally serving retail and food service in residential areas throughout the Capital Region. If so, local governments should consider how to make it easier and safer for people to access these services by non-car means, such as walking and biking.
Authors


The Brookings Institution is committed to quality, independence, and impact.
We are supported by a diverse array of funders. In line with our values and policies, each Brookings publication represents the sole views of its author(s).
Commentary
Greater Washington’s commuters continue to choose gridlock
May 6, 2022