The Bureau of Labor Statistics recently released its metropolitan area unemployment estimates for the month of September. In this data snapshot, I compare each metro area’s September rate of unemployment with its pre-recession low to find out which regions have recovered.
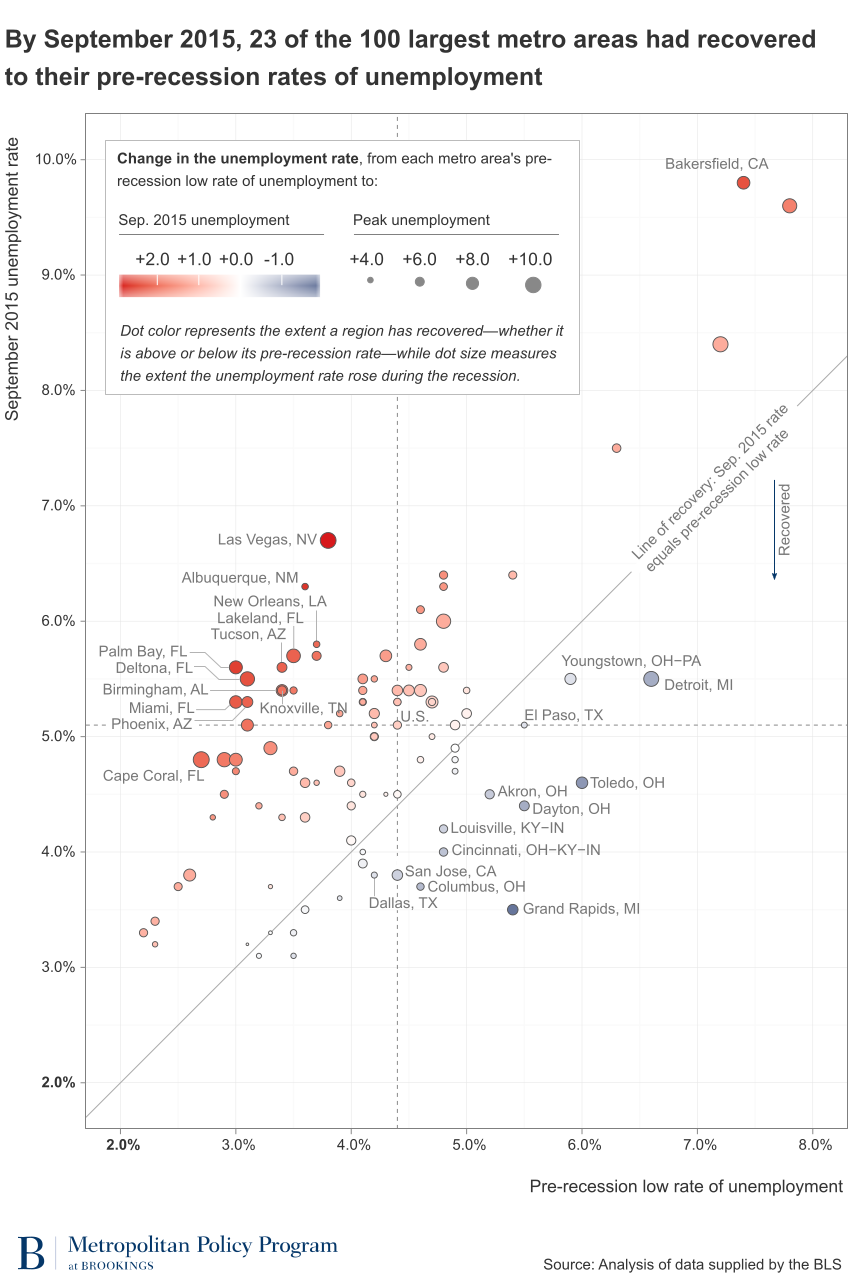
As of September, 23 of the 100 largest U.S. metropolitan areas had reached or dipped below their pre-recession low rate. Metro areas in Michigan and Ohio topped the list, as Grand Rapids, Toledo, Dayton, Detroit, Columbus, Cincinnati, and Akron were all 0.7 percentage points or more below their pre-recession rates.
On the flipside, 77 of the 100 largest metro areas remained above their pre-recession unemployment rates. Of those, 32 were within one percentage point of recovery, 34 were within two percentage points, and the remaining 11 had unemployment rates that were more than two percentage points higher than their pre-recession rates. These places are mostly in California, Florida, and the Mountain West where the collapse of housing prices left lasting damage.
The chart below presents September unemployment rates (vertical axis) against pre-recession low rates of unemployment (horizontal axis). The slanted gray line indicates where pre-recession unemployment rates would equal current rates. Points above this line represent metro areas where current unemployment rates remain higher than their pre-recession lows while points below the line represent metro areas where the unemployment rate has recovered beyond pre-recession levels.
Data notes:
Unemployment rates are seasonally adjusted.
For each metro area, the pre-recession low rate of unemployment equals the lowest unemployment rate recorded between January 2004 and June 2009 (the official end of the last recession). Peak unemployment measures the highest unemployment rate between the pre-recession low and September 2015.
The 100 largest metro areas are determined according to population. In New England, the BLS publishes data for New England City and Town Areas (NECTAs), which differ from the county-based definitions used to determine the 100 largest metro areas.
The Brookings Institution is committed to quality, independence, and impact.
We are supported by a diverse array of funders. In line with our values and policies, each Brookings publication represents the sole views of its author(s).


Commentary
Data snapshot: September unemployment in the 100 largest metropolitan areas
December 3, 2015