This Tax Day we want to draw your attention to newly-released resources that demonstrate the widespread impact of federal tax policies targeted to low- and moderate-income working families, particularly the Earned Income Tax Credit (EITC) and the Child Tax Credit (CTC).
New IRS data for Tax Year 2012, now available through our EITC Interactive, show that in 2012, 26.2 million filers received the EITC, claiming an average credit of $2,359. Almost 60 percent (15.7 million) of EITC filers also went on to receive the refundable portion of the Child Tax Credit, claiming an additional $1,266 on average.
These refundable tax credits not only encourage and support work but also offer an effective poverty alleviation tool. As we wrote earlier this year, according to the Census Bureau’s Supplemental Poverty Measure (SPM), nationally the poverty rate would have been 3 percentage points higher in 2012 without the EITC and the refundable portion of the CTC. For children, the impact of these credits was even greater, effectively lowering the child poverty rate by 6.7 percentage points.
The new EITC Interactive data provide a variety of detailed information on all tax filers and EITC recipients in particular, and allow users to see the extent to which their community benefits from different elements of the tax code. Data are available for download at different levels of geographic detail, including ZIP codes, cities, counties, metro areas, and states. And users can also find data for state legislative and congressional districts.
Below is a snapshot of the share of filers that received the EITC by congressional district in Tax Year 2012:
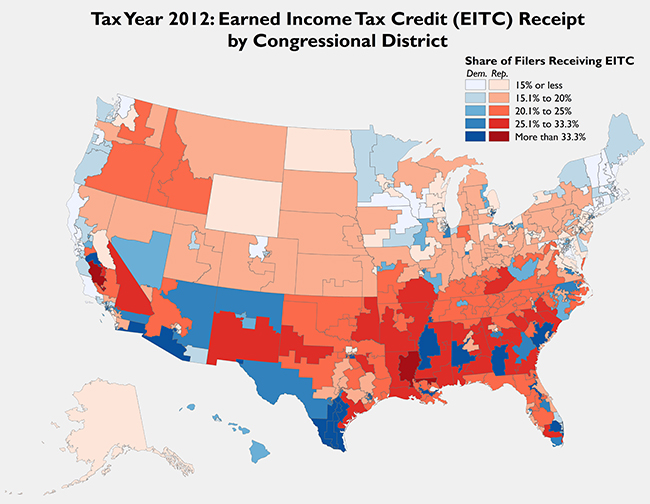
While every congressional district contains taxpayers who benefited from the EITC in TY2012, districts in the South are particularly prominent for higher-than-average rates of EITC receipt. Variation in EITC receipt can stem from differences in costs of living (since the same eligibility guidelines apply nationally), population dynamics (such as differences in age profiles, household composition, and family size), and the prevalence or concentration of lower-wage jobs. Nationally, EITC-eligible taxpayers are most likely to work in retail trade, health care, accommodation and food services, manufacturing, and construction. Notably, EITC receipt spans the red/blue divide, with both Democratic and Republican districts posting sizable shares of EITC filers—an important reminder to both sides of the aisle as Congress and the administration consider proposals to expand the EITC for childless workers.
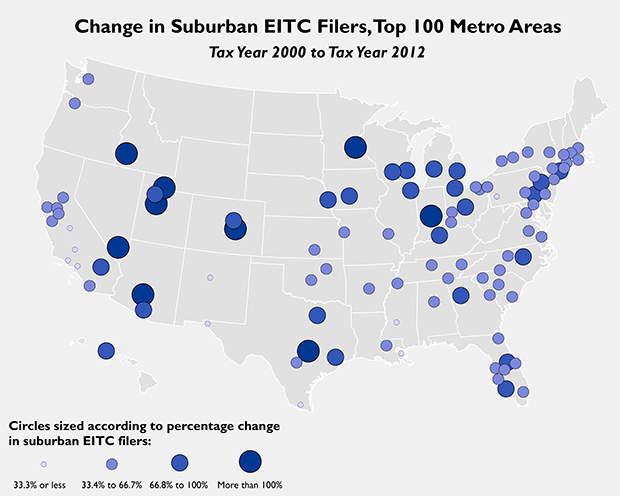
Because the EITC is administered through the tax code, the distribution of EITC recipients has shifted with changes in the location of the low-income population over time. As the low-income population has rapidly suburbanized in recent years, so, too, has the geography of EITC recipients. Between Tax Year 2000 and Tax Year 2012, the number of filers claiming the EITC in the suburbs of the 100 largest metropolitan areas increased by 58 percent, versus an increase of just 29 percent in the largest cities. Those increases closely mirror shifts in the poor population in these regions, which grew by 65 percent in suburbs and 30 percent in cities over the same time period.
In a number of major metropolitan areas—like Austin, Minneapolis-St. Paul, and Phoenix—the number of suburban EITC filers more than doubled over the decade, a reflection of the growth in the suburban low-income population as well as expansions to the credit made following the Recession.
For more detail on where and how the EITC and CTC work and who benefits, visit the newly updated EITC Interactive to access downloadable tax data resources.
Changes were made to the original post on April 16, 2014
The Brookings Institution is committed to quality, independence, and impact.
We are supported by a diverse array of funders. In line with our values and policies, each Brookings publication represents the sole views of its author(s).


Commentary
New Data Illustrate Local Impact of Tax Credits for Working Families
April 15, 2014