This post discusses my monthly update of the Barnichon-Nekarda model. For an introduction to the basic concepts used in this post, read my introductory post (Full details are available here.)
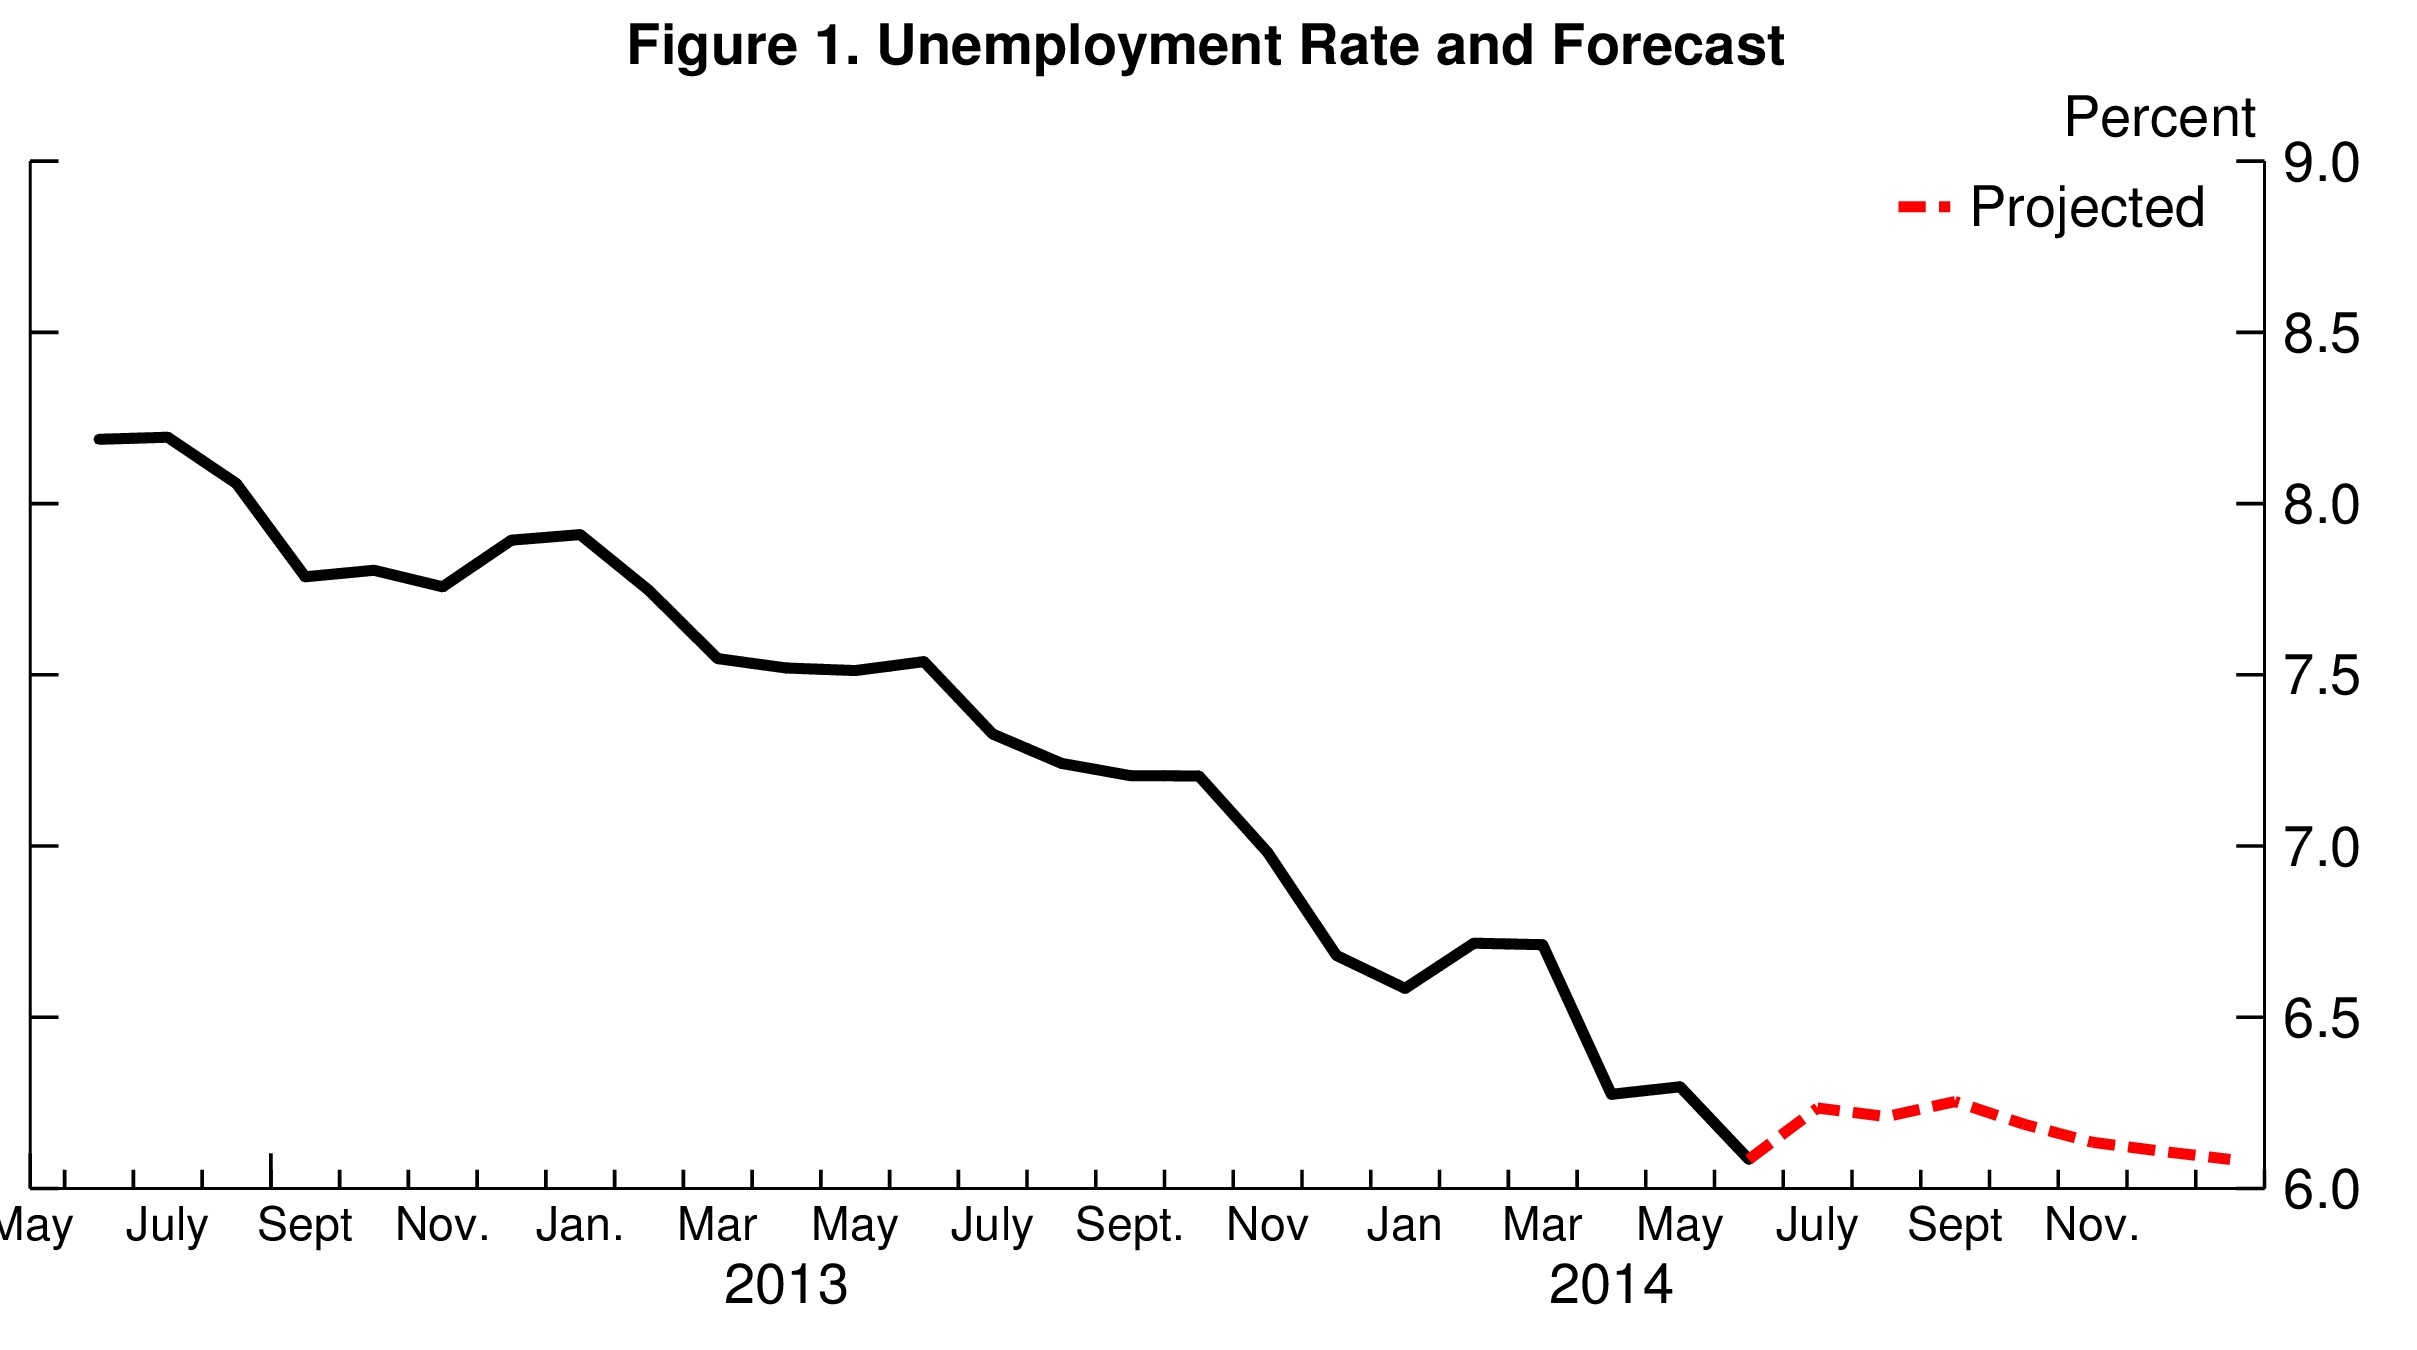
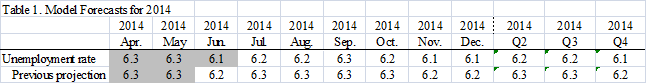
In June, the unemployment rate declined to 6.1%, a little faster than anticipated in last month’s forecast. That decline was due to an unexpectedly high number of workers who left the labor force. The model does not expect this level high to persist, implying that the unemployment rate will likely go back up slightly next month, then hover around 6.2 percent and end the year at 6.1%.
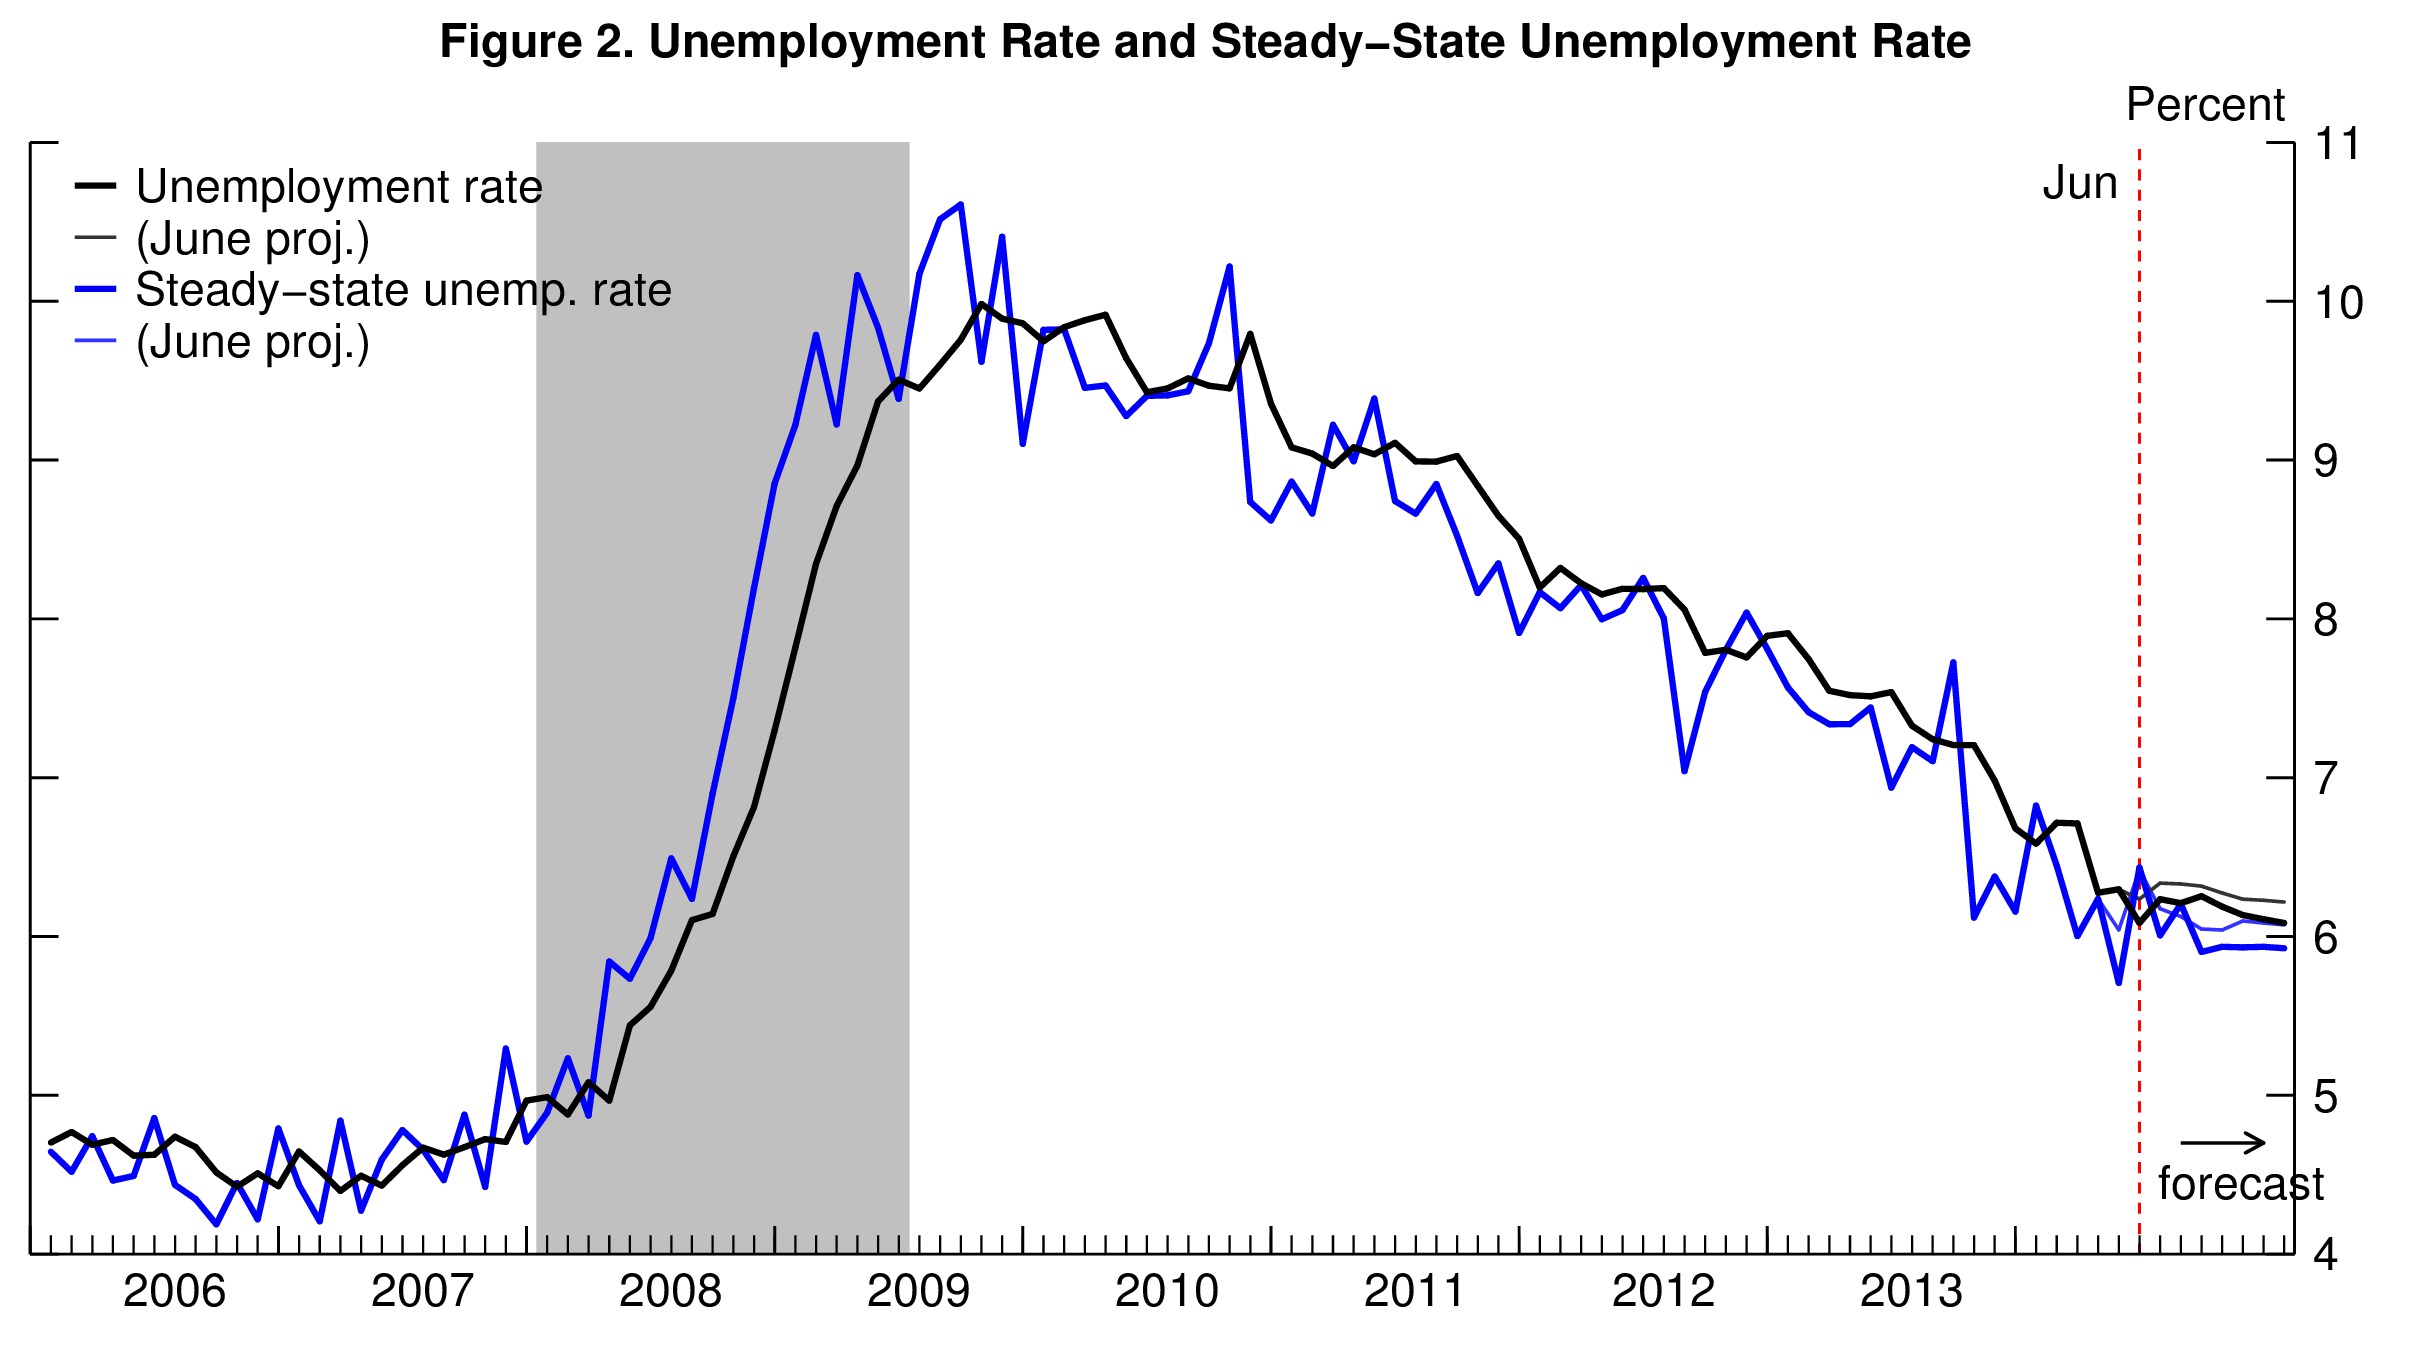
This model’s forecast can be easily understood by looking at the projected behavior of the “steady-state” unemployment rate. The steady-state unemployment rate, the rate of unemployment implied by the underlying labor force flows—the blue line in figure 2— stands currently at 6.4%, 0.3% higher than the actual unemployment rate. Our research shows that the actual unemployment rate converges toward this steady state. With a steady-state unemployment rate slightly above the actual rate, the “steady-state convergence dynamic” would tend to push the unemployment rate up going forward. However, this effect is counter-balanced by an anticipated decline in the steady-state unemployment rate (SSUR) over the coming months with a steady-state rate of 5.9% by the end of the year (figure 2). Combining these two effects, the unemployment rate should stay around 6.2 percent over next 6 months.
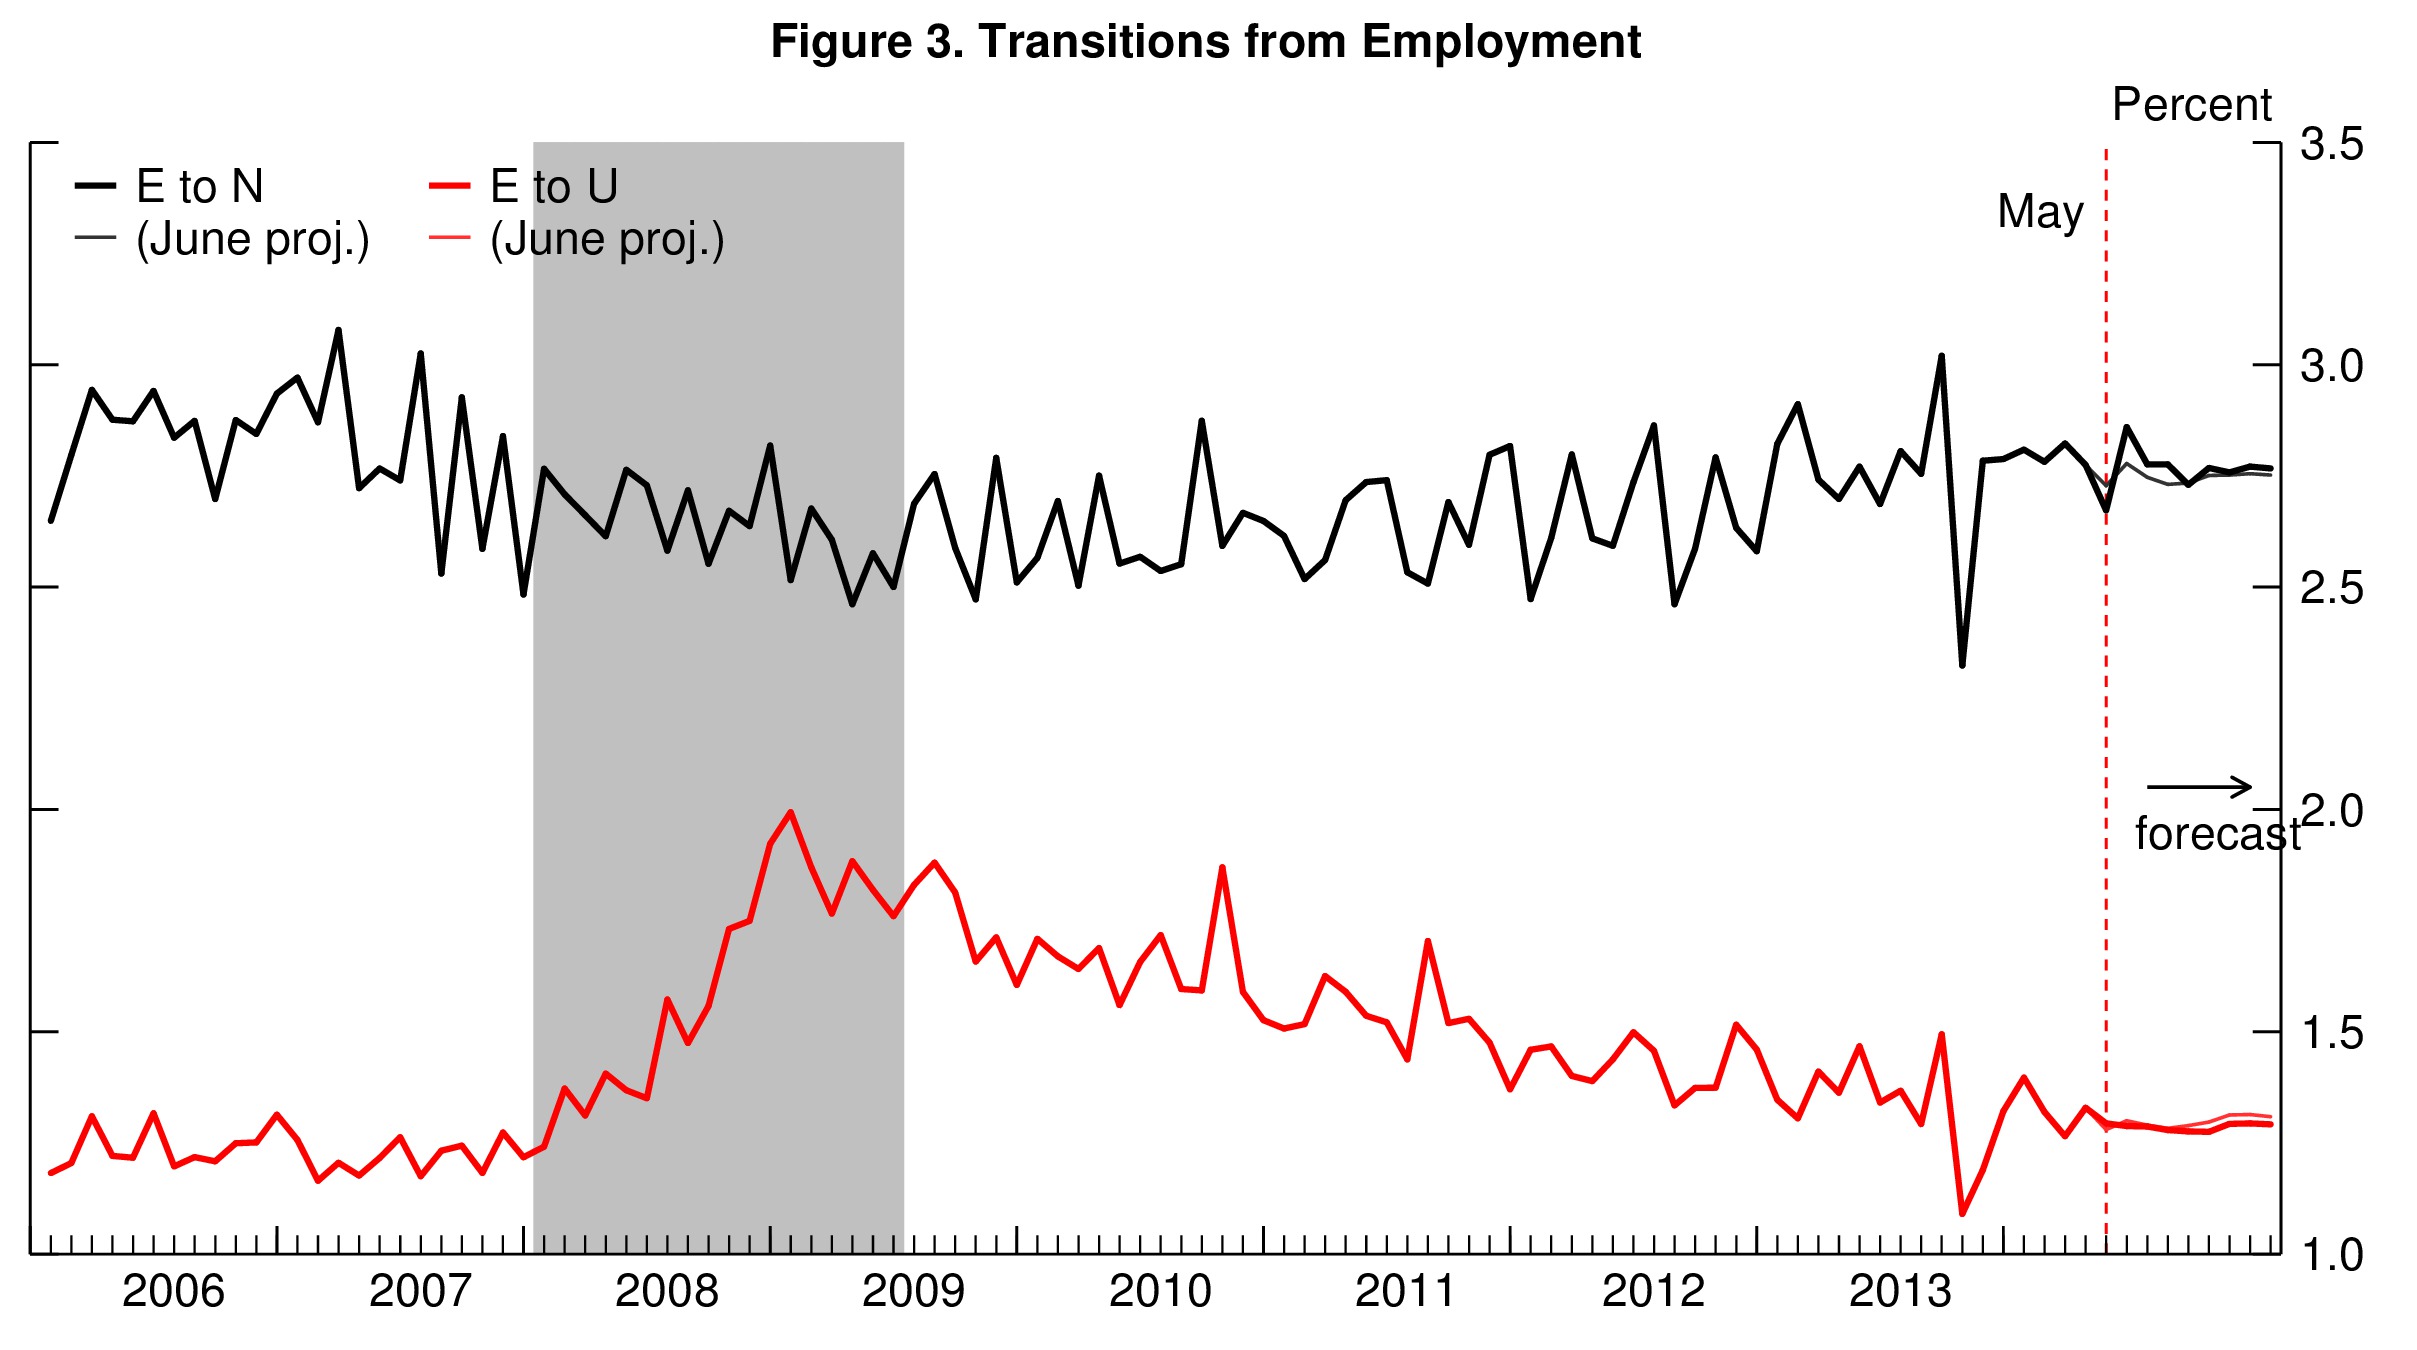
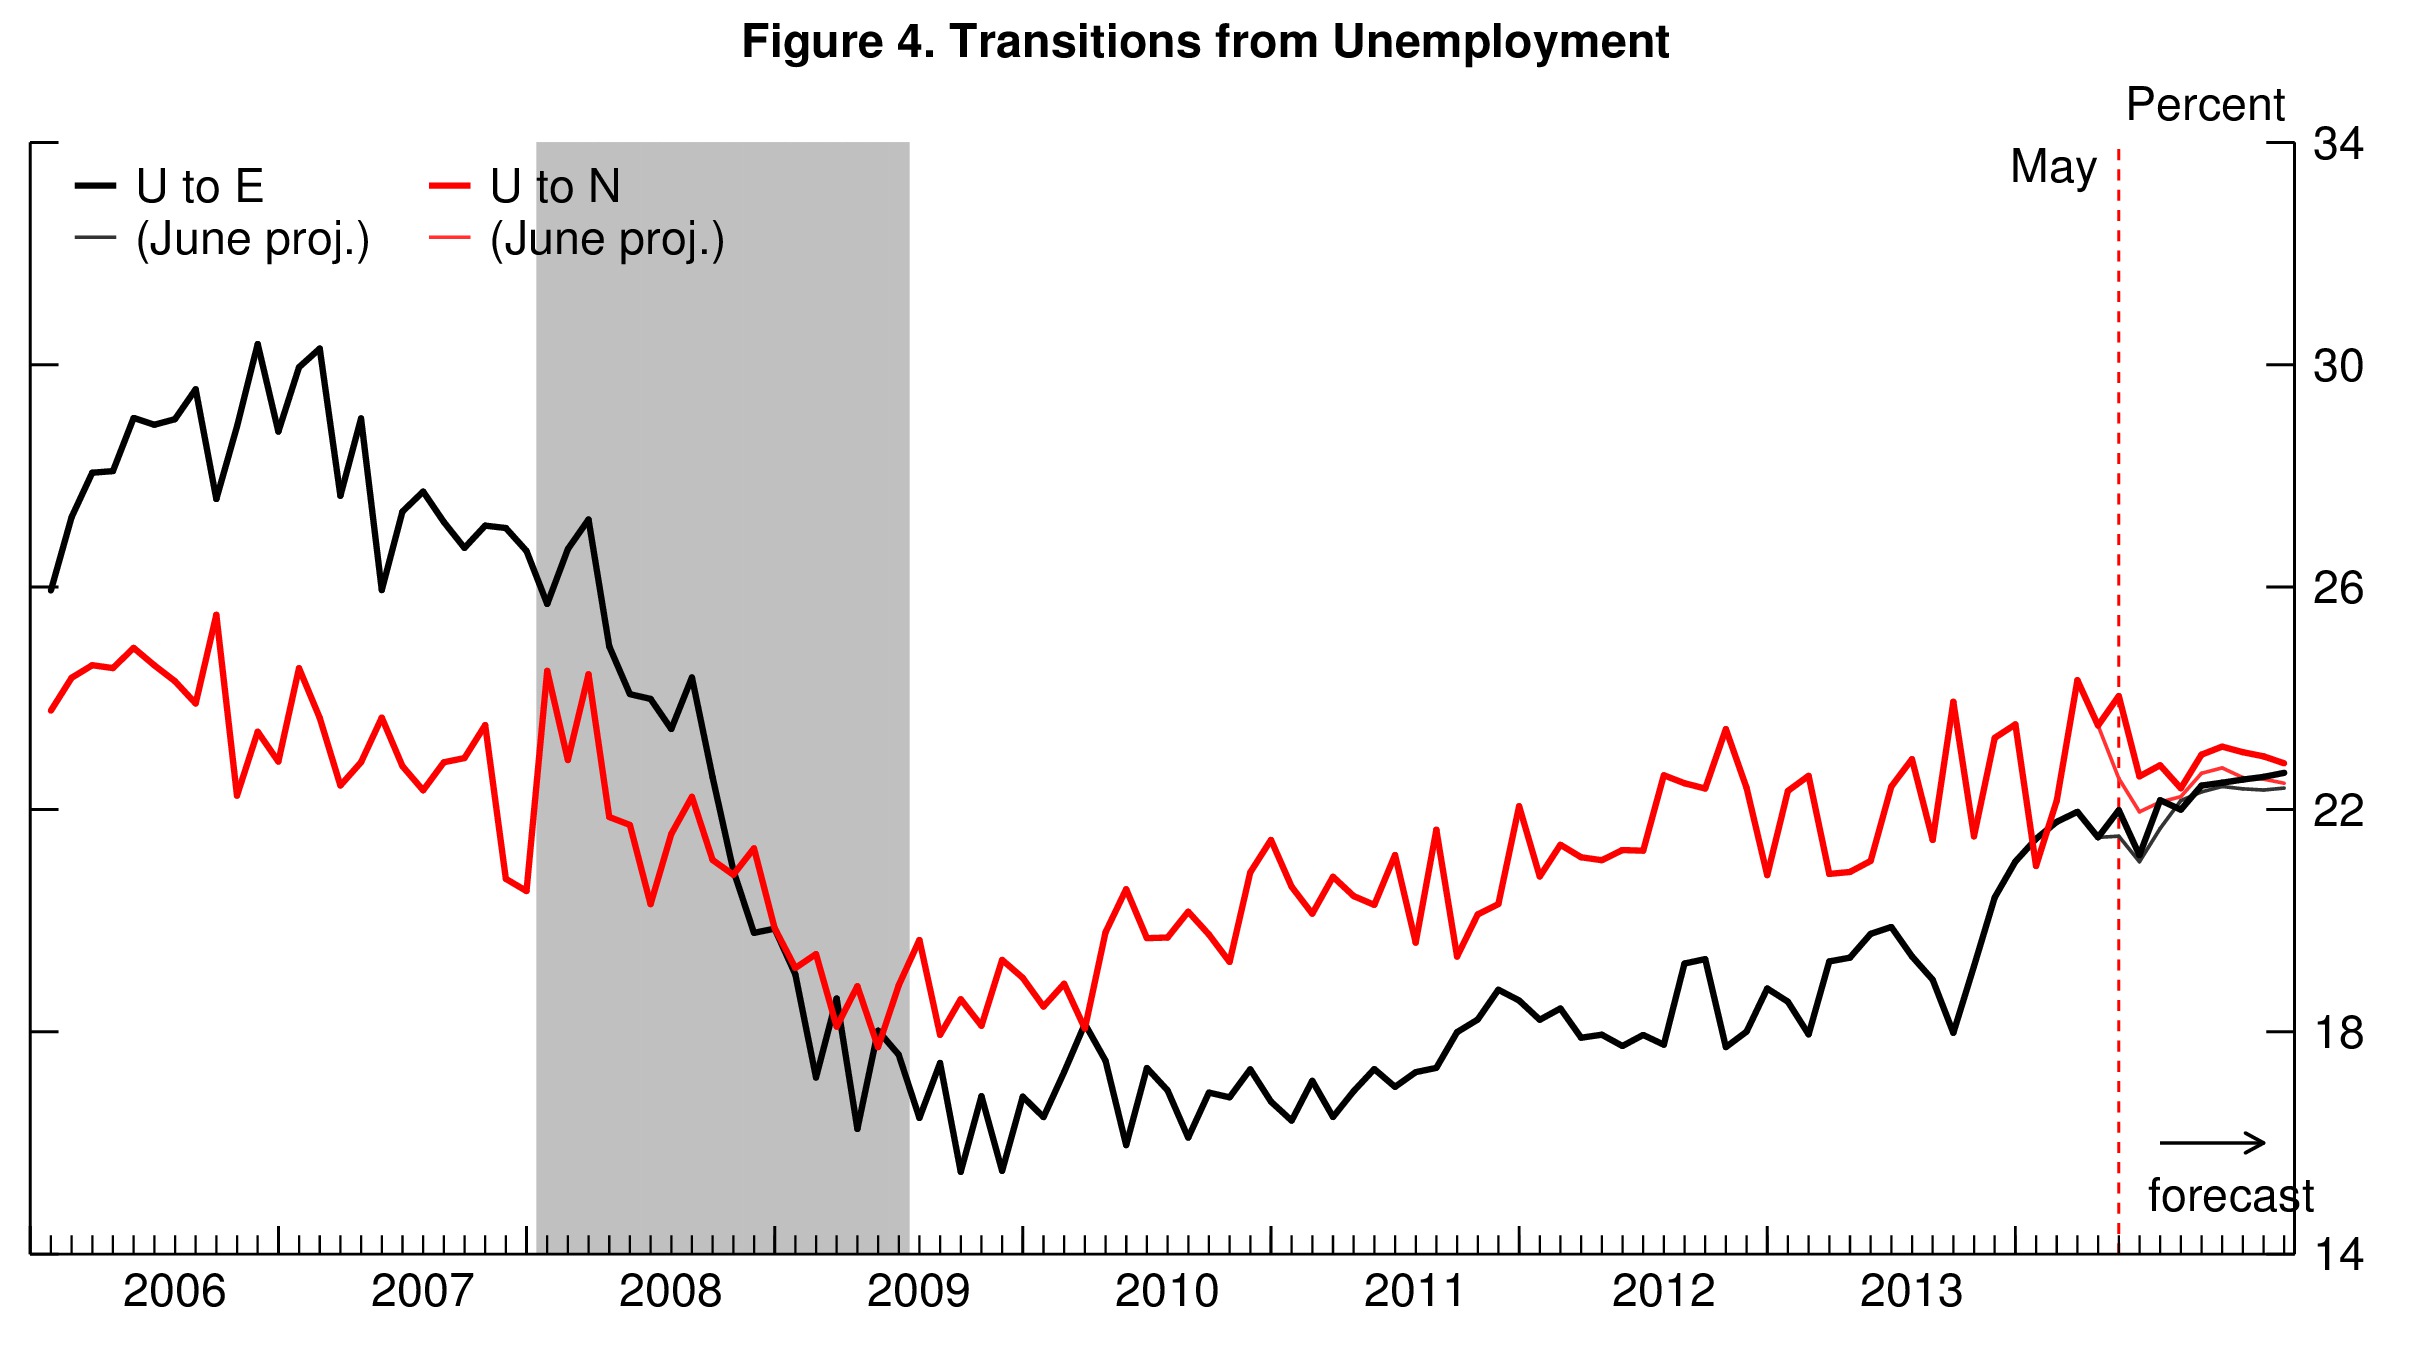
To forecast the behavior of steady-state unemployment, the model propagates forward its best estimate for how the flows in and out of unemployment will evolve over time. The two most important flows –workers’ job finding rate (UE) and workers job separation rate (EU)—have been behaving as predicted by the model (figure 3 and 4), and their forecasts are little changed. The difference with last month’s forecast is due to the elevated level of the UN transition rate –the propensity of workers to drop out of unemployment and leave the labor force– (figure 4). Based on the past behavior of the UN rate, the model anticipates the UN rate to go back to a lower level over the coming months, which increases the steady-state unemployment rate and will generate upward pressures on unemployment going forward.
That being said, I think this forecast should be taken with caution, and I see some downward risk to the forecast (meaning that unemployment could go down faster than suggested by the model). Forecasting the UN rate is especially difficult, since, unlike for the UE or EU rate, there are no hard data (such as vacancy posting or UI claims) to help guide the forecast. As shown in figure 4, the UN rate is still considerably below its pre-recession level, so that there is still a lot of room for further upward movements in the UN rate (and thus for a stronger decline in unemployment).
To read more about the underlying model and the evidence that it outperforms other unemployment rate forecasts, see Barnichon and Nekarda (2012).
The Brookings Institution is committed to quality, independence, and impact.
We are supported by a diverse array of funders. In line with our values and policies, each Brookings publication represents the sole views of its author(s).


Commentary
Unemployment to Hover Around 6.2 Percent for the Next Six Months
July 30, 2014