Since the first novel coronavirus case in the United States was registered on January 19, 2020, we have learned one thing about the discipline of public health: It has been masquerading as medicine but it is at best a social science, and not an especially sophisticated one. Public health experts in the U.S. and the World Health Organization (WHO) have even made economists sound coherent and consistent.
More than three months into the outbreak, we have no clue about how many people are infected. Until we have reliable estimates of infection rates, public health professionals will not be able to tell us much about which places and people are most vulnerable to the virus, what might help to contain it, and how long the epidemic will be around. We’ll have to wait for accurate and affordable testing to know the extent of the infection. Public health experts admit that without rigorous randomized testing—which is several months away—and a safe and effective vaccine—which may be more than a year away—they cannot tell us for how long economies have to be shut down.
To be fair, many things affect the spread and severity of any virus: medical conditions, the weather, population densities, economic structures, political considerations, social norms and, of course, government policies. Almost by definition for a novel virus like COVID-19, reliable data are not easy to come by. But the confusion among public health experts is being compounded by some avoidable problems. One is that the WHO, the agency that should have led the response, has been politicized. The second is that information being supplied by the Chinese Communist Party, the government with the longest experience in dealing with the disease, is unreliable. The third is that Taiwan, which has done the best so far in containing the outbreak and keeping its economy working (while remaining the second most free country in Asia), has been deliberately shut out of the international community. It all seems pretty hopeless.
Actually, not quite. There are ways to learn quickly about what works to contain the virus. One way is to study places that are similar in most aspects but have completely different rates of COVID-19 cases and deaths. The WHO has failed to establish uniform standards and ensure accurate reporting, but we can still compare places within a single country whose data are reliable (Figure 1). Despite obvious deficiencies in testing in the U.S., developing countries can learn a lot from its experience. And we can learn even more from Taiwan.
Figure 1. California is doing the best, New York the worst
 Source: COVID Tracking Project.
California has been the best performer among U.S. states that have had at least 10 COVID-19 deaths; New York has been the worst. But these are big states and they differ in many aspects. It is more informative to compare cities that are similar but have fared differently in dealing with the disease. Two obvious candidates are New York City and San Francisco, the most densely populated cities in these states and the two densest large cities in the U.S. (Table 1). Both are coastal, located on roughly the same latitude (40.8°N and 37.8°N respectively), and their climate in March is not all that different. They have similarly strong linkages with China, measured, for example, by air traffic between Wuhan and these two cities. Their politics are similar: Both have Democratic Party city mayors and both are in states run by Democrats. But COVID-related outcomes in these cities are even more different than those of their states.
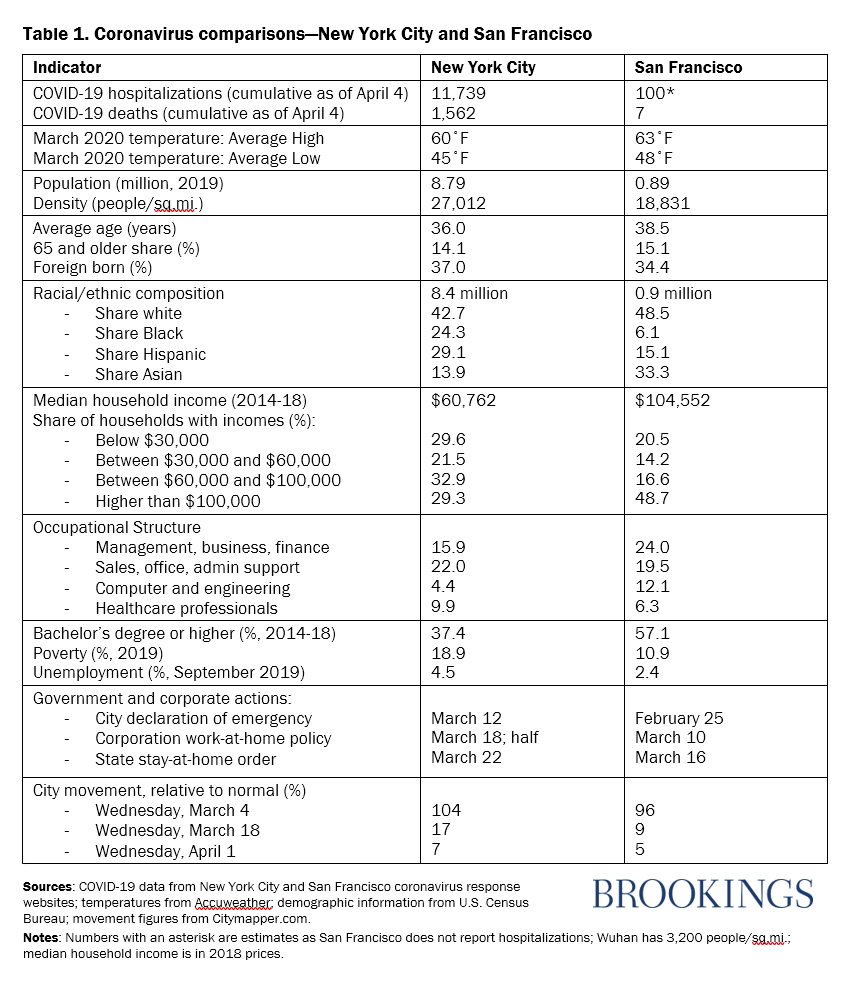
Table 1 documents some differences between the two cities that may not be known widely.
- San Francisco is a lot richer, with a much lower poverty rate and more educated population.
- Half of all New Yorkers are Black or Hispanic, compared with one-fifth of San Franciscans. Asians are one-third of San Francisco’s population, compared with one-seventh in New York.
- New York has more health professionals per capita: 10 percent to San Francisco’s 6.
City governments responded to the crisis in discernably different ways. San Francisco was much quicker to adopt the recommendations by medical and epidemiological experts—economic lockdowns, physical distancing, and hygienic safeguards—and has been better in implementing them. Private enterprises—especially big employers—in the Bay Area also showed much greater flexibility than in New York City.
The two cities have had enormously different outcomes. Their COVID-19 trajectories since January 19, when the first case was registered in the United States, are polar opposites. Until March 5, neither city had recorded a single coronavirus-related hospitalization or death. This is what Dr. Robert Wachter of the University of California in San Francisco wrote on Tuesday, March 31:
“As recently as March 10, the rates of confirmed coronavirus infection in New York City and San Francisco were roughly the same: New York City had seven cases and San Francisco had 14. On Monday evening, New York City had more than 38,000 confirmed cases and 914 deaths; San Francisco had over 374 cases and six deaths.”
Since New York City has roughly 10 times as many people as San Francisco, these numbers should be rescaled to be comparable. The correct comparison, on March 31, would have been 38,000 cases in New York to about 3,800 for San Francisco, and 900 deaths to 60. The differences remain remarkable. (See the latest numbers for New York City and San Francisco.)
Can poorer countries learn anything from the experience of two wealthy cities? I think so, and here are my top takeaways:
1. Pay attention to economic—not physical—geography
People are hoping that warmer weather comes to the rescue because there is some evidence that this coronavirus likes temperatures between 40 and 60 degrees. But with a generally similar geography during the month of March, these two cities have fared so differently. Besides, viruses tend to mutate in response to changing conditions and to reappear when favorable weather returns. The closer correlates of viral outbreaks are population densities, migration linkages, and economic distance from places that are already infected— like Wuhan and Milan earlier this year, and New York and New Orleans now. Developing countries such as India should not be waiting for warmer weather; they should be targeting their densest settlements (such as Mumbai) and internationally connected states (such as Kerala).
The sine qua non of any policy response should be temporary travel and trade restrictions to sharply increase the economic distance between places with high infection rates and those that are deemed to be high risk. In this aspect, it is clear that China and the U.S. acted sooner than most Western European countries, and California moved more quickly than New York.
2. Treat poverty as an “underlying condition”
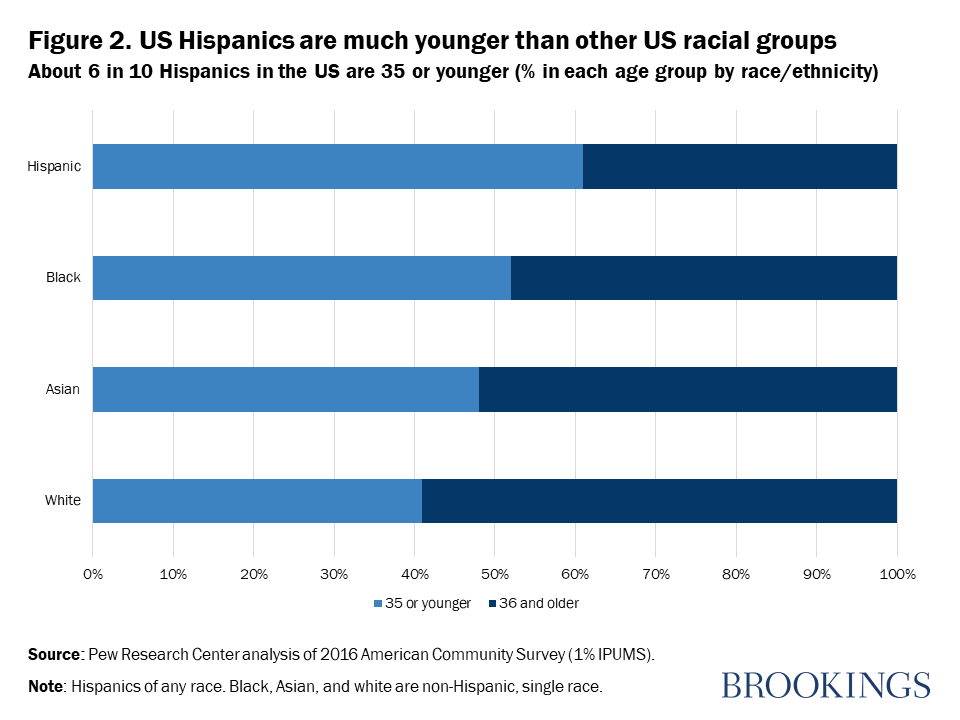
The most striking socioeconomic difference between the two cities is that the Black share of the population is four times higher in New York (Table 1). This could spell trouble for cities like Chicago that are similar in this aspect to New York; it may be deadly serious for cities like Detroit, New Orleans, and Atlanta where the Black populations are about 80, 60, and 50 percent respectively. Latinos are also more prone to noncommunicable diseases than whites and Asians, but they are much younger (Figure 2), likely offsetting the group’s “herd vulnerability” to COVID-19. Black residents appear to be most at risk: They tend to live in densely populated parts of cities, they are poorer than others except Latinos, they tend to be older than Hispanics, and they are most prone to ailments such as asthma, diabetes, and hypertension.
The point is that while individual medical conditions like heart disease and diabetes are the most reliable indicators of susceptibility, “herd averages” should be used to target COVID-19 testing, information programs, and medical care in countries such as Brazil, Bolivia, Mexico, and Peru that have vulnerable racial or ethnic minorities. It is also worth noting that 1 in 3 residents of San Francisco is Asian, and Asian Americans tend to be older than Hispanic and Black Americans. Connections with China can easily be offset by measures to mitigate and monitor the spread of the infection. Group socioeconomic averages—of attributes such as income and education—appear have stronger influences on COVID transmission and trauma. This should worry the administrators of densely populated cities that have large slums, such as Dhaka, Karachi, Jakarta, Mumbai, and São Paulo.
Socioeconomic targeting can make a big difference in fighting the pandemic. In mid-February, for example, the U.S. Centers for Disease Control and Prevention reportedly identified five cities as “high-risk”: New York, Chicago, Los Angeles, San Francisco, and Seattle. In retrospect though, San Francisco and Seattle are not nearly as high risk as cities like Detroit and New Orleans. That’s where the CDC’s community surveillance effort might have been better focused. Many middle-income countries now have high-resolution poverty maps. They should put them to work.
3. Test, treat, track, and talk (like the Taiwanese)
With such a quick and vicious virus, a week’s delay can make all the difference. Policymakers, medical professionals, and employers in San Francisco acted sooner to slow the spread than those in New York City. City and state governments communicated a lot better in California than in New York: Compare, for example, the COVID-19 response web pages for New York City and San Francisco. (Note the New York State Government does have a decent website, and San Francisco does not publish COVID-19 hospitalizations).
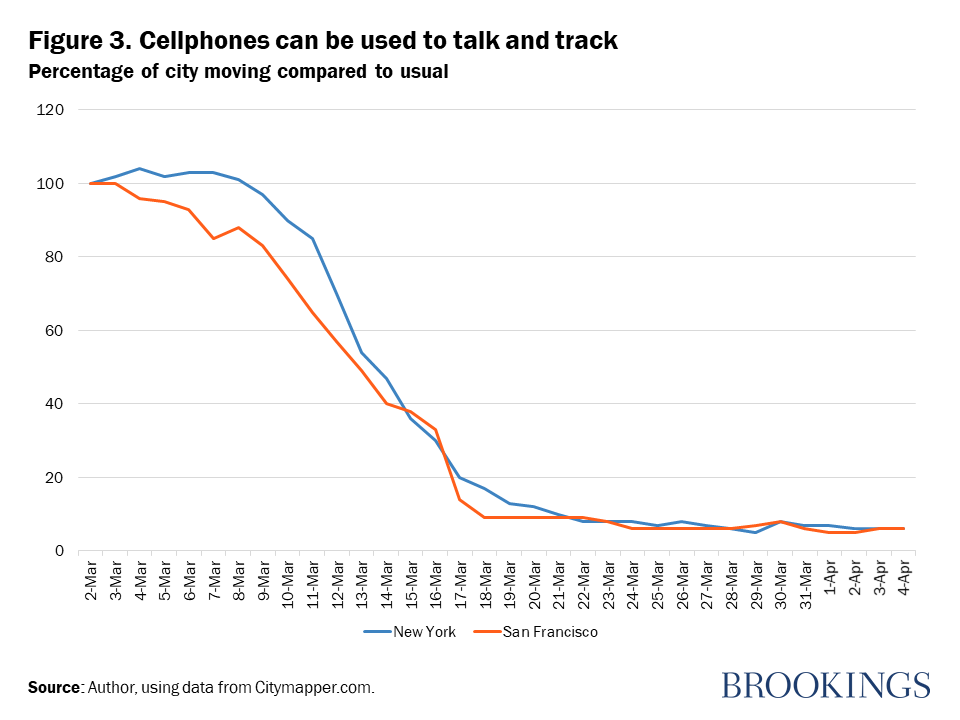
With the proliferation of cellphones around the world, there are reliable ways to monitor the effectiveness of these measures in real time. For example, Citymapper, an easily accessible travel planning app, provides information on changes in movement of people in cities around the world, including California and New York. Using this technology, Figure 3 suggests that San Franciscans reacted more quickly than New Yorkers to calls by health officials to stay at home (though it is also clear that government leaders in New York moved more slowly and did not communicate as clearly as in California).
California has done much better than New York and their experiences provide useful pointers for everyone. But the best practice in responding to COVID-19 comes from Taiwan. Being 80 miles away from China has benefits, but it comes with costs. One of them is high vulnerability to diseases on the mainland. Taiwan suffered the world’s third-highest death count during the SARS epidemic in 2003. But unlike many others, it has learned the lessons well. Its response this time ought to help in writing the pandemic playbook for governments around the world. Watch this short clip to see what the Taiwanese have been doing; I’ll be writing more about Taiwan in an upcoming blog.
Related Content
Author

The Brookings Institution is committed to quality, independence, and impact.
We are supported by a diverse array of funders. In line with our values and policies, each Brookings publication represents the sole views of its author(s).


Commentary
Coronavirus lessons from New York and San Francisco
April 7, 2020