This post has been updated to correct the win percentage for President Trump’s endorsees and also to add races which were called after the initial post was written.
 All midterm elections become referenda on the sitting president, and this one was no different. The New York Review of Books even cited UCSD election scholar Gary Jacobson’s assertion that “a sitting president has never been as central an issue in a midterm election as Trump is in 2018.”
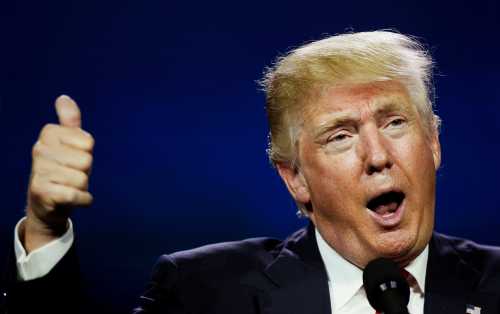
So how should we interpret what this means for Trump? The first is to see how his candidates did on Election Day, and to compare how they did with other national figures. Here at Brookings, we kept track of all the House and Senate candidates who were endorsed by one of the following major political figures: President Trump, Vice President Pence, former President Obama, former Vice President Biden, or Sen. Bernie Sanders. We then calculated how the candidates they endorsed performed on election night.
We also kept track of the PVI (partisan voter index) for the states or districts involved. Consistent with his behavior since being elected, Trump made no effort to convert voters in this election, mostly playing to his base. We can see that in the fact that Trump endorsed candidates who were mostly in fairly Republican districts; the average PVI of the districts in which Trump endorsed someone was R+7.6, and the average PVI for districts in which Pence endorsed was R+4 In other words, Pence was endorsing in somewhat less-safe territory for Republicans. Obama stuck to districts that were slightly Democratic in their history, but still close enough to be competitive. Only Biden endorsed in truly swing (or purple) districts. And Sanders stuck to very Democratic districts (D+10)
As we can see from the bar graph below, Trump endorsed 75 House and Senate candidates, of whom 42 or 55 percent won. With this rate, Trump performed better than Vice President Mike Pence, for whom nearly 50 percent won, but fell behind Obama’s and Biden’s endorsees. Sanders does the best, as his endorsees won 70 percent of the time.
A subset of the endorsements are those candidates that the major political figures actually campaigned for. This variable includes only public appearances where the candidate was present and the principal actually spoke his or her name. Again, Trump stuck to Republican states/districts with an average PVI of R+7.8. Pence’s campaign districts had an average PVI of R+4. Obama campaigned in close districts, and Biden’s average district was R+3.33. Once again, Sanders only campaigned in very Democratic districts, districts where the average PVI was D+10.
The following bar graph shows how they did. Sixty-four percent of the candidates Trump campaigned for won their districts, compared to 35 percent of those Pence campaigned for. However, as noted above, Pence campaigned in districts that were more competitive. Obama’s and Biden’s endorsees won 62 percent and 64 percent, respectively, of the races in which they campaigned. Sanders won 69 percent of the races in which he campaigned, but, again, he tended to stick to places that were more Democratic.
Finally, we tracked major national organizations that endorsed candidates. The Democratic Congressional Campaign Committee (DCCC) and the National Republican Campaign Committee (NRCC) endorsed candidates in close congressional districts—as would be expected of the two major party committees. We also looked at two outside groups: Our Revolution, a group started by Bernie Sanders supporters to support liberal candidates, and the Club for Growth, a conservative organization.
As would be expected, the two formal party committees concentrated on swing districts, since their goal Tuesday night was to pick up or hold a majority in the House of Representatives. The DCCC won 46 percent of their endorsed races, and the NRCC won 33 percent of their endorsed races. The two outside groups we looked at pretty much stayed close to home. The Club for Growth won 79 percent of their endorsed races, and it played primarily in Republican leaning districts. Our Revolution won 31 percent of its races, playing in districts that leaned Democratic.
The second way to see what these midterms might mean for presidential politics is to use statewide vote totals for governor or senator as a proxy for what a presidential vote might be were Trump on the ballot right now. It’s a very imperfect proxy for sure, especially since there is no clear Democratic opponent. But it can give a sense of partisan strength for the presidential race. Let’s start with the three states that Trump won in 2016, surprising the Democrats and giving him his Electoral College victory: Pennsylvania, Michigan, and Wisconsin. Democrats will be heartened to see that, in Pennsylvania and Michigan, Republicans at the top of the ticket did worse than Trump did in 2016. That was not the case in Wisconsin, even though that state’s Republican governor, Scott Walker, lost his race.
| Percent Trump vote, 2016 | Percent Republican vote for governor, 2018 | |
| Pennsylvania | 46.2% | 40.8% |
| Michigan | 47.5% | 44.09% |
| Wisconsin | 47.2% | 48.4% |
While Democrats may be encouraged by strong performances in these states, they have to be disappointed with the performance in two other key states in a presidential race: Florida and Ohio.
In Florida, the governor’s race is so close that a recount is possible. Of course, that’s nothing new for the Sunshine State, where the most famous close race of all time—the presidential race of 2000—ended up at the Supreme Court. And in Ohio, the state best known for making presidents, the Democratic top of the ticket had a very bad night. The Republican, Mike DeWine, won with 50.66 percent of the vote–several points ahead of his Democratic rival.
| Percent Trump vote, 2016 | Percent Republican vote for governor, 2018 | |
| Florida | 49% | 49.73% |
| Ohio | 51.7% | 50.66% |
In conclusion, we can only say that reading the tea leaves from the 2018 election is tough. President Trump and his party have plenty to crow about, as do the Democrats. But one final variable goes into the prognosticating, and that is the partisan age gap. Democrats in 2018 did very well with voters under 50 years old, but these voters don’t vote very often. According to the exit polls, the sum total of all the voters under 50 was only 44 percent of the electorate, while voters over 50 years of age constituted 56 percent of the electorate. Younger Americans, especially those under age 40, are very Democratic in their leanings. If Democrats can ever crack the problem of turnout among young people, or if Republicans can figure out how to attract young people to their side of the aisle, we might have some clearer election results. Until then, we remain a closely divided—but still divided—country.
Related Content
Related Books

Author

The Brookings Institution is committed to quality, independence, and impact.
We are supported by a diverse array of funders. In line with our values and policies, each Brookings publication represents the sole views of its author(s).
Commentary
Trump endorsed 75 candidates in the midterms. How did they fare on Election Day?
November 7, 2018