Last month, the World Bank published Poverty and Shared Prosperity: Piecing Together the Poverty Puzzle as a detailed guide to understanding the most recent trends in global poverty as well as setting forth an agenda of work yet to be done. The report documents the remarkable progress the world has achieved toward ending extreme poverty by documenting its decline from 1990 to 2015. In 1990, 36 percent of the world’s people lived in poverty—defined as an income of less than $1.90 a day in 2011 purchase power parity—and by 2015, only 10 percent of the world’s people lived in poverty. In raw numbers, that is a decline of over 1 billion people living in poverty. However, when compared to East Asia and the Pacific’s contribution to declining global poverty, and more recently South Asia, sub-Saharan Africa’s much slower fight against poverty has been unable to match the progress of these other regions. According to the report, people living in poverty in the region grew from 278 million in 1990 to 413 million in 2015. As of 2015, most of the global poor live in sub-Saharan Africa (Figure 1).
Figure 1: Distribution of global poor by region and country, 2015
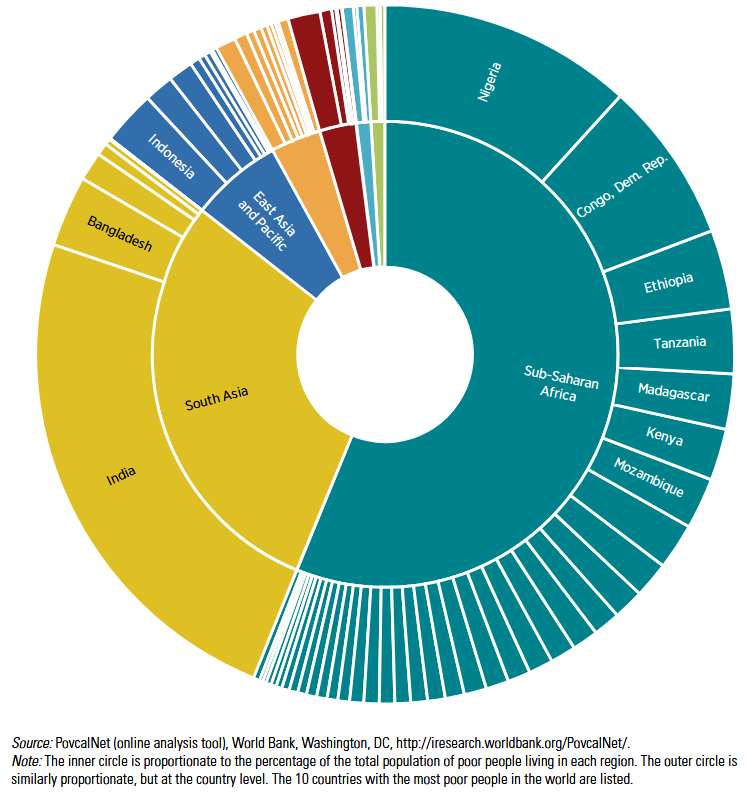
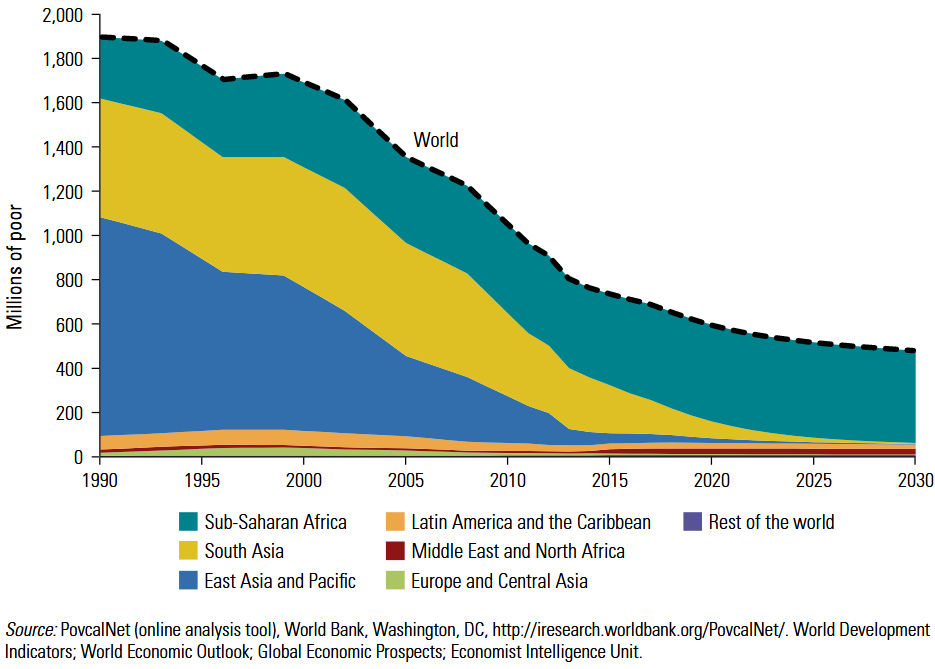
The average poverty rate for sub-Saharan Africa stands at about 41 percent, and of the world’s 28 poorest countries, 27 are in sub-Saharan Africa all with a poverty rate above 30 percent. Projections by the World Bank also show that extreme poverty is showing few signs of improvement in sub-Saharan Africa, and may keep countries from ending extreme poverty by 2030 (Figure 2). In part, the issue lies in the region’s slower rates of growth despite recent improvements. The report identifies problems caused by conflict, weak institutions, and a lack of resilience as major barriers to improving the outlook for the poor in sub-Saharan Africa.
Figure 2: Number of poor by region, 1990-2030
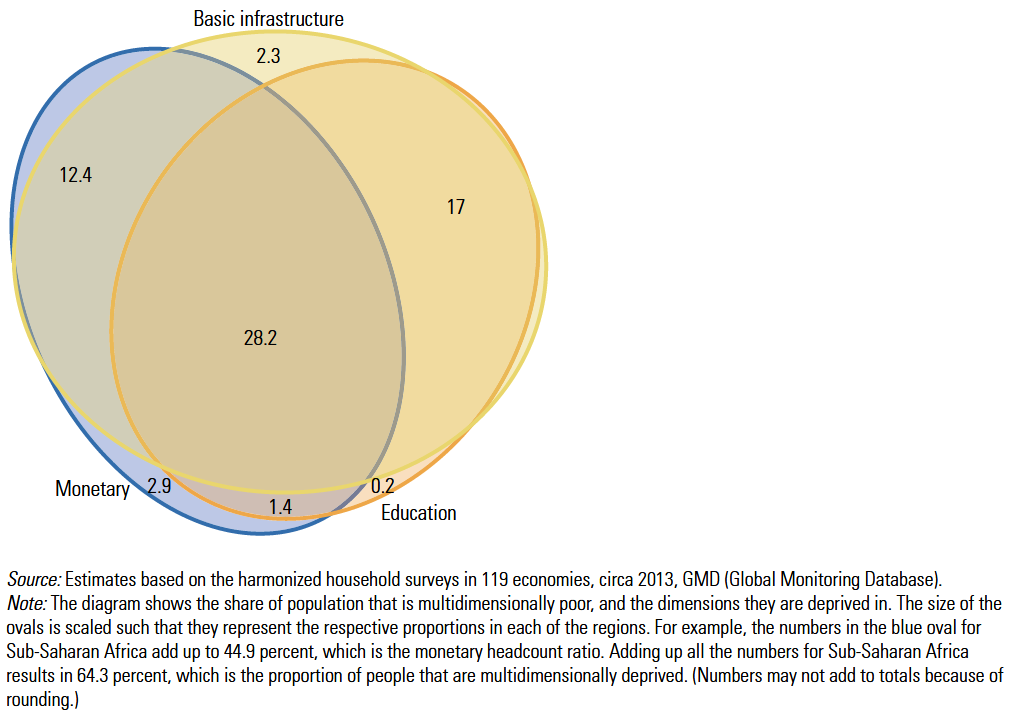
A unique aspect of poverty the report covers is its multidimensionality. The report suggests that being poor is not just defined by a lack of income. Well-being is an accumulation of many aspects, including education, access to basic utilities, health care, and security. Earning a certain threshold of income may still not be enough to meet these basic needs. Using this multidimensional definition of poverty, the report suggests the share of poor is approximately 50 percent higher compared to strictly monetary indicators. This is especially the case in sub-Saharan Africa. Figure 3 shows this multidimensional poverty by representing consumption (blue oval), education (orange oval), and access to basic infrastructure services including drinking water, sanitation, and electricity (yellow oval) as a layered Venn diagram. The figure identifies each individual categories contribution to total multidimensional poverty, as well as the overlaps. For instance, 28.2 percent out of the total 64.3 percent multidimensional poor experience simultaneous deprivations in education, consumption, and access to basic infrastructure.
Figure 3: Share of sub-Saharan African individuals in multidimensional poverty, circa 2013
Author

The Brookings Institution is committed to quality, independence, and impact.
We are supported by a diverse array of funders. In line with our values and policies, each Brookings publication represents the sole views of its author(s).

Commentary
Figure of the week: Understanding poverty in Africa
November 21, 2018