The African Growth and Opportunity Act (AGOA), which was signed into law by President Bill Clinton in 2000, is one of the important pieces of legislation defining the commercial relationship between the United States and sub-Saharan Africa. AGOA’s duty- and quota-free provisions have been instrumental in supporting African countries in accessing the American market, and the legislation is credited with creation of thousands of jobs in some of them. The current AGOA legislation expires on September 30, 2015, and Washington is abuzz with discussions and congressional hearings on its renewal. African governments have mobilized their diplomats in Washington to advocate for the speedy renewal of the legislation. However, while there is broad bipartisan and bicameral support to renew AGOA, there are many concerns about the effectiveness of the legislation in achieving the intended objectives.
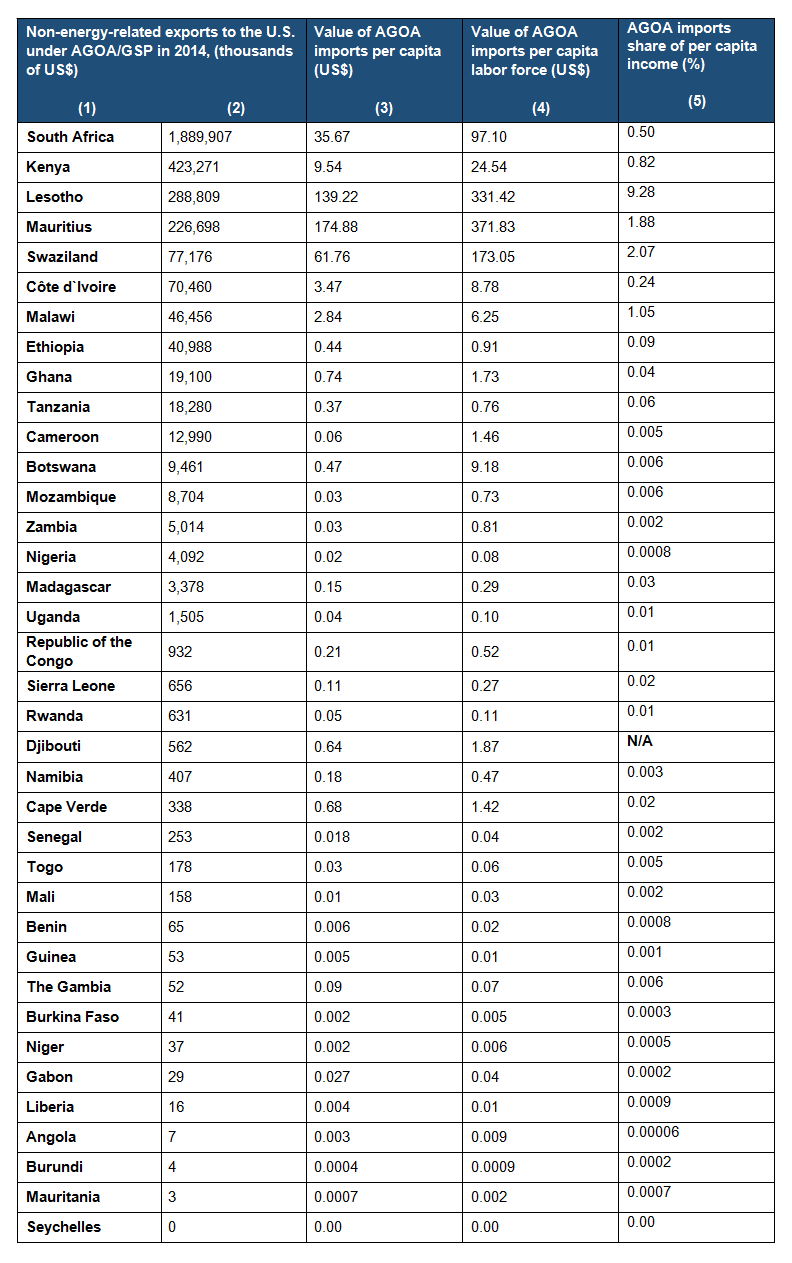
Probably the most important concern over AGOA relates to its utilization by eligible countries in terms of the composition and volume of the products exported. Crude oil dominates AGOA imports: In 2014, crude oil accounted for 46 percent of all AGOA imports, and energy-related products more generally represented 67 percent of all AGOA imports.[1] In fact, exports of energy-related products generally are associated with limited job creation and do not contribute to transformation of economies. Furthermore, African countries do not necessarily need preferences to export those products. In addition, although there has been a rapid increase in the volume of non-energy imports, only a small number of countries have taken advantage of the preferential treatment. In fact, most of AGOA non-energy imports are dominated by South Africa, which accounts for 60 percent of this category. Other countries with sizeable shares of AGOA non-energy imports include Kenya, Lesotho, Mauritius, and Swaziland. Imports from most other countries are very few in number. Table 1 below shows African countries and the value of non-energy AGOA imports.
Discussions on the utilization of AGOA focus on the aggregate data of imports as shown in column 2 of Table 1. But evaluating utilization by focusing on the aggregate value of imports is misleading and masks the scope of AGOA underutilization. In fact, such an approach in gauging utilization does not make economic sense. I propose alternative approaches to measuring AGOA utilization.
Normalizing Aggregate Utilization
A shortcoming of using aggregate values of AGOA imports to measure utilization is that they do not control for “utilization potential.” In Table 1, the data compares large countries such as South Africa (population 52 million) and Nigeria (population 173 million) with small countries such as Mauritius (population 1.2 million) and Cape Verde (population 0.5 million) without making any adjustments. In other words, the aggregate data does not take into account a country’s economic size or production potential. Thus, it is not appropriate to use aggregate data to evaluate AGOA utilization. Instead, the aggregate data should be normalized for the size of the population and also the labor force. In addition, to know how well a country is doing in utilizing AGOA, it is necessary to evaluate the contribution of its AGOA exports to income. Normalizing aggregate imports by total population, labor force, and per capita income provide a more accurate and meaningful depiction of AGOA utilization. This simple analysis provides a much clearer picture of AGOA utilization. Columns 3-5 of Table 1 show utilization by the sample countries in terms of value of AGOA imports per capita (AGOA imports/total population), value of AGOA imports per unit of labor (AGOA imports/labor force), and value of AGOA imports as a percentage of per capita income.
Normalizing the value of non-oil AGOA imports by total population and labor force reveals that the best utilizer of AGOA is Mauritius, followed by Lesotho, Swaziland, and then, in a distant fourth, South Africa. In per capita terms, AGOA imports are equivalent to $174, $139, $61, and $35 for Mauritius, Lesotho, Swaziland, and South Africa, respectively. Similarly, the values of AGOA imports per unit of labor are $371, $331, $173, and $97 for Mauritius, Lesotho, Swaziland, and South Africa, respectively.
Thus, in reality, South Africa performs relatively poorly in AGOA utilization. Similarly, Kenya, ranked second based on aggregate data, also scores poorly (a distant fifth) based on the normalized data. Importantly, the data also reveals that in other African countries, AGOA utilization is extremely low. For example, for Uganda, which is in the middle category in terms of aggregate values, AGOA imports are equivalent to 4 cents per capita and 10 cents per unit of labor. In most of the other countries, non-oil imports account for less than 1 cent per capita.
Another indicator of AGOA utilization is the contribution of AGOA imports to per capita income. In some cases, like Lesotho, in which AGOA imports account for 9.28 percent of per capita income, AGOA is particularly important. Other countries—Swaziland (2.07 percent), Mauritius (1.88 percent), and South Africa (0.5 percent)—do not experience the same contribution, though it is not insignificant. On the other hand, AGOA’s contribution of income to many other countries is negligible. For example, for Uganda, AGOA accounts for only 0.01 percent of per capita income. For most of the other African exporters of non-oil products, AGOA contributes to less than 0.0001 percent of per capita income. Thus, for the majority of countries, AGOA does not contribute to poverty reduction. In general, the data in columns 3-5, compared to the aggregate values in column 2, more accurately depicts the extent and variation of AGOA utilization.
Accounting for value added
Another shortcoming with using the aggregate values presented above is that these values overestimate the extent of AGOA utilization because the data does not capture the value added by the exporting countries. This is a general problem with international trade data and not just with AGOA imports. Capturing value added is particularly important today when a large proportion of international trade is comprised of parts and components rather than just final products. In the case of apparel, which comprises one of the most important non-oil AGOA imports, many components of the final product are imported by African countries from outside the continent. For example, consider a case where Kenya imports fabric worth $10,000 from Malaysia and manufactures sportswear worth $30,000 for export under AGOA. In this case, the value added by Kenya is $20,000 while the value of U.S. imports from Kenya is recorded as $30,000. Thus, the aggregate value of AGOA imports overestimates the true utilization.
The failure to capture the value added in cases where African countries are involved in the production of parts and components that go into the final production of exports in another AGOA-eligible country also results in poor measurement of utilization. Consider a case where Lesotho exports leather products worth $10,000 to South Africa. In turn, South Africa manufactures car seats worth $30,000, which are exported to United States. In this case, Lesotho’s indirect utilization of AGOA is not captured while South Africa’s recorded utilization of AGOA is higher than it actually is. Thus, with the deepening of regional integration in Africa and subsequent increased participation in regional production value chains, the available data of AGOA utilization becomes increasingly meaningless. In short, if we want to capture the true extent of AGOA utilization by the various eligible countries, we need better data that captures value added at the country level.
Conclusions and policy implications
Clearly, these data challenges have consequences for how policymakers, African and American, should approach AGOA’s renewal. When deliberating on these issues, analysts and policymakers should take care to keep the following thoughts in mind:
- Using aggregate values to evaluate utilization of AGOA is meaningless and does not reveal the true extent of utilization. To get a better picture of AGOA utilization, the aggregate values of imports should be normalized by the source country’s population size and productive potential.
- Normalizing the data based on total population and labor force shows that, overall, the utilization of AGOA is extremely low. Although a few countries are exploiting the benefits afforded by AGOA, most are not. In addition, while the contribution of AGOA to the per capita incomes of some countries such as Lesotho, Swaziland, and Mauritius is reasonable, for most of the other countries, it is insignificant.
- AGOA has the potential to transform Africa’s economies. As observed, AGOA contributes to nearly 10 percent of Lesotho’s per capita income, and it is credited with the creation of thousands of jobs in that country. Thus, while overall utilization is dismal, the evidence suggests that AGOA has great potential, and thus its extension is justified. Other African countries can learn from Lesotho on strategies to exploit AGOA. However, it is also unlikely that utilization will change significantly without some measures to enhance the legislation, such as expanding the number of eligible products.
- The extension of AGOA is important but will not alter the dismal levels of utilization. The issue for African countries to focus on should be strategies to increase utilization. Merely extending AGOA will not change the dismal record of utilization so far. Developing a national AGOA strategy, as has been done in Ethiopia, is an integral step toward increasing utilization. These country strategies help promote utilization by providing key information on the strengths and limitations of various export sectors, proposing mechanisms for overcoming barriers to trade, and listing the diverse set of actors and resources available to support exporters seeking to take advantage of AGOA.
- Participating in AGOA involves some specific costs—sunk costs so to say—like the establishment of AGOA desks in the trade ministries, resources expended in compliance, participation in the annual AGOA forums, etc. For some countries, it appears that the costs of participating in AGOA could be greater than the net benefits. In other words, participation in AGOA could be a net loss for countries. It is therefore crucial for countries to undertake a cost-benefit analysis of participation.
- The extremely low utilization level of most of the African countries suggests the real problems are low productivity and the high costs of doing business. For some category of countries, the best policy for the United States is to support strategies to enhance productivity and improve the environment for doing business.
- Without data of the value added by the African countries, the reported data overestimates the true utilization of AGOA. Thus, there is need to invest in collecting data at the country levels to capture the actual value added. The new AGOA legislation should therefore include specific requirements for better data collection by the exporting countries.
Table 1. AGOA utilization (non-energy-related exports)
Sources: Data on the value of non-energy-related products exported to the U.S. under AGOA/GSP in 2014 are from U.S. International Trade Commission DataWeb (http://dataweb.usitc.gov/). Non-energy-related products are all products listed in the Harmonized Tariff Schedule (http://hts.usitc.gov/), except those defined in chapter 27 – Mineral fuels, mineral oils and products of their distillation; bituminous substances; mineral waxes.
Data on income, labor force and population are from the World Bank DataBank (http://databank.worldbank.org/data/home.aspx) for the latest available year (2013).
[1] Crude oil is classified under HTS 4-digit category 2709 while energy-related products are defined as HTS chapter 27.
The Brookings Institution is committed to quality, independence, and impact.
We are supported by a diverse array of funders. In line with our values and policies, each Brookings publication represents the sole views of its author(s).


Commentary
AGOA Utilization 101
March 23, 2015